STRATEGY OF STRENGTHENING PUBLIC PURCHASING POWER IN PEMALANG DISTRICT
Ali Imron
(Student Doctoral Program of Management Science University of Jenderal
Soedirman Purwokerto / DPK Lecturer in STIE ASSHOLEH Pemalang)
email : imron.alialta@gmail.com
ABSTRACT: Human development index is one indicator in the measurement of development success. In general, this study aims to identify the level of income and public expenditure in Pemalang District, analyze the determinant factors of the increasing consumer purchasing power in Pemalang District and formulate the strengtheningstrategies of purchasing power in order to improve the welfare of the community. This study uses panel data analysis with Pooled Least Square Analysis, Fixed Effect Analysis and Random Effect Analysis. The population is 317,586 households (source: BPS Kabupaten Pemalang) and the minimum sample size with Slovin is 399,50 households or rounded for 400 households. The level of community income (household) based on the average primary data collection is Rp. 7,035,137. Based on the main type of work, the highest level of income is in the trading business that is Rp.10.995.238. Meanwhile, other types of jobs such as civil servants, employees, drivers and others who cultivated the community showed a low level of Rp. 3.631.111. The level of public expenditure (households) shows that the type of trade occupation has a higher level of expenditure than other types of work that is Rp. 4.952.857. While the type of agricultural work has a low level of expenditure of Rp. 1.584.286. The result of the regression analysis of the effect of ownership of land production factors on income shows a negative sign. While result of regression analysis influence of working capital / investment, education level, health level and skill level to earnings show positive sign. The influence of income, personal and social factors of consumers in purchasing decisions on expenditures shows a positive effect. While the effect of price increase, interest rate savings and consumer culture in purchasing decisions on expenditure showed a negative sign. Strengthening strategy of public purchasing powerin Pemalang District from income side can be done through capital / investment improvement strategy and labor quality improvement strategy. While strengthening consumer purchasing power in Pemalang District from expenditure side can be done through strategy of price control of goods / services and consumer behavior development strategy.
Keywords : Public Purchasing Power, Income, Expenditure, Purchasing Power Strategy INTRODUCTION
The development of Pemalang District in the medium term ahead, has a vision of "INTRODUCING OUTSTANDING, GRAND, SUCCESSFUL AND PROSPECTIVE GREATERS". The vision is the result of the political process of the election of regional head and deputy head of region directly by the community and serve as the main substance and reference for the preparation of RPJMD, which is further set out in Regional Regulation No. 12 of 2016 on the Regional Medium Term Development Plan of Pemalang District 2016-2021.
One measure of the success of achieving that vision is the Human Development Index (HDI) of 66.67 in 2021. The Human Development Index (HDI) is formed by composite indicators namely Education, Health and Purchasing Power Parity, IPM or Human Development Index. With three indicators, the parameters are expected to be one of the instruments of how the development policy in Pemalang District is able to guarantee at least three of the most basic choices of the population that is the choice to live long, the choice to possess knowledge and the option to live worthy. That is why the demand to improve the HDI is not only intended to fulfill the basic rights of the population but also in order to build a solid foundation of Pemalang District's economy.
Although the HDI of Pemalang District continues to increase every year, the achievement of HDI is not yet optimal. Compared with other regencies/cities in Central Java Province IPM Pemalang District is in the 34th position of 35 districts / cities. Human Development Index until 2015 indicates a significant increase in realization. In the period 2010-2015 there was an increase of 4.97 points.
Meanwhile, when viewed from its performance, the index of purchasing power is lower than the health and education index. Of the three indexes, the attainment of purchasing power index was only 24.13, lower than the health index of 81.18 and the education index of 53.08. This suggests that the issue of purchasing power within the framework of increasing HDI needs to be the focus of attention, while still not ruling out the education index and health index as a single entity in human development.
Based on the estimation phase of purchasing power, it appears that there are two pillars determining consumer purchasing power that is household income and expenditure. The first pillar is related to the ability to earn some money, while the second pillar concerns the use of money in the household to meet the needs of life. Household expenditure is also influenced by macroeconomic performance related to price stability aspect. When the prices of goods generally rise or inflation occurs, then the ability to obtain goods will decrease if the amount of income remains. In order for the purchasing power to be fixed then there must be an increase in income that exceeds the level of inflation. A better condition is that income continues to rise on one side and there is a satisfactory price stability on the other.
Through the research of Strengthening Strategy of Public Purchasing Powerin Pemalang District is expected to be a material policy making in the economic development in increasing the purchasing power of the community through various efforts and the distribution of income leads to the eradication of poverty and improving people's welfare.
The research objectives of Strengthening Strategy of Purchasing Power Parity in Pemalang District are: 1) Identify income and expenditure level of community in Pemalang District.
2) Analyze the determinant factors of increasing purchasing power in Pemalang District.
3) Formulate the strengthenstrategies of purchasing power in order to improve the welfare of the community.
Purchasing Power Index
Purchasing Power Parity (PPP) is an indicator used to assess the economic condition of the community in calculating IPM. This purchasing power capability better reflects the economic capacity of the community to meet its consumption needs, and is significantly different from the per capita PDRB (known as income per capita). To measure a decent living standard, per capita PDRB data can not be used because it is not a sensitive measure to measure ability of people's purchasing power. Therefore, the calculation of the purchasing power of the population using the capsule consumption is then adjusted. Sources of data used include the amount of expenditure per capita of both food and non-food consumption. The commodities used in new purchasing power parity (PPP) calculations use 96 commodities where 66 commodities are food and the rest are non-food commodities.
Determinant Factors of Public Purchase Power
The determinants of people's purchasing power are basically determined by income and expenditure factors. Income is a measure used to describe the standard of living. People who have high incomes generally have a high standard of living. The difference in income reflects differences in quality of life. The main factor affecting the difference in standard of living (shown by the large difference in income) is the level of productivity. Productivity refers to the amount of goods and services a worker can produce. Thus, a society can enjoy a high standard of living if the community can produce goods and services in large numbers. One of the most commonly used production functions in empirical research is Cobb-Douglas. This function also puts the amount of production as a function of capital (capital) by the factor of labor (labor). Thus it can also be explained that the results of production with quantity or a certain amount will generate a certain level of income as well. In simple terms Cobb-Douglas production functions can be written as follows:
Q = βαK AL
Where Q is the output and L and K are labor and capital goods respectively. A, α (alpha) and β (beta) are positive parameters which in each case are determined by the data. The greater the value of A, the tech stuff more advanced. The parameter α measures the percentage increase in Q due to an increase of one percent L while K is maintained constant. Similarly, the β parameter measures the percentage increase in Q due to a 1% increase in K while L is maintained constant.
Thus, α and β are the output elasticities of capital and labor, respectively. If α + β = 1, then there is constant addition to the production scale; if α + β> 1 there are additional results that increase on the scale of production and if α + β <1 then it means that there are additional results that decrease on the scale of production.
Thinking Flow of Research Process
Thinking flow of research process is as follows:
a. Phase of Identificationof Publilc Purchasing Power
of the community based on the main job field that can describe the level of poverty and welfare of society in Pemalang District.
b. Phase of Analysis of Determinant Factors of Public Purchasing Power
The analysis phase of determinant factors of public purchasing power is an analysis that describes the influence of determinants of income and public expenditure on the amount of purchasing power of the community. Analysis at this stage includes:
1) The use of factors of production
This analysis emphasizes that the use of production factors both capital and labor will affect the size of income obtained by the community.
2) Income level
This analysis emphasizes that the income level affects the amount of consumption made. The higher the level of income a person, the more goods and services that can be consumed.
3) Price level
This analysis emphasizes the increase and decrease in the price level will affect the public spending or consumption. In other words, the increase in the price of goods will lower the level of consumption. And if the price of goods decreases, the level of consumer consumption will rise.
c. Analysis Phase of Data Panel
The analysis phase of panel data is the empirical analysis stage to know the influence of the use of production factor, income level and price level to income and public expenditure. Analysis panel data used is regression analysis about dependence of a dependent variable with the intent to estimate or predict the average value of population dependent variable based on fixed value of independent variable.
d. Formulating the Strengthen Strategy ofPublic Purchasing Power
Stage of formulating the strengthen strategy of public purchasing power is the determinant of determination of development policy based on the influence of factors that can increase people's purchasing power.
Thinking flow of research process of Strengthening Strategyof Public PurchasingPower in Pemalang District can be seen in the following picture:
Primary data are data and observations collected directly by the method used are:
1) Survey / Interview, conducted to get the primary picture of the respondent / community about the level of income and expenditure that can describe the ability of people's purchasing power. 2) Observation, conducted to obtain information and facts primary / direct about the condition of the level of welfare of the community which is the result of field observation visually.
Secondary data
Secondary data is data and information that already exist that sourced from research or service / institution related to condition of social economic prosperity of society in District Pemalang, among others: data of physical condition of region, Pemalang District in Number, PDRB Pemalang District, RT/RW Pemalang District, Susenas Data, poverty data and investment data
Data Variable
Variable Data used in Public Purchasing Power Strategy in Pemalang District is as follows: Table 1 Data Variable
Variable Sub Variable Indicator Income Ownership of Production Factor Land
Investation Saving Account
Labour Education
Health Skill Outcome/Consumption Invome level Income
Price level Inflation Interest level Interest Savings Consumer behaviour Culture
Social Private Source: Data Analysis
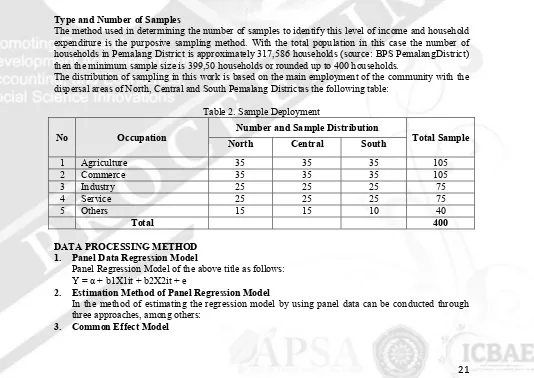
Type and Number of Samples
The method used in determining the number of samples to identify this level of income and household expenditure is the purposive sampling method. With the total population in this case the number of households in Pemalang District is approximately 317,586 households (source: BPS PemalangDistrict) then the minimum sample size is 399,50 households or rounded up to 400 households.
The distribution of sampling in this work is based on the main employment of the community with the dispersal areas of North, Central and South Pemalang Districtas the following table:
Table 2. Sample Deployment
No Occupation
Number and Sample Distribution
Total Sample
North Central South
1 Agriculture 35 35 35 105
2 Commerce 35 35 35 105
3 Industry 25 25 25 75
4 Service 25 25 25 75
5 Others 15 15 10 40
Total 400
DATA PROCESSING METHOD 1. Panel Data Regression Model
Panel Regression Model of the above title as follows: Y = α + b1X1it + b2X2it + e
2. Estimation Method of Panel Regression Model
In the method of estimating the regression model by using panel data can be conducted through three approaches, among others:
It is the simplest model panel data approach because it only combines time series and cross section data. In this model is not considered the dimensions of time and individual, so it is assumed that the behavior of household data is the same in various periods. This method can use the Ordinary Least Square (OLS) approach or the least squares technique to estimate the panel data model. 4. Fixed Effect Model
This model assumes that differences between individuals can be accommodated from different intercepts. To estimate Fixed Effects model panel data using a dummy variable technique to capture different intercept interconnections, however, the slopes are the same between households. This estimation model is often also called the technique of Least Squares Dummy Variable (LSDV).
5. Random Effect Model
This model will estimate panel data where interference variables may be interconnected between time and between individuals. In the Random Effect model, the difference between intercepts is accommodated by the error terms of each household. The advantage of using the Random Effect model is to eliminate heteroscedasticity. This model is also called the Error Component Model (ECM) or Generalized Least Square (GLS) technique.
ANALYSIS RESULTS OF THE INFLUENCE OF DETERMINANT FACTORS TO THE PUBLIC PURCHASING POWER
Analysis of the influence of determinant factorstopublic purchasing power is a multiple linear regression analysis used to determine the influence of each independent variable to the non-free variable that is income and expenditure. This analysis uses SPSS program
Revenue Rate
The level of community income (household) based on the average primary data collection is Rp. 7,035,137. Based on the main type of work, the highest level of income is in the trading business that is Rp.10.995.238. Meanwhile, other types of jobs such as civil servants, employees, sopianan others who cultivated the community showed a low level of Rp. 3.631.111.
Based on its dispersal area, the northern region covering District Pemalang, Taman, Petarukan, Ampelgading, Comal, Ulujami has high income level which is Rp.9.930.095. While the region that has the lowest income level is the middle area which includes Bantarbolang, Randudongkal, Warungpring,
Bodeh that is Rp.5.126.800.
Influence of Income
Effect of Ownership of Land Production Factors onIncome
The analysis of the effect of ownership of land production factors on income shows a negative sign with the equation Y = 6.410.074,360-2117096.133X1 which means that the increase of land owned by the community does not have the potential to increase revenue
Effect of Ownership of Production Factor of Investment onIncome\The result of the regression analysis of the effect of working capital / investment on income also shows positive sign with the equation Y = 3.579.817,036 + 879614.884X2 where the increase of working capital / investment will result in the increase of income.
Effect of Education Level on Income
The result of regression analysis of influence of education level as labor capital to income increase also show positive influence with equation Y = 3,701.178,571 + 229672.628X4 meaning long duration of education level of labor will guarantee in increasing earnings, because result of data analysis stated that if education of energy work increases then income will increase.
Influence of Health Level on Income
The influence of health level on income also shows a positive influence with the equation Y = -336.239,857 + 1603728.519X5. in which the health condition of the workforce will be guaranteed in increasing the income, because the data analysis results state that if the health condition of labor increases then income will increase.
The Effect of Expertise Level on Income
The effect of the skill level on income also shows a positive effect with the equation Y = 2.818.647,331 + 730661.102X6 where the skill level of the workforce will affect income because the data analysis results state that if the skill level of the workforce increases, the income tends to increase.
Spending Rate
expenditure is south area that is equal to Rp. 4,034,943. While the region with the lowest level of public spending is the northern region of Rp. 2,286,610.
Influence of Spending Factor
Effect of Increase in Income on Expenditure
The result of the regression analysis of the effect of income increase on expenditure also shows a positive influence with the equation Y = -276.229,427 + 791510.031X7. The meaning of the equation is the increase in income level will affect the consumption expenditure because based on the data analysis results stated that the level of income increases, the consumption expenditures tend to increase Inflation Rate Influence on Expenditure
The result of the regression analysis of the effect of price increase on expenditure also shows negative sign with the equation Y = 894.316,234 -218984.067X8 which means the increase of price level will affect the consumption expenditure because based on the data analysis result that if the price of goods increases, then the expenditure to buy goods / services tend to decrease.
Influence of Interest Rate of Deposits on Expenditure
The increase of deposit interest rate also gives negative effect to expenditure with the equation Y = 3,429,883,232-52056.684X9 which means the increase of daily and futures deposit interest rate does not guarantee will affect the expense because based on the data analysis stated that if the interest of daily or futures savings increases then the expenditure consumption will also decrease.
The Influence of Consumer Culture on Expenditure
The result of regression analysis of consumer culture influence in purchasing decision toward expenditure showed negative sign with equation Y = 847.465,916 -466591.492X10 means that consumer behavior based on prevailing cultural value system does not guarantee will influence expenditure because of change of cultural value system tends to decrease expense.
The Consumer Social Influence On Expenditure
The social influence of consumers in purchasing decisions also shows a positive effect on expenditure with the equation Y = 597.595,623 + 328480.717X11 meaningful consumer behavior based on the role and social status in family and society tends to affect consumption expenditure because the higher the role of social status in family and society then consumption expenditure is also increasing.
Personal Influence of Consumers on Expenditures
The influence of personal factors of consumers in purchasing decisions also shows a positive effect on expenditure with the equation Y = 315.411,993 + 832454.621X12 means that consumer behavior based on personality and lifestyle tend to affect consumption expenditure because the higher personality and lifestyle, the expenditure will increase.
DOMINANT DETERMINANT FACTORS OF PUBLIC PURCHASING POWER
By looking at the results of data analysis of determinant factors of public purchasing power on various factors affecting income level and level of public expenditure, the target of strengthening people's purchasing power is as follows:
Increased revenue
Y = 6.769.708.628- 2.117.096,133X1 + 879.614,884X2 + 4.130.896,490X3 + 229.672,628X4 + 1.603.728,519X5 + 730.661,102X6
Based on the results of multiple regression analysis, the increase in income to increase purchasing power in Pemalang District is done through:
1) Increased working capital and community investment 2) Improvement of community education
3) Improvement of public health 4) Increased community skills Increased Spending
Y = -2.726.337,657 + 791.510,031X1 - 218,984,067X2 - 52,056,684X3 - 466,591,492X4 + 328,480,717X5 + 832,454,621X6
Based on the result of multiple regression analysis, the increase of expenditure to increase purchasing power of society in Pemalang District is done through:
1) Increased income levels of the community 2) Lower inflation
3) Decrease in interest rate
STRATEGY OF STRENGTHENING PUBLIC PURCHASING POWER
The strategy of strengthening public purchasing power in Pemalang District is in principle prepared to increase people's income so that purchasing power of goods / services will increase. In addition, the increased purchasing power of the community will contribute substantially to the Human Development Index (IPM) of Pemalang District which is still low. High purchasing power will drive the real sector and impact on improving people's welfare.
CAPITAL / INVESTMENT IMPROVEMENT STRATEGY
1) Facilitating capital access to bank and non-bank financial institutions.
2) Facilitating access to capital to government and private companies in the form of (Corporate Social Responsibility)
STRATEGY FOR IMPROVING QUALITY OF EMPLOYMENT
1) Enhancement of nine year compulsory education program
2) Development of Secondary and Vocational Schools in a particular field
3) Pioneering entrepreneurship education in universities by organizing entrepreneurship courses as courses.
Increasing Degree of Labor / Community Health
1) Increasing the availability and quality of health care facilities, medicines and health supplies, health workers, financing and health management.
2) To educate businessmen and workers on the importance of OHS.
3) Provision of health insurance and social security of labor conducted by business actors
4) Regular monitoring and inspection of tools at high risk in employment, especially those that may cause disability or death
Increasing Manpower Skills
1) Development of education and job training in accordance with the needs of the labor market and employment opportunities
2) Development of education and job training in accordance with the development of science and technology.
STRATEGYOF GOODS / SERVICE PRICE CONTROL
1) Conducting market operations on staple goods.
2) Increasing trade infrastructure that facilitates the distribution of goods and services
3) Establishing an inflation control institution with components of employers‘ organizations, workers' organizations, universities and local governments.
STRATEGY OF CONSUMER BEHAVIOR DEVELOPMENT
1) Educating the importance of transactions in Pemalang
2) Facilitating the needs of consumers and consumer considerations in making purchasing decisions goods / services
CONCLUSION
The conclusion that can be drawn from the research of Strategyof Strengthening Public Purchasing Power in Pemalang District is as follows:
2. The level of public expenditure (households) shows that the type of trade occupation has a higher level of expenditure than other types of work that is Rp. 4.952.857. While the type of agricultural work has a low level of expenditure of Rp. 1.584.286.
3. The result of the analysis of the effect of ownership of land production factors on income shows a negative sign where the increasing land owned by the community does not have the potential to increase income with the equation is grad is Y = 6.410.074,360 -2117096.133X1.
4. The result of regression analysis of the effect of working capital / investment on income also shows positive sign that the increase of working capital / investment will result in the increase of income with the equation is Y = 3.579.817,036 + 879614.884X2.
5. The result of the regression analysis of the influence of the level of education as the capital of labor to income increase also shows a positive influence where the length of education level of the workforce will guarantee in increasing the income with its equity is Y = 3.701.178,571 + 229672.628X4.
6. The influence of the level of health on income also shows a positive effect where the health conditions of the workforce will guarantee in increasing revenue with equations is y = -336.239,857 + 1603728.519X5.
7. The effect of skill level on income also shows a positive influence where the skill level of the workforce will affect income with the equation is Y = 2.818.647,331 + 730661.102X6.
8. The effect of income increase on expenditure also shows a positive influence where the increase in income level will affect consumption expenditure with the regression equation is Y = -276.229,427 + 791510.031X7.
9. The effect of price increase on expenditure also shows a negative sign where the increase in price level will affect the consumption expenditure with Y = 894.316.234 -218984.067X8.
10. An increase in the deposit interest rate also negatively influences expenditures in which an increase in the interest rate of daily and futures deposits does not guarantee the effect of expenditure with the regression equation is Y = 3.429.883,232 - 52056.684X9.
11. The influence of consumer culture in purchasing decisions on expenditure shows a negative sign that consumer behavior based on the prevailing cultural values system does not guarantee will affect the expenditure with the equation of the grad is Y = 847.465,916 -466591.492X10.
12. The social influence of consumers in purchasing decisions shows a positive influence on expenditure where consumer behavior based on the role and social status in family and society tends to affect consumption expenditure with the equation is y = 597.595,623 + 328480.717X11 13. The influence of personal factors of consumers in purchasing decisions also shows a positive
influence on expenditure where consumer behavior based on personality and lifestyle tend to affect consumption expenditure with the regression equation is Y = 315.411,993 + 832454.621X12. 14. Of all the variables that influence the income level, the old variable of community education is the
variable that has the highest value of influence to income compared with other variables. The length of the education level of the workforce will guarantee in increasing revenue.
15. While the variables that most influence the level of public spending is the personal factor of consumers (the public). Consumer behavior based on personality and lifestyle tend to affect consumption expenditure because of the higher personality and lifestyle, then the expenditure will increase.
16. Strengthening people's purchasing power of Pemalang District from income side can be done through capital / investment improvement strategy and labor quality improvement strategy. While the strengthening of people's purchasing power of Pemalang District from the aspect of expenditure can be done through the strategy of price control of goods / services and consumer behavior development strategy.
REFERENCES
Abdurahman Maman, Dasar-dasar Statistik Untuk Peneliti, CV Pustaka Setia, Bandung, 2011 Agus Widarjono, Ekonomika teori dan Aplikasi, Ekonesia, Yogyakarta, 2007
Charisma Kuriata Ginting, Analisis Pembangunan Manusia di Indonesia, Universitas Sumatera Utara, Medan, 2008
Esmara Hendra, Perencanaan Pembangunan, PT. Gramedia, Jakarta, 1986
Ghozali, Imam, 2005. Aplikasi Analisis Multivariate dengan Program SPSS, Badan Penerbit Universitas Diponogoro.
Ismiyati, Statistika Dan Aplikasinya, Magister Teknik Sipil, Universitas Diponegoro, Semarang, 2003, Kunarjo, Perencanaan dan Pengendalian Program Pembangunan, UI Pres, Jakarta, 2002
Kuncoro Mudrajad, Ekonomi Pembangunan : Teori, Masalah dan Kebijakan UPP AMP YKPN, Yokyakarta, 2006
Prima Rosa, Pendidikan dan Mutu Manusia, Jurnal Sosioteknologi Edisi 12, Jakarta 2007 Riduan, Skala Pengukuran Variabel-variabel Penelitian, Penerbit Alfabeta, Bandung, 2010 Santoso, Singgih. 2004. Buku Latihan SPSS Statistik. Jakarta; PT. Alex Media Komputindo. Sugiyono. 2010.Metode Penelitian Kuantitatif, Kualitatif, dan R&D. Bandung: Alfabeta
Sukirno Sadono, Ekonomi Pembangunan : Proses, Masalah dan Dasar Kebijakan, Kencana, Jakarta, 2006