CRYSTAL STRUCTURE INVESTIGATION OF FERRITIC
73FE24CR2SI0.8MN0.1NI STEEL FOR MULTI-PURPOSE STRUCTURAL MATERIAL APPLICATIONS
Parikin1*, M. Dani1, A.K. Jahja1, R. Iskandar2, J. Mayer2
1Center for Science and Technology of Advanced Materials, BATAN, Kawasan Puspiptek, Serpong, Tangerang, Banten 15314, Indonesia
2Central Facility for Electron Microscopy (GFE), RWTH Aachen University, Ahorn strasse 55, D- 52074 Aachen, Germany
(Received: September 2016 / Revised: August 2017 / Accepted: October 2017)
ABSTRACT
Microstructural identification of synthesized steel with significant local content has been carried out. Alloy ingot was prepared using a casting technique. The samples were then formed into bulk steel by a machining process. A high resolution powder neutron diffractometer (HRPD) was used as an equipment for characterization. By applying neutron diffraction techniques, a
ferritic steel profile can be resulted in as well as ‘minor peaks’ belong to impurities formed in
the sample. These impurities can be identified as small amounts of Al2O3 54SiO2, Al4C3, SiC
and Cr23C6. Scanning transmission electron microscopy (STEM) combined with energy
dispersive X-ray spectroscopy (EDX) confirmed and revealed neutron identified phase distributions. Joint Committee on Powder Diffraction Standards (JCPDS) least square curves calibration can precisely calculate the dhkl parameters of each reflection plane. As a comparison,
another sample of alloy ingot was also investigated using neutron diffraction. The pattern was free from crystal impurities. Rietveld refinements provide satisfactory goodness of fits Rwp =
10.42% and reliability factor S = 1.7. This was so-called a ‘real bulky’ sample of a
73Fe24Cr2Si0.8Mn0.1Ni ferritic steel alloy.
Keywords: 73Fe24Cr2Si0.8Mn0.1Ni Steel; Crystal structure; Neutron diffraction;
Transmission electron microscope
1. INTRODUCTION
An advanced nuclear system (Generation IV) has initially defined six advanced reactor concepts with the ability to greatly improve nuclear reactor performance in terms of safety, proliferation resistance, economic performance, and minimization of waste (NEA, 2013). Several improved alloy compositions have been developed and are being continuously developed for both austenitic and Ferritic-Martensitic (F/M) steels. Due to generating high temperatures, the reactor system may yield very high energy and supply high-temperature heat potensially used for massive hydrogen production through a water decomposition process. Primary in-core structures are usually made of graphite and carbon-based ceramic composites, including the reactor pressure vessel (made of 2.25% Cr bainitic steel or 9% Cr martensitic steel) (Taban et al., 2012), cross vessel component, and intermediate heat exchangers that will divert heat from the primary side of the reactor to a hydrogen production plant. Such
components place great demands on their construction materials. Therefore, mechanical strength, creep resistance and corrosion resistance are required for an extended lifetime (approximately 20 years). Additionally, thin wall sheets are subjected to temperatures up to 850 to 950°C and must sustain a differential pressure of 6 to 7 MPa during off-normal operations. Such temperatures demand the use of Ni-base alloys rich in chromium (about 22 %wt.) and strengthened by additions of molybdenum, cobalt, and tungsten. Improving nickel based alloys in high- temperature strength alloys would be clearly beneficial, but they have been limited by the type of applications, optimum design, and quality of the minerals (NEA, 2013).
Table 1 Chemical composition of 73Fe24Cr2Si0.8Mn0.1Ni ferritic steel
Element Fe Ni Cr Mn Si Al Ti Sn Nb C S P V
%wt. 72.97 0.12 23.71 0.82 2.02 0.01 0.01 0.01 0.01 0.26 0.01 0.02 0.06
National Nuclear Energy Agency (BATAN)’s material engineers support the development of structural materials especially for reactor construction. A material with a significant local content has been synthesized, namely: the F1 type of alloy steel (Effendi et al., 2012). This alloy contains percentage weight of 73%Fe24%Cr2%Si 0.8%Mn0.1%Ni. Ferritic steel demonstrates the super alloy performance in hardness, corrosion resistance (Wahyono et al., 2015), and some mechanical properties. Laboratory-scale fabrication has been performed using casting methods (Kanthavela et al., 2014), to obtain a F1-ferritic alloy, a low carbon steel which is a non-standard chemical composition of elements, listed in Table 1 above. The purpose of synthesizing this ferritic steel is creating new ferritic types of materials with higher chromium
content and reduced nickel content, thus the materials’ corrosion resistance properties should be
significantly improved. The steel is assumed to be an improved version of T91 and T92 (David et al., 2013) and is expected to be a candidate for use in the structural material of nuclear reactors.
The main objective of this research is focused on investigating the material quality of 73Fe24Cr2Si0.8Mn0.1Ni alloy steel. The scope of the observations is focused on crystal and microstructure characterizations obtained High Resolution Powder Neutron Difractometer (HRPD) and Transmission Electron Microscope (TEM) analyses.
2. EXPERIMENTAL SETUP
First, the fractional quantities of each constituent component from the base materials were computed. Appropriate amounts of these base materials were weighed separately on the micro balance. The melting process used was similar to the A2 type steel casting technique explained in previous literature (Parikin et al., 2017). A mold made of silica-sand was constructed by mixing a bentonite binder with small amount of water. The finished mold was then lined with a specific material depending on the appropriate acid-, base-, or neutral environment. A neutral-type lining is a standard requirement if the desired product is stainless alloy. As a final step, the lining wall is sintered. Production of stainless steel requires a neutral environment, and this calls for an alumina (Al2O3) lining material used with a specific type of ramming binder. The
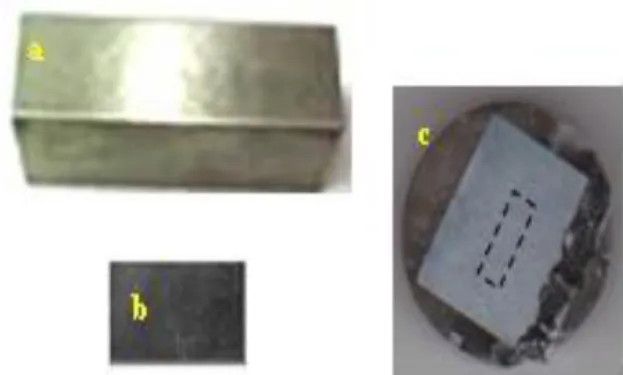
sample specially prepared by the spark erosion method to produce a dimension of 2.5×2.5×12 cm3.
Figure 1 Macrostructures of 73Fe24Cr2Si0.8Mn 0.1Ni steel specimen: (a) a 2.5×2.5×12 cm3 specimen; (b) a 3.0×2.0×1.0 mm3 specimen prior to polishing-thinning; and (c) mounting specimen with a
lamellae position to be dimple-grinded
For microstructures investigation, a standard procedure was followed. The characterization was accomplished by using a transmission electron microscope (TEM) and performed in Aachen Germany. The samples were prepared in five separate steps including using a Focused Ion Beam (FIB) (Dani et al., 2015) to form some small 15×0.1 m2 lamella specimens. The process
was comprised of pre-preparing of the specimen, bounding, mounting, mechanical pre-thinning and final ion beam thinning. Figure 1 presents the macrostructures of the specimen used in this work. Test materials are in the form of a base metal of ferritic steel F1 type with the specimen dimension of: (a) for OES tests and neutron diffraction experiments; and (b-c) for TEM observations. The specimen for TEM observations (Kim et al., 2012) was initially pre-prepared by slicing it into 3.0×2.0×1.0 mm3 pieces using a diamond wafering machine. The 15×0.1 m2
lamella square was thinned down to approximately <100 nm by an ion beam prior to being
inserted into the system’s sample vacuum chamber. Meanwhile, the crystal structure was
measured by collecting reflection intensities using a neutron diffractometer and refined by Rietveld method. High resolution powder diffractometer (HRPD-1.82 Å) utilizes neutrons as a source, has 32 high sensitive detectors that capable of simultaneously measuring the diffraction patterns of a compound. This device is an excellent non-destructive tool for characterizing the material's crystal structures since it utilizes neutrons that have higher penetrating power than X-rays. In most engineering materials, neutron diffraction is the preferred method for measuring bulk crystal structures. This allows the thermal neutrons beam scattered from the reactor to deeply analyze the structure of a thick material by a simple preparation. Therefore, a complete set of experimental data would be obtained by this method.
3. RESULTS AND DISCUSSION
3.1. Neutron Diffraction Profiles
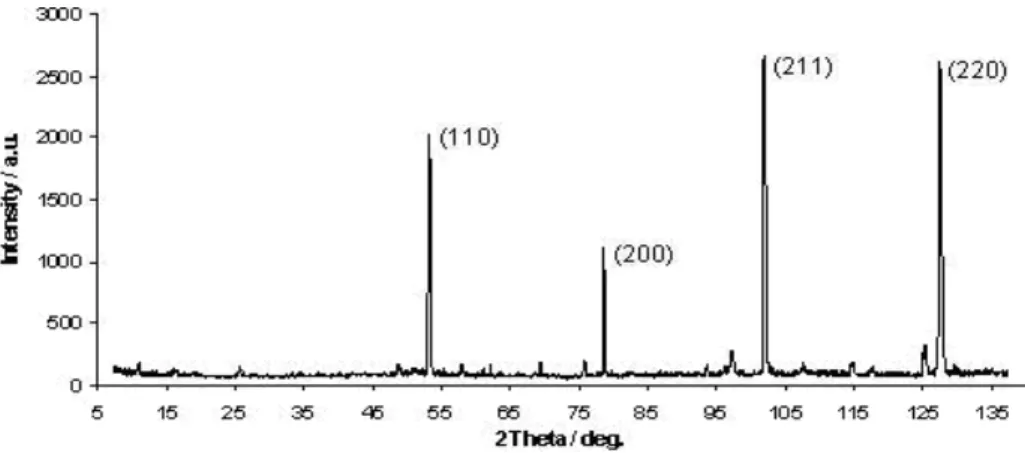
Figure 2 shows the neutron diffraction pattern using a wavelength of 1.82 Å. The measured experimental diffraction pattern of the steel specimen was of excellent or high quality. The peak to background ratio is adequate and one is still able to distinguish between real diffraction peaks and the chopped background. The entire diffraction pattern shows four dominant diffraction peaks, which is typical for a body-centered tetragonal (bct) crystal system (Woo et al., 2015). Successive peaks in the diffractogram in order of appearance are the (110), (200), (211) and (220) planes. These planes are numerically grouped by alternating between odd and even numbers, which are diffracted at consecutive 2-angle of 53.30, 78.74, 101.94
unidentified minor peaks which can inflate the background counts. Parts of these diffraction peaks were clearly scanned at 2 measurement angles ranging from 5 to 135. These unidentified peaks could originate from undesirable contaminants and are an obstacle to the refinement process. It was very difficult to achieve the convergence of accurate calculations in the refinements.
Neutron diffractogram data in Figure 2 must be corrected to improve the diffraction pattern.
Minor peaks in the diffraction pattern of the Rietan '94 program’s calculation were usually not taken into considerations (excluded) to obtain reference number values or goodness of fit (Rwp; S). Otherwise, unidentified peaks may be predicted via the Bragg formula to obtain the
dhkl of -crystal elements or compounds in the material. First, the calibration equations have to be
manually formed by correlating the 2 sin / and 1/dhkl, from the crystallographic data to find a
line equation using the least square method.
The equation was then utilized to calculate the dhkl of a certain peak belonging to the crystal
elements or compounds. Secondly, software packages or codes are used to perform the ‘search
and match’ process to estimate the yet unidentified reflection peaks of crystal elements or
compounds present in the diffraction pattern.
Figure 2 A Neutron diffraction profiles of 73Fe24Cr2Si 0.8Mn0.1Ni ferritic steel specimen from a High Resolution Powder Diffractometer (HRPD-1.82Å)
Table 2 Crystal structure parameters of 73Fe24Cr2Si 0.8Mn0.1Ni ferritic steel Crystallography of F1-Type Steel
Formula : Fe
Space Group : I4/mmm (I-139)
Lattice Parameters: a (Å) : 2.866 b (Å) : 2.866 c (Å) : 2.874
,, (deg.) : 90,90,90
Volume Cell (Å3) : 23.607
Number of Atoms/unit cell, Z : 2
Atomic Positions x, y z : 0.0 0.0 0.0
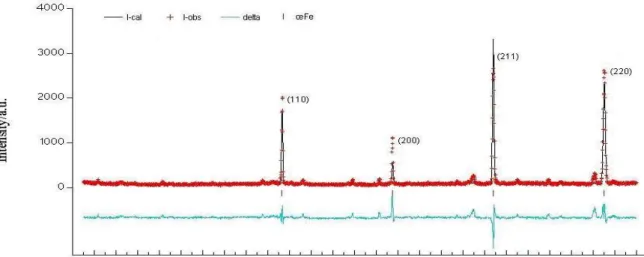
standard pattern. In Rietveld refinement, least squares is performed until convergence is achieved (best fitting) between all the observed diffraction patterns and the entire pattern of the intensity calculation. This calculation is based on the simultaneous smoothing models and other characteristics such as lattice parameters, the effect of optical diffraction, and factor modeling the desired appropriate instrument. Key to the solution is the feedback for smoothing, between a working knowledge of the structure and allocation of the Bragg reflection intensity observations of individual mutually overlapping portions (Parikin et al., 2013). Figure 3 displays the pattern for a single-phase Rietveld refinement of the steel specimen. In the diagram, there are signs of line broadening such some vertical lines under standard patterns and models. The lines indicate the position of the phase in steel specimens of 73Fe24Cr2Si0.8Mn0.1Ni. A full pattern of a standard profile and refinement is successively displayed in the diagram.
Smoothing results clearly show the crystalline symmetry belongs to the body centered tetragonal (bct) crystal system. In the diagram the reflection planes of (110), (200), (211), and (220) are patterned by mixing even and odd numbers. There is evidence of other phases (small peaks) in the range of the specimen’s diffraction patterns. It can be assumed for the entire diffraction zone that the crystal consists of a mixture of the total pattern of a body-centered tetragonal and some small peaks of impurities. Refinement was performed using single-phase models, namely the ferritic phase (Fe) with space group I4/mmm (I-139) which is given in Table 2.
Figure 3 Rietveld refinement pattern of 73Fe24Cr2Si 0.8Mn0.1Ni ferritic steel specimen from HRPD-1.82 Å
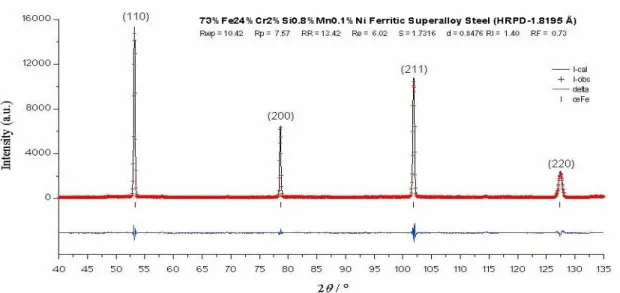
Figure 4 Rietveld refinement pattern of “real bulky” 73Fe 24Cr2Si0.8Mn0.1Ni ferritic steel
specimen from high resolution powder diffractometer HRPD-1.82 Å
In comparison with the results of other neutron diffraction measurements of mechanically ‘real bulky’ specimens of 73Fe24Cr2Si0.8Mn0.1Ni ferritic steel, it is shown in Figure 4 that the
overall reflection profile was free from impurities. Rietveld refinements (Pereira et al., 2015; Frølich et al., 2016; Bella & Henderson, 2016) give a quite satisfactory goodness of fits factor, reaching the weighted-profile R-factor Rwp value of 10.42% and reliability factor S of 1.7. The
Residual profile seems to be a straight-line with a minuscule ripple at each peak position.
Figure 5 Least square curves calibration for identification of Al2O354SiO2, Al4C3, Cr23C6 and SiC in a 73Fe24Cr2Si 0.8Mn0.1Ni ferritic steel specimen
3.2. Least Square Approximations
In addition to the principal peaks belonging to the bct structure of the 73Fe24Cr2Si0.8Mn0.1Ni
ferritic super alloy steel, there are some unknown or unidentifiable peaks in the diffraction pattern. Based on the results of Rietveld refinements, the goodness of fit (Rwp;S) factor is not
A simple calculation of dhkl was performed by applying the Bragg formula (Humphreys, 2013) = 2dhkl sin by correlating (1/dhkl) with (2sin/) in the least square method. In the beginning,
verification or confirmation of the crystallographic data, 2 and dhkl of Al2O3.54 SiO2 (44-
0003), Al4C3 (35-0799), Cr23C6 (35-0783) and SiC (42-1360) -were taken from JCPDS database
(JCPDS, 2014) to find the liniear equation of x = (2sin/) versus y = (1/dhkl). Then, equations
were utilized to compute the d-spacing of the obtained 2 peaks. It was found that correlations
of the linear equations are strong enough, resulting in a χ-square (R2) close to unity (~1). Furthermore, the identified minor peaks belong to aluminum silicate (Al2O3.54SiO2) with an
orthorhombic structure, space group Pnma (I-62), and lattice parameter a = 20.10 Å, b = 19.89 Å and c = 13.39 Å, then aluminum carbide (Al4C3) with fcc structure, space group Fm3m
(I-225), lattice parameter of a = b = c = 10.65 Å, also silicon carbide (SiC) with tetragonal structure, space group P63mc (I-186), lattice parameter a = b = 3.08 Å and c = 10.06 Å and
chromium carbide (Cr23C6) with bct structure, space group RǮm (I-225), lattice parameter of a
= b = 3.338 Å and c = 24.99 Å as graphically in Figure 4. The d-spacing of crystals was evaluated via the least squares method by obtaining the linear equations of y(Al2O3.54 SiO2) =
1.0037x-0.002, then y(Al4C3) = 0.9997x- 0.00002, y(Cr23C6) = 0.9997x–0.00003 and y(SiC) =
1.0006x-0.00008 respectively.
A few obtained d-spacings tend to overlap with one another to make a straight-line; starting
from aluminum silicate, aluminum carbide, chromium carbide and finally silicon carbide (see Figure 5). Table 3 lists some d-spacings of the small or weak peaks conforming with the JCPDS
data.
Table 3 Some d-spacing of the minor peaks conforming with the JCPDS database
Formula () Plane Intensity Relative d-spacing (Å)
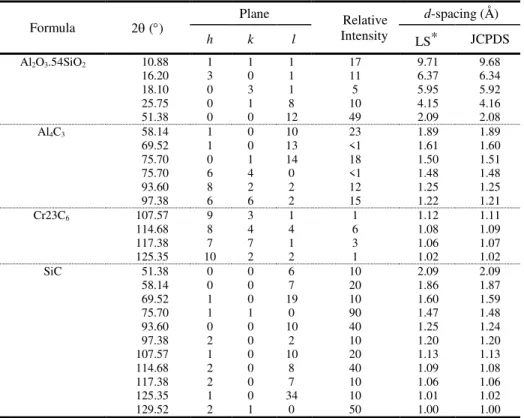
concentrated on which the lamellae will be taken into the FIB system (Burnett et al., 2016). It can be seen as a rectangle in Figure 6a. It is observed that much coagulation in the steel materials is exposed. The solid solution process was not perfect enough. Pores and cracks are distributed across the whole surface. Some parts of the surface might not be heated or cooled uniformly during the fabrication process. Non-metallic elements contribute to pores and cracks formation in the surfaces. It is found that silicates and carbides such as: aluminum silicate, aluminum carbide, and chromium carbide are present in the investigated areas. It is very clear that the microstructure exhibits coagulated grains caused by different rates of rapid cooling during fabrication.
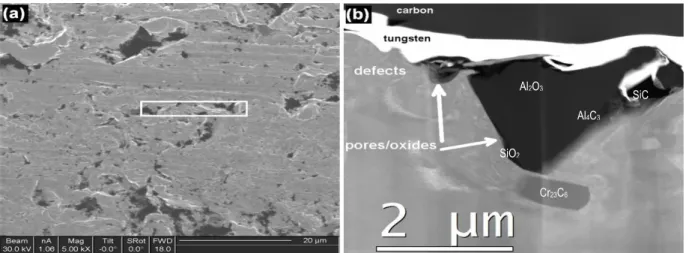
Previous reports (Effendi et al., 2012; Effendi et al., 2014) revealed the outer density of the
material is lower than the inner density due to pores and cracks forming in the material’s
surface (see Figure 6b). For this reason, mechanical treatments must be carried out until about 3.5 m in depth is reached by machining process to find the compact surface of the ‘real bulky’
steel. Figure 6b shows a TEM image of about a 3.5m cross section depth (transversal direction) from the surface of the 73Fe24Cr2Si0.8Mn0.1Ni ferritic super alloy steel. The image delineates pore thickness until about 3 m in depth close to the real surface of the steel. The density of materials clearly traced from upper to beyond the real surface via grey color degradation. It should be understood that silicate has amorphous structures. So, aluminum silicate and silicon carbide have no dense structures compared to aluminum carbide and chromium carbide. Their mass densities are lighter than that of iron-carbon (Fe-C). They tend to move to the upper layers, occupying the outer surface. It was observed that these compounds are partly found on the top of surfaces.
Figure 6 (a) FIB-SEI on surface of 73Fe24Cr2Si0.8Mn0.1Ni steel; (b) TEM image on depth of surface 3.5 m of 73Fe24Cr2Si0.8Mn0.1 Ni steel
Aluminum and oxygen were covering the pores of samples, forming the delta () structures with silicon and carbon in the pore surface. Meanwhile, silicon, carbon, and oxygen content beyond the pore surface are overlap high enough with silicon artifact signals caused by tungsten and carbon protective layers, respectively. Generally, corrosive atmospheres and high
temperature environments may attack the material’s surface. The presence of these elements
may be risky due to interacting with others by forming oxides, thus causing corrosion. Weakened material usually starts from this side due to the presence of micro-crystal stresses (Parikin et al., 2013). It might further initiate intergranular cracks and be able to migrate slowly and rapidly among the grain boundaries. However, it is clearly seen in Figure 5a that pores and cracks are widely spread on the entire area of the sample surface. It may be reasonably presumed that the solid solution cooling process of the molten metal occurs very fast. It creates
Al2O3
SiC
Al4C3
SiO2
many air bubbles which are trapped in almost the entire range of the surface. This may increase the values of micro-crystal stress in the material.
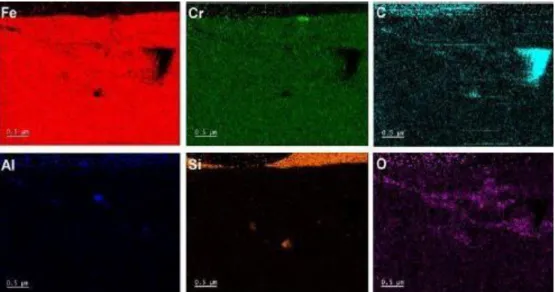
3.4. EDX Mapping
Processing the TEM image capture was carried out by using a secondary electron detector (SEI) on the acceleration energy of the primary electron beam source emerged from tungsten wire by a maximum of 200 keV while the working distance (WD) was kept constant at 100 nm. The WD value is setup to obtain the EDX spectrum in the best condition. EDX was taken on the dead time value on average between 20 and 40% (Dani et al., 2015). The EDX spectrum of the specimen taken around the Fe-C stripe surface is shown in Figure 6. The spectra concentrated on the area of the specimen wherever there are pores/semi-pores and cracks. Higher magnifications of one pore area strip on Fe-C maps are artifacts from the EDX system. It was observed in the pores/semi- pores and in the cracks containing high carbon and oxygen. High oxygen concentrations and some amount of alumina are found in the pores. Pore areas at the lower part of the lamella (3 μm below the surface) are surrounded by chromium. Moreover, strong diffractions contrasted on the STEM-EDX image showed defects and dislocations (Harjo et al., 2016) were formed only up to 3 µm below to the surface.
Figure 7 EDX maps on 0.5 m surface depth of 73Fe24Cr2Si0.8Mn0.1Ni ferritic steel specimen
EDX semi quantitative maps show the concentration of each identified elements (in percentage weight). The percentage of carbon content detected in the surface specimen ranges from about 55 % to 64 % (Dani et al., 2017). This finding seems to conform with the microgram shown in Figure 7. The carbon element is distributed from outer to inner surface. So, it seems the carbon elements migrate via grain boundaries from the inner to outer surface, accumulating at pores and cracks. Fe and Cr elements tend to have a constant mass fraction. However, there was an interesting phenomenon of Si, C, and Al elements emerging from the surface metal areas in the form of aluminum silicate, aluminum carbide, silicon carbide, and chromium carbide
compounds. The additional fraction of these elements may be the coagulation of ‘migrant’
elements, diffusing into a certain enriched site while other locations remain deficient of these specific elements. The presence of aluminum silicate in the sample, may be explained as alumina (Al2O3) and silicon (Si) leftover which are used in the sample preparation.
4. CONCLUSION
In summary, there are some ‘impurity’ compounds, as evidenced by the unidentified reflections
to the ferritic steel profile, some minor peaks which belong to impurities formed in the sample. These impurities can be identified as a small amount of Al2O3 54SiO2, Al4C3, SiC, and Cr23C6.
Scanning transmission electron microscopy (STEM) combined with energy dispersive X-ray spectroscopy (EDX) analyses confirmed and revealed the neutron identified phase distributions. JCPDS least square curves calibration can precisely calculate the dhkl parameters of each reflection plane of impurities. As a comparison, another specimen taken from the middle of an alloy-ingot was also investigated by neutron diffraction. The pattern was free from crystal impurities. Rietveld refinements give a satisfactory goodness of fit Rwp= 10.42% and reliability factor S = 1.7. This was then called a ‘real bulky’ sample of 73Fe24Cr2Si0.8Mn0.1Ni ferritic
steel alloy.
5. ACKNOWLEDGEMENT
The writers would like to express thanks to the Head of PSTBM and BSBM, Dr. Arbi Dimyati, Dr. Andon Insani, Drs. Agus Hadi Ismoyo, Mr. Imam Wahyono, Mr. Rohmad Salam and Mr. Heri Mugihardjo for their kindness and help. Also, the writers thank to GFE-RWTH Aachen in Germany, and the financial support of DIPA 2015. Beam Microscopy. Ultramicroscopy, Volume 161, pp. 119–129
Dani, M., Parikin, Iskandar, R., Dimyati, A., 2017. Investigation on Precipitations and Defects of the Fe-24Cr-2Si-0.8Mn Ferritic Super Alloy Steel. Indonesian Materials Science Journals (Jurnal Sains Materi Indonesia), Volume 18(4), pp. 173–178
Dani, M., Untoro P., Putra T.Y.S.P., Parikin, Mayer, J., Dimyati, A., 2015. Transmission Electron Microscopy Characterization of High-temperature Oxidation of Fe-20Cr-5Al Alloy Prepared by Focused Ion Beam Technique. Makara Journal of Technology, Volume
19(2), pp. 85–89
David, S.A. , Siefert, J.A., Feng, Z., 2013. Welding and Weldability of Candidate Ferritic Alloys for Future Advanced Ultra Supercritical Fossil Power Plants. Science and Technology of Welding and Joining, Volume 18(8), pp. 631–651
Effendi, N., Darwinto, T., Ismoyo, A.H., Parikin, 2014. 24-Chromium Ferritic Steel Magnetic Properties. Indonesian Materials Science Journals (Jurnal Sains Materi Indonesia), Volume
15(4), pp. 187–191
Effendi, N., Jahja, A.K., Bandriana, Adi, W.A., 2012. Some Data of Second Sequence non Standard Austentic Ingot A2. Urania, Scientific Journal of Nuclear Fuel Cycle, Volume
18(1), pp. 48–58
Frølich, S., Leemreize, H., Jakus, A., Xiao, X., Shah, R., Birkedal, H., Almer, J.D., Stock, S. R., 2016. Diffraction Tomography and Rietveld Refinement of a Hydroxyapatite Bone Phantom. Journal of Applied Crystallography, Volume 49(1), pp. 103–109
Harjo, S., Kawasaki, T., Gong, W., Aizawa, K., 2016. Dislocation Characteristics in Lath Martensitic Steel by Neutron Diffraction. Journal of Physics: Conference Series Volume
746, pp. 1–7
Humphreys, C.J., 2013. The Significance of Bragg’s Law in Electron Diffraction and
JCPDS (Joint Committee on Powder Diffraction Standards), 2014. International Centre for Diffraction Data, PCPDFWIN, PDF-2 Powder Diffraction File, Release 2014. Cambridge
University Press, USA
Kanthavela, K., Arunkumar, K., Vivek, S., 2014. Investigation of Chill Performance in Steel Casting Process using Response Surface Methodology. Procedia Engineering, Volume 97,
pp. 329–337
Kim, H.J., Choi, S.H., Bae, H.B., Lee, T.W., 2012. Transmission Electron Microscopy (TEM) Sample Preparation of Si1–xGex in c-Plane Sapphire Substrate. NASA STI Program, pp.1–
29
Kumar, V., Kumari, S., Kumar, P., Kar, M., Kumar, L., 2015. Structural Analysis by Rietveld Method and its Correlation with Optical Propertis of Nanocrystalline Zinc Oxide, Advanced. Materials Letters, Volume 6(2), pp. 139–147
NEA (Nuclear Energy Agency), 2013. Status Report on Structural Materials for Advanced Nuclear Systems, Nuclear Energy Agency Organisation for Economic Co-operation and Development. Available online at
http://www.oecd-nea.org/science/pubs/2013/6409-sr-mans.pdf, Accessed on October 27, 2017
Parikin, Bandriyana, Wahyono, I., Ismoyo, A.H., 2013. Non-destructive Residual Stress Analysis around the Weld-joint of Fuel Cladding Materials of ZrNbMoGe Alloys. Atom Indonesia Journals, Volume 39(2), pp. 65–74
Parikin, Ismoyo, A.H., Dimyati, A., 2017. Residual Stress Measurements on the TIG Weld Joint of 57Fe15Cr25Ni Austenitic Steel for Structural Material Applications by Means X- Ray Diffraction Techniques. Makara Journal of Technology, Volume 21(2), pp. 49–57
Parikin, Killen, P., Rafterry, A., 2009. Measurements of Residual Stresses in Cold-Rolled 304 Stainless Steel Plates using X-ray Diffraction with Rietveld Refinement Method. Atom Indonesia Journals, Volume 35(1), pp. 19–36
Pereira, P.F.S., Nogueira, I.C., Longo, E., Nassar, E.J., Rosa, I.L.V., Cavalcante, L.S., 2015. Rietveld Refinement and Optical Properties of SrWO4:Eu3+ Powders Prepared by the Non- hydrolitic Sol-Gel Method. Journal of Rare Earths, Volume 33(2), pp. 113–128
Taban, E., Kaluc, E., Atici, T., Kaplan, E., 2012. 9-12% Cr Steels: Properties and Weldability Aspects, the Situation in Turkish Industry. In: Proceeding of the 2nd International
Conference on WeldingTechnologies and Exhibition. Ankara-Turkey, pp. 203–212
Wahyono, I., Salam, R., Parikin, Dimyati, A., 2015. Characterisation of Microstructures By using SEM and XRD on Corrosion Resistant of SS430 Commercial Steel and F1 non Commercial Steel. In: Prosiding Seminar Nasional XI SDM Teknologi Nuklir (Indonesian
National Seminar XI SDM Nuclear Technology), pp.112–117
Woo, W., Huang, E.W., Yeh, J.W., Choo, H., Lee, C., Tu, S.Y., 2015. In-situ Neutron
Diffraction Studies on High-temperature Deformation Behavior in a CoCrFeMnNi High