Analysis Expenditure Household For Comercial Energy In Palembang
Liliana Taufiq Marwa
(Lecturer Economic Faculty of Siwijaya University )
Abstract
This research is aimed to analyze the compotition of household expenditure for comersial energy (oil, LPG, and natural resources, (2) economic aspect of convertion LPG to Natural Gas. The result of this analayis is hoped to help the govenment in policy making especially about stock and energy distribution for household sector in Palembang. The result is that the willingness to pay of household sector for energy (fluid natural gas) in Palembang is between Rp 1.000.000 up to Rp 1.500.000 for installment cost and Rp 50.000 up to Rp 100.000 for monthly payment.
Keywords:
Energy consumpstion,Household Sector, Energy conversy, Willingness to pay
I. INTRODUCTION
Conceptually, household expenditure for consumption can be divided into food consumption expenditure and non-food consumption expenditure, also can be divided into basic needs expenditure and support needs expenditure. Energy needs nowadays relatively not be able to become support needs only, because some human activities will lose without energy. It can be imagined how household can work without energy (firewood, gas, and LPG) for cooking some foods in example, or to energize the electricity. So, the needs of energy have already become basic needs, nonetheless a household has to try hard to fulfill it in order to get a better and normal life.
to get it is suitable with people’s purchasing power, so then accessibility to the energy source can be exist. In case for people to be able to access energy, its availability and distribution also price should get an extra attention from government, in example government look after the availability and price of other basic need like rice.
By the time of population become larger and also economy activity, so it is an unsophisticated condition if growth happen pretty substantial for final energy demand (including biomass) in Indonesia within 1990-2005, that is consumption averagely grew for 4.08% per year (Nurhayati, 2007)
So far, government has tried the best for people (especially poor people) to be able to have an access to energy source. Some of the efforts are giving subsidy to certain kinds of energy so then it wishes they can enjoy the energy with their power of purchasing capability. Even though the subsidy policy has been given by the government, there is still a lack for people access to energy source between income categories (rich and poor) and also between regions as an impact of inequality of income distribution.
This research tries to reveal problems of differences of household capability in accessing/consuming energy with household pattern approach in energy consumption (kerosene, LPG, and natural gas). Moreover, there will an economic accession reveal (positively and negatively) about conversion program from LPG to natural gas in Kelurahan Lorok Pakjo Kecamatn Ilir Barat I.
Research about expenditure for household energy consumption in the City of Palembang purposed to identify issues such as:
•Composition of household expenditure for commercial energy (kerosene, LPG, natural gas) based on household income categories.
•Economic analysis of LPG to natural gas conversion.
handling policies especially in the City of Palembang in order to derive the policy of provision and energy distribution for household sector.
•It also hopes that this research can give a result of household power of purchasing to energy, so it can become information in case of making policy of energy subsidy.
II. LITERATURE REVIEW
Consumers demand for something can be divided into personal demand and market demand. Personal demand for something can be defined as total of goods which consumer wants and wills to buy it for many things, and assume other factors that influence the demand is constant (Tomek and Robinson, 1981; 26 in Taufiq, 2001).
behavior and can be downgraded from maximum satisfaction analysis with budget burden.
Amount of consumers’ demand to certain commodity generally depends on its price, other commodities price, level of income and its distribution, total of household, and age arrangement. Changing in related goods price can cause changing in total of quantity demanded (shifting in demand curve), otherwise changing in other variable besides price will can cause shifting in demand (shifting from demand curve to another curve).
Household expenditure for energy consumption is highly depending on household income. Group of household which has lower earning will tend to consume non commercial energy (like firewood) especially in countryside area because of stock availability. Also, economic price almost not available in order to get firewood in countryside also has an interest itself, while group of household in high income level tend to dominated in consuming commercial energy (Nuryanti, 2007)
III. RESEARCH METHODOLOGY
3.1 Research Scope
Research scope for this study emphasis on identifying household expenditure pattern for energy consumption based on its type and economic conversion analysis between types of energy, like conversion from LPG to natural gas.
3.2 Data type and resource
Type of data that used in this study is primary data and secondary data. Primary data will be collected through field survey, while secondary data obtain from certain legal reports which published by related Department or Institution. In revealing energy consumption pattern phenomena and also revealing problem of LPG to natural gas converted, region which chosen is Kecamatan Ilir Barat I, since in this Kecamatan some of household in this Kelurahan has already been used natural gas.
The respondent is household in the City of Palembang. Since then, primary data which needed is data of household whom live in the City of Palembang. Sample voting done by Non-probability sampling, where in this sample taking done with Purposive Sampling which taking some sample group from population done based on certain consideration. From the calculation based on deviation value it is obtain as 60 number of sample, and hope this can represented the overall population. Sample voting also do based on time, cost, and force efficiency in order to get to the region which became the sample.
3.4 Data Collecting Procedure
Primary data collected by survey method and profound interview method with questioner. The using of both methods purposed to get an accurate data from respondents about energy with its relation in perception.
In collecting the primary data, it also done by field observation in order to get additional information from opinions of decision makers and executives who passed the competencies and as complementary information to support this research. While the secondary data collected through library research from certain publication from Central Bureau Statistic in Palembang and related institution.
IV. DISCUSSION
The respondent characteristics in this research are women in total of 42 people or 70 percent of the total population and for men only 18 people or around 30 percent.
Respondent majority job is as PNS/BUMN/Police/Retired with number of percentage for 40 percent, while in each of 21.7 percent work as entrepreneur and employee, but only 9 percent as housewives.
Most of respondents already have their own house in frequency of 56 people (93 percent), while respondent who still stay in agency and rent house each takes 2 respondent only (3.3 percent).
Group of expenditure divide into 5 groups. For expense under Rp1.000.000 takes 6 respondents (10 percent); Rp 1.000.000- Rp 5.000.000 takes 39 respondents (65 percent); Rp 5.000.000-Rp 9.000.000 takes 10 respondents (16.7 percent); and Rp 9.000.000- Rp 13.000.000 takes 4 respondents (6.7 percent), while expense on more Rp 13.000.000 only takes 1 person only (1.7 percent).
Respondent majority job is as PNS/BUMN/Police/Retired with number of percentage for 40 percent, while in each of 21.7 percent work as entrepreneur and employee, but only 9 percent as housewives. Most of respondents already have their own house in frequency of 56 respondents (93 percent), while respondent who still stay in agency and rent house each takes 2 respondents only (3.3 percent).
Group of respondent expenditure divide into 7 groups. For expense from Rp 2.000.000 up to Rp 3.000.000 takes 43 respondents (71,7 percent), and the rest of respondents have variation between Rp 1.000.000 up to more Rp 15.000.000.
According to Indonesian Energy Outlook 2014, there is an increase in Indonesia’s consumption of final energy (including biomass) from 764 million SMP in 2000 to 1.079 million in 2012, with average of 2.91% increased per year. In 2012, the biggest target market of final energy is industrial sector (34.8%) followed by household sector (30.7%), transportation sector (28.8%), commercial sector (3.3%) and others (2.4%).
package and electricity for limited consumers. Due to high subsidy for fuel energy, therefore, conversion is conducted to supply household needs in terms of karoses to LPG and natural gas.
Table 4.1. Using Energy
Frequency Percent Valid Percent Cumulative
Percent
Valid
LPGi 12 kg 16 26.7 26.7 26.7
LPG 3 kg 31 51.7 51.7 78.3
Natural Gas 10 16.7 16.7 95.0
Combination 3 kg & 12 kg 3 5.0 5.0 100.0
Total 60 100.0 100.0
Using LPG12 Kg takes 16 respondent (26. 7 percent), LPG 3 kg takes 31 respondent (51.7 percent), natural Gas takes 10 respondent (16.7 percent) and for combine between LPG 3kg and 12 kg takes 3 respondent (5 percent). The number of respondents who use LPG 3 kg is relatively high because it can be accessed easily and purchased at stalls, small shops, mini market, and gas sales agent.
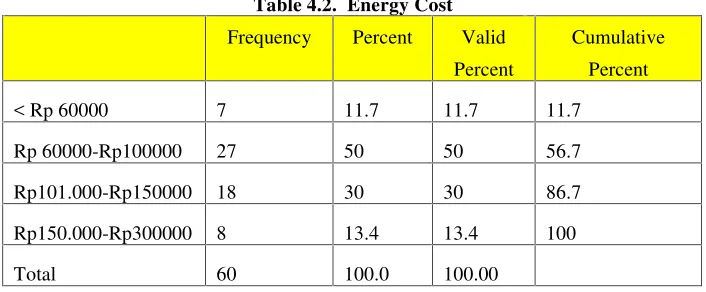
Table 4.2. Energy Cost
Frequency Percent Valid
Percent
Cumulative
Percent
< Rp 60000 7 11.7 11.7 11.7
Rp 60000-Rp100000 27 50 50 56.7
Rp101.000-Rp150000 18 30 30 86.7
Rp150.000-Rp300000 8 13.4 13.4 100
Total 60 100.0 100.00
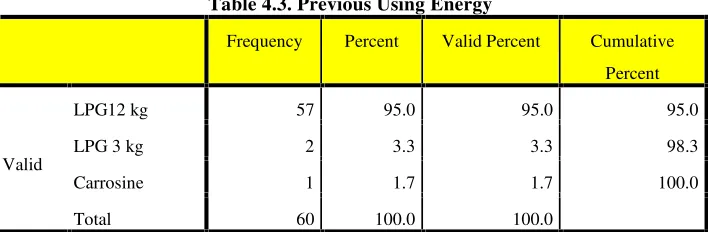
Table 4.3. Previous Using Energy
If we take a look at the energy used that purpose previously, can be seen if before used certain energy, respondent use another energy for daily life. It can be obtained from dominated using of energy that use by respondent before is 12 kg LPG as 57 respondent (95 percent). The low kerosene consumption is related to the scarce presence of kerosene increasingly high price of the product. Therefore, it can be seen that the use of LPG 12 kg is still dominating in energy utilization for the respondents.
It can be seen form the acceptance rate of respondents in households energy utilization that there are many households with income above Rp. 4.500.000 are still using LPG 3kg (25%).
Table 4.4.Crosstab Between Income and Using of Energy
The use of LPG 3kg is still dominating households with low, middle and high income because of its easy accessibility. Respondents can buy LPG 3 kg from small shops, minimarker as well as LPG agents.
This indicates that the energy expenditure of households, for example gas for high-income households is small with only a portion of total household expenditure. As for low-income households portions, it is considerably high compared to the total expenditure of the households. Monthly ratio of total expense to expense for energy is 3.53% with maximum and minimum ratio of 17.7% and 0.66% respectively.
Ratio between total expenditure that spend by respondents to expenditure for energy in each month from data processing result obtained average ratio as 3.53 percent with maximum ratio of 17.7 percent and minimum ratio 0.66 percent.
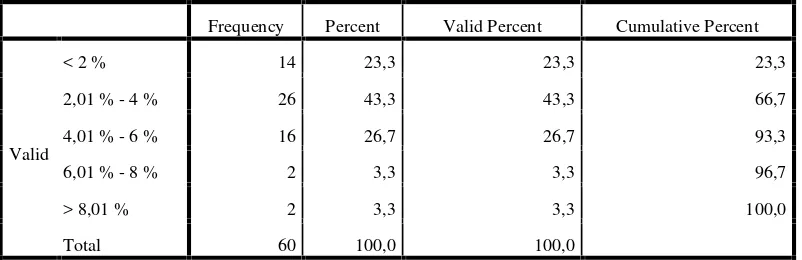
Tabel 4.5. Rasio Total Expenditure to Household Energy Expenditure Respondent
Frequency Percent Valid Percent Cumulative Percent
Valid
< 2 % 14 23,3 23,3 23,3
2,01 % - 4 % 26 43,3 43,3 66,7
4,01 % - 6 % 16 26,7 26,7 93,3
6,01 % - 8 % 2 3,3 3,3 96,7
> 8,01 % 2 3,3 3,3 100,0
Total 60 100,0 100,0
From the table above, it can be seen that ratio between total household expenditure to energy consumption expenditure under 6 per cent as 50 respondent (93.3 percent).
electronic media (television and radio), counseling, other people’s preferences and personal experience.
If it viewed from 60 respondents that being researched, can be seen that 96.3 percent (59 respondents) answer they do know subsidy existence that been given by government for energy use, and the rest answer they do not know.
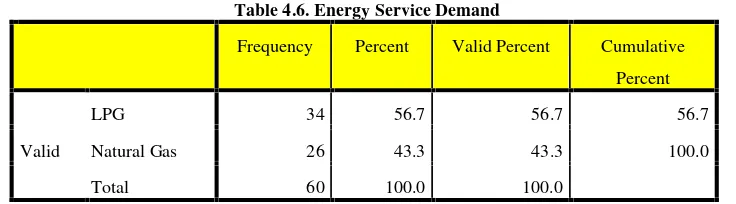
Table 4.6. Energy Service Demand
Frequency Percent Valid Percent Cumulative
Percent
Valid
LPG 34 56.7 56.7 56.7
Natural Gas 26 43.3 43.3 100.0
Total 60 100.0 100.0
From total of 60 respondents, it can be seen that the energy service that demand by respondent is LPG energy service as 34 respondents (56.7 percent), and the rest natural gas energy service as 26 respondents (43.3 percent).
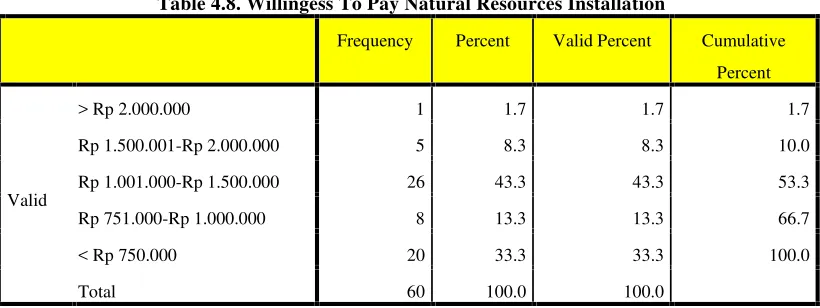
The existence of service for natural consumption requires respondents to meet the conditions given by PGN (State Gas Company) to be able to receive the installation facility. From the total 0f 60 respondents, it can be seen that all respondents are willing to meet the conditions.
Palembang has installed and distributed natural gas to households through PGN since 2000. In its development, as of 2015, 5079 households have been installed this facility. In 2016, PGN targets to add 4000 new consumers. So far, the distribution of natural gas has only focused on Ilir Barat 1 district (Kelurahan Siring Agung and Lorok Pakjo).
Table 4.7.Customer Propose
Customer propose for natural gas installation from 60 respondents e can be seen from ever proposed or never proposed natural gas installation as well as the unknown about natural gas. From 60 respondents, 12 people or 20 percent answered ever proposed natural gas installation, 40 respondents (66.7 percent) answered never proposed natural gas installation, and the rest of 8 respondents (13.3 percent) answered the unknown of natural gas installation.
Table 4.8. Willingess To Pay Natural Resources Installation
Frequency Percent Valid Percent Cumulative
Percent
Valid
> Rp 2.000.000 1 1.7 1.7 1.7
Rp 1.500.001-Rp 2.000.000 5 8.3 8.3 10.0
Rp 1.001.000-Rp 1.500.000 26 43.3 43.3 53.3
Rp 751.000-Rp 1.000.000 8 13.3 13.3 66.7
< Rp 750.000 20 33.3 33.3 100.0
Total 60 100.0 100.0
Furthermore, the low socialisation of the program is also causing the preception of natural gas.
Table 4.9.Willingess To Pay Natural Gas every Month
Frequency Percent Valid Percent Cumulative
Percent
Valid
> Rp 150.000 1 1.7 1.7 1.7
Rp 100.000-Rp 150.000 13 21.7 21.7 23.3
Rp 51.000-Rp100.000 31 51.7 51.7 75.0
< Rp 50.000 15 25.0 25.0 100.0
Total 60 100.0 100.0
the capability for paying natural gas, so then can be seen that the frequencies of payment more than Rp 150.000 as 1 respondent (1.7 percent), Rp 100.000-Rp 150.000 as 13 respondents (21.7 percent), Rp 51.000-Rp 100.000 as 31 respondents (31 percent), and the rest under Rp 50.000 as 15 respondents (25 percent). The perception of natural gas will affect attitude and accepteance of respondents. Respondent’s perception is adequate since natural gas has products characteristics that respondents want.
If take look from the questioner collection which have been spread for 60 respondents, we can see some of benefit according to 60 respondents about natural gas utilization.
Utilizing of natural resources 2 3.3 3.3 95.0
Suitable to needs 2 3.3 3.3 98.3
Dont know 1 1.7 1.7 100.0
Here is some natural gas utilization according to 60 respondents, 34 respondents (56.7 percent) answer more efficient/practical, 16 respondents (26.7 per cent) answer cheap/save, 5 respondents (8.3 percent) answer easy to get/swift distribution, 2 respondents (3.3 percent) answer utilize natural gas and suitable to needs and the rest 1 respondent (1.7 percent) answer do not know.
V. CONCLUSION AND RECOMMENDATIONS
5.1. Conclusion
a. Energy utilization that used by the respondent is 3 kg LPG with 31 respondents (51.7 percent), natural gas utilization with 10 respondents (16.7 percent), and combination utilization between 3 kg and 12 kg LPG as 3 respondents (5 percent).
b. 96.3 percent of respondents answer knows about the subsidy given by government for energy utilization.
c. Energy service that being stake by respondent is LPG energy service as 56.7 percent, and the rest of natural gas energy service as 43.3 percent. d. The bid requirement available by PGN and natural gas installation that
offer to respondents paid Rp 1.001.000-Rp 1.500.000 as 26 respondents (43.3 percent), Rp 751.000-Rp 1.000.000 as 8 respondents (13.3 percent), and the rest under Rp 750.000 as 20 respondents (33.3percent).
e. The capability for paying natural gas, so then can be seen that the frequencies of payment for each month for natural gas, so then the frequencies Rp 100.000-Rp 150.000 as 13 respondents (21.7 percent), Rp 51.000-Rp 100.000 as 31 respondents (31 percent), and the rest under Rp 50.000 as 15 respondents (25 percent)
5.2. Recommendations
b. It is need an expansion for natural gas pipe installation that capable and wills to pay, so then the people accessibility to cheap an efficient energy, and swift distribution increase.
REFERENCE
Agus Syarif Hidayat, 2005. “Konsumsi BBM dan Peluang Pengembangan Energi Alternatif”.Jurnal Inovasi Vol. 5/XVII/Nov, 2005.
BPS, Palembang dalam Angka, beberapa tahun penerbitan.
Faisal Jamil, Eatzaz Ahmad, 2010. “The relationship between electricity consumption, electricity prices and GDP in Pakistan”. Energi Policy. Kidlington: Oct 2010. Vol. 38, Edisi 10; pg. 6016
Agus Syarif Hidayat, 2005. “Konsumsi BBM dan Peluang Pengembangan Energi Alternatif”.Jurnal Inovasi Vol. 5/XVII/Nov, 2005.
Hakim, Abdul, 2004,Ekonomi Pembangunan,EKONOSIA, FE UII, Yogyakarta. Insukrindo,1994. “Kemiskinan dan Distribusi Pendapatan di Daerah Istimewa
Yogyakarta 1984–1987”, Jurnal, FE UGM, Yogyakarta.
James E. Payne, 210. “Survey of the international evidence on the causal relationship between energi consumption and growth”.Journal of Economic Studies Vol. 37 No. 1, 2010
Jinghan,M.L., 2000. Ekonomi Pembangunan dan Perencanaan. Penerbit Pajar Interpratama, Jakarta
Kathryn Tippey, Randy Beavers, 2010. “Monitoring Climate Variability’s Impact on Residential Energi Consumption in the United States: Approach to the Disaggregation of Heating Fuel Consumpt”, Journal of Applied Business and Economics vol. 11(4) 2010
Kuncoro, Mudrajat, 2004, Otonomi dan Pembangunan Daerah, (Reformasi, Perencanaan, Strategi dan Peluang), PT, Erlangga, Jakarta.
Nurhayati, Scorpio S, Herdinie. 2007. Analisis Karakteristik Konsumsi Energi pada Sektor Rumah Tangga di Indenesia. Seminar Nasional III SDM Teknologi Nuklir Yogyakarta, 21-22 Nov. 2007
Richarson, Harry W, 2001, Dasar - Dasar Ilmu Ekonomi Regional, Lembaga Demografi Universitas Indonesia, Jakarta.
Susan Olivia; John Gibson, 2008. “Household Energi Demand and the Equity and Efficiency Aspects of Subsidy Reform in Indonesia”. The Energi Journal;
2008; 29, 1;
Sherraden, Michael, 2006, Aset untuk Orang Miskin, PT. Raja Grafindo Persada, Jakarta.