604
Indonesian-Malaysian Stock Market Models Using Fuzzy
Random Time Series
Riswan Efendi1,2, Nureize Arbaiy2, Mustafa Mat Deris2
1Mathematics Department, UIN Suska Riau, Indonesia
2
Faculty of Computer Science and Information Technology, UTHM, Malaysia [email protected]; [email protected]; [email protected]
Abstract
Various fuzzy and non-fuzzy models have been presented to forecast the stock market with multiple inputs data or variables. In other words, some of the researchers have overlooked the key success in financial time series forecasting which is minimizing number of inputs. Moreover, most of the existing time series models have been focused on data consisting of single values, or fuzzy numbers without randomness into consideration. In real situations, there exists a genuine need to cope with data that involves the factors of fuzziness and probability. To address the drawbacks, we propose an enhanced fuzzy random auto-regression model for better stock market forecasting using the low-high procedure. This procedure is able to represent the daily prices variations in stocks. The daily stock markets of Indonesia-Malaysia are used as numerical examples and efficiency of the proposed procedure is compared with baselines models.
Keywords: fuzzy random variable, stock market, low-high data, auto-regression time series, forecasting
1. Introduction
In the present global financial crisis, foreign exchange rates, foreign assets and stock market prices are indispensable indicators in the international financial markets. Some Asian
countries’ currencies, such as, the Indonesian Rupiah (IDR), the Malaysian Ringgit (RM), and others have sharply decreased in value as compared to the US dollar since 1997. This has led to a serious economic impact resulting in the slowdown of the economic activities in these countries. The continuing depreciation trend of the US dollar has attracted many researchers to explore the currency trading, especially in establishing an efficient method to forecast the volatile exchange rates and stock market prices. Many methods have been introduced ranging from the linear and the non-linear regression to artificial intelligence algorithms [1].
Among these methods, the fuzzy logic methods are found to be suitable due to its ability in pattern recognition and handling of the non-probabilistic uncertainties type in the stock market prices data. Moreover, the fuzzy logic is capable of bridging the gap between the numerical data (quantitative information) and the linguistic statement (qualitative information). For example, the investment using technical analysis and fuzzy logic [2], a type-2 fuzzy rule-based expert system model for stock price analysis [3]. Moreover, various fuzzy techniques have been explored into stock markets predictions, such as, fuzzy time series [4], the hybrid fuzzy with others [5],[6] and fuzzy meta-graph [7].
605
Based on surveying of stock market approaches, the key point to successful of stock market forecasting is achieving best results with minimum required in input data [10]. However, some of the previous studies established the forecasting models with multiple number of input variables. On the other hands, the number of variables may negatively influence the autocorrelation and the models’ parameters.
Motivated by the existing fuzzy models [1] – [9] and the surveying stock market approaches [10], this paper propose an enhanced of fuzzy random auto-regression for stock market forecasting which include two different inputs, namely; low and high prices data. Both inputs are very important to be investigated in improving the forecasting values and achieving the forecasting accuracy. The main contribution of this paper is to provide a better stock market forecasting model using FR-AR concept.
2. Fundamental Theories of Fuzzy Random 2.1. Fuzzy Random Variable (FRV = FRD)
Given some universe, , let Pos be a possibility measure that is defined on the power set
Ƥ( ) of . Let be the set of real numbers. A function: → is said to be a fuzzy variable defined on . The possibility distribution of is defined by ( ) = Pos{ }, , which is the possibility of event { }. For fuzzy variable , with possibility distribution , the possibility (Pos), necessity (Nec), and credibility (Cr) of event { } are given as follows [8], [9]:
Pos { } = ( ), , ……….(1)
Nec { } = , ,……….(2)
Cr { } = ½ (1 + ). ………..(3)
From Eq. (3), we note that the credibility measure is an average of the possibility and the necessity measures, i.e., Cr{.} = . The motivation behind the introduction of the credibility
measure is to develop a certain measure, which is a sound aggregate of the two extreme cases, such as the possibility (which expresses a level of overlap and highly optimistic in this sense) and necessity (that articulates a degree of inclusion and is pessimistic in its nature). Based on credibility measure, the expected value of fuzzy variable is presented as follows [8].
Definition 1. Expected value of fuzzy variable [9]
Let be a fuzzy variable. The expected value of is defined as:
, ………(4)
under the condition that the two integral are finite. Assume that is triangular fuzzy variable (TFV = TFN) whose possibility distribution is given by
, ……….(5)
Making use of Eq. (4), we determine the expected value of to be
606
Definition 2. Fuzzy random variable [9]Suppose that (Ω, Σ, Pr) is a probability space and Fvis a collection of fuzzy variables defined on
possibility space ( , Ƥ( ), Pos). a fuzzy random variable is a mapping X: Ω → Fv such that for any
Borel subset B of R, Pos{X(ω) B} is a measurable function of ω. Let be a fuzzy random variable on Ω. From the previous definition, we know, for each ω є Ω, that X(ω) is a fuzzy variable.
Furthermore, a fuzzy random variable is said to be positive if, for almost every ω, fuzzy variable ( ) is positive almost surely. For any fuzzy random variable on Ω, for each є Ω, the expected value of the fuzzy variable is denoted by , which has been proved to be a
measurable function of , i.e., it is random variable. Given this, the expected value of the fuzzy random variable is defined as the mathematical expectation of the random variable
Definition 3. Expected value of fuzzy random variable [9]
Let be a fuzzy random variable defined on probability space (Ω, Σ, Pr). Then, the expected value of and variance of are defined as
……….(7)
………..(8)
where e = is given by Eq. (7).
2.2. Fuzzy Random Auto-Regression (FR-AR) Model
Based on [9], the fuzzy random auto-regression (FR-AR) model can be defined as input and output data for all are fuzzy random variables, which are written as:
, ……….(9)
where is a time series data at time- and its formatted as a triangular fuzzy number [left, l; center, c; ; right, r]. From Eq. (10), all values given as fuzzy numbers with probabilities, .
Let a simple FR-AR model with coefficients and can be written as:
,
……….(10)
To estimate both coefficient and estimated FR-AR model can be derived by following steps:
Step 1: Transform actual time series data (single point) into fuzzy format. Step 2: Divide the fuzzy data (FD) into the fuzzy random data [left, center, right] with their
random probabilities ( ).
Step 3: Calculate the expected value ( ) and standard deviation ( ) of fuzzy random data (FRD) as determined in Step 2, respectively.
607
Standard deviation ( ) = = .
Step 4: Determine the confidence-interval (CI) of FRD.
Step 5: Estimate CI for each coefficient model by using linear programming (LP) approach. Step 6: From Step 5, state the confidence interval (CI) estimated for each coefficient
model.
.
3. Results and Analysis
3.1. Proposed Data Preparation
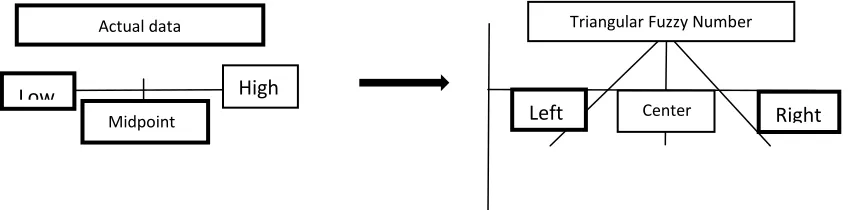
In many existing studies, the single point format (left side of Figure 1) is frequently used to forecast the stock market prices data. While, it is insufficient to interpret such the financial or economic systems only based the average values (single points). Based on this format, the uncertainty, the randomness, the possibility or the human behaviors cannot be coped [9]. So it is desirable to propose the low-high procedure (right side of Figure 2) and fuzzy random
variable which can capture the ambiguity of a structure when we analyze and forecast the stock market system which has many vague factors.
70
Figure 1. The single and low-high stock markets data
Based on Figure 1 (right side), the actual of low-high data can be transformed into triangular fuzzy number (TFN) as illustrated in Figure 2.
Figure 2. Transformation of actual low-high data into TFN
Based on Figure 2, the transformation between values can be detailed as:
Low data Left spread of TFN Midpoint Center of TFN High data Right spread of TFN
Low
High
Midpoint
Left
CenterRight
608
Let and be a lowest and highest stock market data at time- , then both of them can be written as:,
………(11)
By using Eq. (11), all actual of low-high stock market data can be transformed into fuzzy format as presented in Table 1.
Table 1. The low-high prices of stock market and fuzzy data Day (Time) Low High Fuzzy data (FD)
… … … …
3.2. Building Stock Market Model Using FR-AR
By considering Sections 2.2 and 3.1, FR-AR of stock market model can be established by following steps:
Step 1. Divide fuzzy data (FD) into two-fuzzy random data (FRD1, FRD2) as input data:
. ………..(12)
Here, we define FRD 1 and FRD 2 as TFN time series data:
FRD1 ,………..(13)
FRD2 ,
……….(14)
By using Eq. (12-14), fuzzy random data can be detailed in Table 2.
Table 2. Fuzzy random time series data (FRD1 and FRD2)
Time Fuzzy data FRD1, FRD2,
Step 2: Calculate the expected value ( ) and standard deviation ( ) for FRD-output by using FRD1 and FRD2 and their random probabilities ( ). While, ( ) of both FRDs are derived by implementation of integration technique as follows:
(FRD1) = , ………..(15)
609
(FRD2) = ……….(16)
Based on Eqs. (15) and (16), the variance of FRD can be written as:
, ……….(17)
Step 3: Define the confidence-interval (CI) of FRD. From Eq. (17), it standard deviation can be written as:
, ……….(18)
By using and of a fuzzy random variable (FRD), then we consider the one-sigma
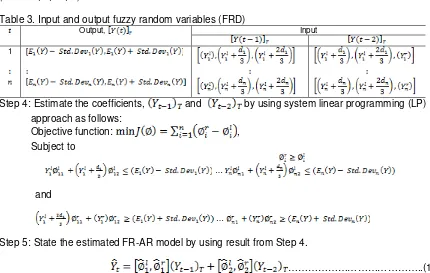
confidence interval of each output-fuzzy random variable, they can be expressed (for = 1, 2, …, ) in Table 3.
Table 3. Input and output fuzzy random variables (FRD)
Output, Input
1 [
[
Step 4: Estimate the coefficients, and by using system linear programming (LP) approach as follows:
Objective function: ,
Subject to
…
and
…
Step 5: State the estimated FR-AR model by using result from Step 4.
………..(19)
Moreover, Eq. (19) can be used to predict the low ( ), the medium ( ) and the high ( ) stock prices as follows:
,
………(20)
3.3. Implementation
610
In this section, the proposed model is applied for forecasting the IHSG from January to July 2009. By following steps given in Section 3.2, proposed FR-AR model for this stock can be written as:= + ………..(21)
In this case, we obtain the same low-high parameters for and . Moreover, the forecasting error of the proposed model is compared with the baseline models as shown in Table 4.
Table 4. MSE comparison between proposed model and baselines models
Model MSE (Mean Square Error)
Training data (80%) Testing data (20%)
ARIMA (0, 1, 0) 846.04 8807.94
Fuzzy time series (FTS) 993.96 4724.68
Proposed FR-AR 670.53** 978.66**
Based on Table 4, the error comparison indicates that MSE of proposed FR-AR is smaller than ARIMA and fuzzy time series (FTS) for training and testing data, respectively. By proposed model, the forecasting error can be reduced very significantly if compared with both existing models. In other words, the capability of proposed model is better than others in IHSG forecasting. Moreover, fitting between actual and its training-testing data are also illustrated in Figure 3. While in Figure 4, the illustration between actual-low-medium-high of IHSG and its forecasted values are presented.
140
Actual and Training Data Bas e d On Propos e d Mode l and Exis ting Mode ls
22
Time Se rie s Plot of For-Low, Actual-Low, For-High, Actual-High
27
3.3.2. Malaysian Stock Market Model
In this section, the proposed model is applied for forecasting the KLSE from January to July 2009. By using steps given in Section 3.2, proposed FR-AR for this data can be written as :
= + ……….(22)
611
Table 4. MSE comparison between proposed model and baselines models
Model MSE
Training data (80%) Testing data (20%) ARIMA (0, 1, 0) 138.10 355.97
Fuzzy time series (FTS) 78.53 84.56
Proposed FR-AR 60.19**
69.21**
From Table 5, the error comparison indicates that MSE of proposed FR-AR is smaller than ARIMA and fuzzy time series (FTS) for training and testing data, respectively. By proposed model, the forecasting error can be reduced very significantly if compared with both existing models. In other words, the capability of proposed model is better than others in KLSE forecasting. From Sections 3.1, 3.2 and Eq. (20), we can highlight the main advantage of proposed model are: (i). the low-high data are minimum input, (ii). The variation/variability of daily stock prices can be covered, (iii). It can be implemented to forecast three different values; low-medium-high directly. In other words, the existing models have overlooked with these advantages.
4. Conclusion
In this paper, we propose an enhanced FR-AR model for stock market forecasting based on low-high input procedure. In the forecasting results, from numerical examples show the result of the proposed formulation is to obtain FR-AR models easily, giving results that are comparable (or improved) with those obtained with more complex models proposed by other researchers. In the forecasting of KLSE and IHSG, the MSE of proposed model is smaller than ARIMA and FTS models in term of training-testing data. At the same time, proposed FR-AR can directly forecast with three different data, such as, low, midpoint and high values. These values are very important to help the decision makers and financial analyst in the monitoring of the present and future stock market data, respectively.
Acknowledgment
Thanks to Research-Innovation Center (ORICC)-UTHM, Malaysia and UIN Suska Riau, Indonesia.
References
[1] Efendi, R., Z. Ismail, Z., and Deris, M. M. Improved Weight Fuzzy Time Series Used in the Exchange
Rates Forecasting of US Dollar to Ringgit Malaysia. International Journal of Computational
Intelligence and Applications. 2013; 12: 71-90.
[2] Yuzie, H. Decision support system for foreign exchange trading. Proceeding of International Fuzzy
Engineering Symposium. 1991; 971-982.
[3] Tseng, F. M., Tzeng, G. H., Yu, H. C., and Yuan, B. J. C. Fuzzy ARIMA Model for Forecasting the
Foreign Exchange Market. Fuzzy Sets and Systems. 2008; 118: 9-19.
[4] Song. Q., and Chissom, B. S. Forecasting enrollments with fuzzy time series – Part 1. Fuzzy Sets and
Systems. 1993; 54: 1 – 9.
[5] Wei, L. Y., Cheng. C. H., and Wu, H. H. A Hybrid ANFIS Based on-Period Moving Average Model to
Forecast TAIEX Stock. Applied Soft Computing. 2014; 19: 86-92.
[6] Song, Q. On A New Framework of Autoregressive Fuzzy Time Series Models. Industrial Engineering
Management System. 2014; 13: 357 – 368.
[7] Anbalagan, T., and Maheswari. S. U. Classification and Prediction Stock Market Based on Fuzzy
Meta-Graph. Proceeding of Procedia Computer Science. 2015; 47: 214 – 221.
[8] Watada, J., Wang, S., and Pedrycz, W. (2009). “Building Confidence-Interval Based Fuzzy Random
Regression Models,” IEEE Transaction Fuzzy System. 2009; 17: 1273 – 1283.
[9] Shao, L., Tsai, Y-H., Watada, J., and Wang, S. Building Fuzzy Random Auto-Regression Model and
Its Application. Watada et al. (Eds): Intelligence Decision Technology. 2012; 1: 155 – 164.
[10] Atsalakis, G. S., and Valavanis, K. V. Surveying Stock Market Techniques-Part II – Soft Computing