Informasi Dokumen
- Penulis:
- Bill Schmarzo
- Pengajar:
- Professor Mouwafac Sidaoui
- Sekolah: University of San Francisco
- Mata Pelajaran: Big Data
- Topik: Big Data MBA
- Tipe: book
- Kota: San Francisco
Ringkasan Dokumen
I. Introduction
The introduction sets the stage for understanding the transformative potential of big data in business contexts. It emphasizes that organizations must integrate data and analytics into their core business strategies rather than treating them as ancillary tools. This section highlights the urgency for business leaders to embrace analytics as a fundamental discipline and to foster a culture of creative thinking to leverage big data effectively.
II. Overview of the Book and Technology
This section outlines the organization of the book, which is divided into four parts, each addressing different aspects of big data's business potential. It underscores the necessity for business stakeholders to take charge of data initiatives and collaborate effectively with IT departments. The section also introduces the significance of a business-centric approach to big data, focusing on practical applications and operationalization of analytics.
III. How This Book Is Organized
The book is structured into four main parts: Business Potential of Big Data, Data Science, Data Science for Business Stakeholders, and Building Cross-Organizational Support. Each part is designed to build upon the previous one, providing readers with a comprehensive understanding of how to leverage big data for competitive advantage. The organization facilitates a step-by-step learning process that aligns with educational objectives in business management.
IV. Who Should Read This Book
Targeted primarily at business users and management, this section clarifies the intended audience for the book. It emphasizes the importance of equipping future leaders with the skills to integrate data science into their business strategies. The section encourages readers to engage with hands-on exercises that reinforce the concepts presented, thus enhancing their learning outcomes and practical application of big data principles.
V. Tools You Will Need
This section outlines the minimal tools required for engaging with the book's content, emphasizing creativity and critical thinking over technical resources. By promoting a hands-on approach to learning, it encourages readers to actively participate in exercises that will solidify their understanding of big data concepts and methodologies, aligning with educational goals of practical application.
VI. Part I: Business Potential of Big Data
Part I establishes the foundational concepts of how big data can drive business transformation. It introduces the Big Data Business Model Maturity Index, which serves as a roadmap for organizations to assess their data integration capabilities. This part emphasizes the importance of aligning data strategies with business objectives, thus promoting a comprehensive understanding of the competitive advantages that can be gained through effective data utilization.
VII. Chapter 1: The Big Data Business Mandate
This chapter discusses the critical need for organizations to recognize big data as a vital component of their business strategy. It challenges the notion that data analytics is merely an IT function, advocating for a more integrated approach where business leaders actively engage in data-driven decision-making. The chapter sets the tone for understanding how big data can unlock new opportunities for value creation.
VIII. Chapter 2: Big Data Business Model Maturity Index
The chapter introduces the Big Data Business Model Maturity Index (BDBM), a framework designed to help organizations evaluate their current capabilities in leveraging data for business advantage. It outlines five phases of maturity, from basic monitoring to transformative business models. This framework provides a structured approach for organizations to assess and enhance their data integration efforts, aligning with educational objectives in strategic management.
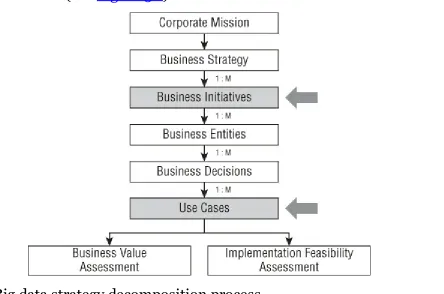
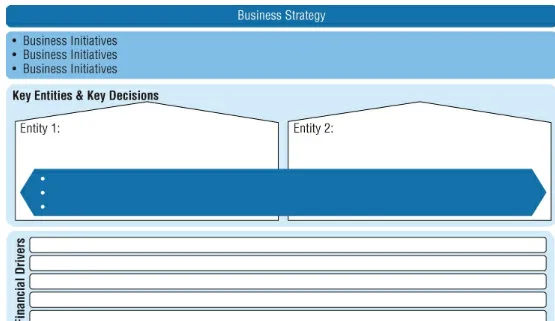
IX. Chapter 3: The Big Data Strategy Document
This chapter presents a strategic document aimed at guiding organizations in their big data initiatives. It emphasizes the importance of a clear business strategy that incorporates data-driven insights. By providing a structured approach to developing a big data strategy, the chapter aligns with educational goals of fostering strategic thinking and planning in business contexts.
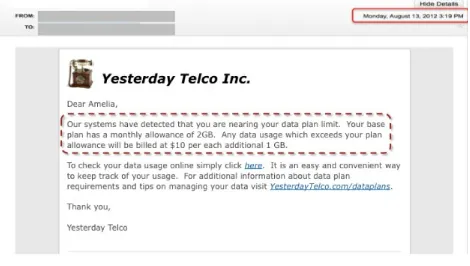
X. Chapter 4: The Importance of the User Experience
Focusing on the user experience, this chapter challenges traditional BI reporting methods and advocates for actionable insights that empower frontline employees. It illustrates how enhancing user experience can drive engagement and productivity, thereby reinforcing the need for organizations to prioritize user-centric data strategies. This aligns with educational outcomes related to customer relationship management and operational efficiency.
XI. Part II: Data Science
Part II delves into the principles of data science, differentiating it from traditional business intelligence. It highlights the complementary roles of both disciplines and provides foundational knowledge necessary for business stakeholders to understand and apply data science methodologies effectively. This section is crucial for educational objectives focused on analytical skills and data literacy.
XII. Chapter 5: Differences Between Business Intelligence and Data Science
This chapter explores the distinct characteristics of business intelligence and data science, emphasizing how each serves different business needs. It educates readers on the unique analytic approaches and data models associated with data science, promoting a deeper understanding of how these disciplines can coexist and enhance business decision-making processes.
XIII. Chapter 6: Data Science 101
In this introductory chapter on data science, various analytic techniques are discussed alongside practical case studies. This hands-on approach reinforces learning outcomes by allowing readers to apply theoretical concepts in real-world scenarios. The chapter serves as a foundational building block for understanding the application of data science in business contexts.
XIV. Chapter 7: The Data Lake
This chapter introduces the concept of a data lake, explaining its role in modern data architecture. It highlights how data lakes facilitate the storage and analysis of diverse data types, thus empowering organizations to harness the full potential of their data. By providing insights into data management strategies, the chapter aligns with educational objectives centered on data governance and analytics.
XV. Part III: Data Science for Business Stakeholders
Part III focuses on equipping business stakeholders with the mindset and skills necessary to think like data scientists. It emphasizes the importance of collaboration between business and data science teams, fostering an environment where data-driven decision-making can thrive. This part aligns with educational outcomes related to leadership and interdisciplinary collaboration.
XVI. Chapter 8: Thinking Like a Data Scientist
This chapter outlines a structured process for developing a data-driven mindset among business leaders. By introducing practical methodologies and exercises, it encourages readers to adopt a scientific approach to problem-solving. This section is vital for educational objectives focused on critical thinking and analytical skills development.
XVII. Chapter 9: “By” Analysis Technique
The 'By' analysis technique is introduced as a practical tool for deriving insights from data. Through case studies, this chapter demonstrates how to apply this technique to real business scenarios, reinforcing the importance of data-driven analysis in decision-making. The hands-on exercises enhance learning outcomes related to data interpretation and application.
XVIII. Chapter 10: Score Development Technique
This chapter discusses the development of scoring systems as a means of guiding business decisions. By providing examples from various industries, it illustrates how scores can facilitate collaboration between business users and data scientists. This practical focus supports educational goals related to performance measurement and strategic planning.
XIX. Chapter 11: Monetization Exercise
The monetization exercise chapter provides a framework for organizations to identify and capitalize on data-driven revenue opportunities. It encourages creative thinking and strategic application of data insights, aligning with educational outcomes focused on entrepreneurship and innovation in business practices.
XX. Chapter 12: Metamorphosis Exercise
This chapter presents an engaging exercise designed to challenge organizations to rethink their business models in light of big data opportunities. By fostering a culture of innovation and adaptability, it aligns with educational objectives related to strategic transformation and organizational change management.
. Part IV: Building Cross-Organizational Support
Part IV addresses the organizational challenges associated with implementing big data initiatives. It emphasizes the importance of cross-functional collaboration and creative thinking in overcoming these challenges. This section is crucial for educational outcomes related to organizational behavior and change management.
. Chapter 13: Power of Envisioning
This chapter introduces envisioning techniques to stimulate creative thinking within organizations. By encouraging collaboration and innovative problem-solving, it promotes a culture that embraces data-driven decision-making. This aligns with educational objectives focused on leadership and organizational development.
. Chapter 14: Organizational Ramifications
Exploring the role of the Chief Data Monetization Officer, this chapter discusses the structural changes organizations may need to implement to support data initiatives. It emphasizes the importance of governance and trust in data management, aligning with educational goals related to organizational structure and leadership.
. Chapter 15: Stories
The final chapter focuses on the power of storytelling in business analytics. By illustrating how to create compelling narratives from data insights, it emphasizes the importance of communication in driving data adoption within organizations. This aligns with educational outcomes related to effective communication and presentation skills.
Referensi Dokumen
- Big Data: Understanding How Data Powers Big Business ( Bill Schmarzo )