Big Data MBA
Driving Business Strategies
with Data Science
Published by
John Wiley & Sons, Inc. 10475 Crosspoint Boulevard Indianapolis, IN 46256 www.wiley.com
Copyright © 2016 by Bill Schmarzo
Published by John Wiley & Sons, Inc., Indianapolis, Indiana Published simultaneously in Canada
ISBN: 978-1-119-18111-8 ISBN: 978-1-119-23884-3 (ebk) ISBN: 978-1-119-18138-5 (ebk)
Manufactured in the United States of America 10 9 8 7 6 5 4 3 2 1
No part of this publication may be reproduced, stored in a retrieval system or transmitted in any form or by any means, electronic, mechanical, photocopying, recording, scanning or otherwise, except as permitted under Sections 107 or 108 of the 1976 United States Copyright Act, without either the prior written permis-sion of the Publisher, or authorization through payment of the appropriate per-copy fee to the Copyright Clearance Center, 222 Rosewood Drive, Danvers, MA 01923, (978) 750-8400, fax (978) 646-8600. Requests to the Publisher for permission should be addressed to the Permissions Department, John Wiley & Sons, Inc., 111 River Street, Hoboken, NJ 07030, (201) 748-6011, fax (201) 748-6008, or online at http://www.wiley .com/go/permissions.
Limit of Liability/Disclaimer of Warranty: The publisher and the author make no representations or war-ranties with respect to the accuracy or completeness of the contents of this work and specifi cally disclaim all warranties, including without limitation warranties of fi tness for a particular purpose. No warranty may be created or extended by sales or promotional materials. The advice and strategies contained herein may not be suitable for every situation. This work is sold with the understanding that the publisher is not engaged in rendering legal, accounting, or other professional services. If professional assistance is required, the services of a competent professional person should be sought. Neither the publisher nor the author shall be liable for damages arising herefrom. The fact that an organization or website is referred to in this work as a citation and/or a potential source of further information does not mean that the author or the publisher endorses the information the organization or website may provide or recommendations it may make. Further, readers should be aware that Internet websites listed in this work may have changed or disappeared between when this work was written and when it is read.
For general information on our other products and services please contact our Customer Care Department within the United States at (877) 762-2974, outside the United States at (317) 572-3993 or fax (317) 572-4002. Wiley publishes in a variety of print and electronic formats and by print-on-demand. Some material included with standard print versions of this book may not be included in e-books or in print-on-demand. If this book refers to media such as a CD or DVD that is not included in the version you purchased, you may download this material at http://booksupport.wiley.com. For more information about Wiley products, visit www.wiley.com.
Library of Congress Control Number: 2015955444
v
Bill Schmarzo is the Chief Technology Offi cer (CTO) of the Big Data Practice of EMC Global Services. As CTO, Bill is responsible for setting the strategy and defi ning the big data service offerings and capabilities for EMC Global Services. He also works directly with organizations to help them identify where and how to start their big data journeys. Bill is the author of Big Data: Understanding How Data Powers Big Business, writes white papers, is an avid blogger, and is a frequent speaker on the use of big data and data science to power an organization’s key business initiatives. He is a University of San Francisco School of Management (SOM) Fellow, where he teaches the “Big Data MBA” course.
Bill has over three decades of experience in data warehousing, business intel-ligence, and analytics. He authored EMC’s Vision Workshop methodology and co-authored with Ralph Kimball a series of articles on analytic applications. Bill has served on The Data Warehouse Institute’s faculty as the head of the analytic applications curriculum. Previously, he was the Vice President of Analytics at Yahoo! and oversaw the analytic applications business unit at Business Objects, including the development, marketing, and sales of their industry-defi ning analytic applications.
vii
ix
Project Editor
Adaobi Obi Tulton
Technical Editor
Jeffrey Abbott
Production Editor
Barath Kumar Rajasekaran
Copy Editor
Chris Haviland
Manager of Content Development & Assembly
Mary Beth Wakefi eld
Production Manager
Kathleen Wisor
Marketing Director
David Mayhew
Marketing Manager
Carrie Sherrill
Professional Technology & Strategy Director
Barry Pruett
Business Manager
Amy Knies
Associate Publisher
Jim Minatel
Project Coordinator, Cover
Brent Savage
Proofreader
Nicole Hirschman
Indexer
Nancy Guenther
Cover Designer
Wiley
Cover Image
xi Acknowledgments are dangerous. Not dangerous like wrestling an alligator or an unhappy Chicago Cubs fan, but dangerous in the sense that there are so many people to thank. How do I prevent the Acknowledgments section from becoming longer than my book? This book represents the sum of many, many discussions, debates, presentations, engagements, and late night beers and pizza that I have had with so many colleagues and customers. Thanks to everyone who has been on this journey with me.
So realizing that I will miss many folks in this acknowledgment, here I go… I can’t say enough about the contributions of Jeff Abbott. Not only was Jeff my EMC technical editor for this book, but he also has the unrewarding task of editing all of my blogs. Jeff has the patience to put up with my writing style and the smarts to know how to spin my material so that it is understandable and readable. I can’t thank Jeff enough for his patience, guidance, and friendship.
Jen Sorenson’s role in the book was only supposed to be EMC Public Relations editor, but Jen did so much more. There are many chapters in this book where Jen’s suggestions (using the Fairy-Tale Theme Parks example in Chapter 6) made the chapters more interesting. In fact, Chapter 6 is probably my favorite chapter because I was so over my skis on the data science algorithms material. But Jen did a marvelous job of taking a diffi cult topic (data science algorithms) and making it come to life.
valuable life lesson: being humble is the best way to learn. I can’t even express in words my admiration for them and how they approach their profession.
Joe Dossantos and Josh Siegel may be surprised to fi nd their names in the acknowledgments, but they shouldn’t be. Both Joe and Josh have been with me on many steps in this big data journey, and both have contributed tremendously to my understanding of how big data can impact the business world. Their fi ngerprints are all over this book.
Adaobi Obi Tulton and Chris Haviland are my two Wiley editors, and they are absolutely marvelous! They have gone out of their way to make the editing process as painless as possible, and they understand my voice so well that I accepted over 99 percent of all of their suggestions. Both Adaobi and Chris were my editors on my fi rst book, so I guess they forgot how much of a PITA (pain in the a**) I can be when they agreed to be the editors on my second book. Though I have never met them face-to-face, I feel a strong kinship with both Adaobi and Chris. Thanks for all of your patience and guidance and your wonderful senses of humor!
A very special thank you to Professor Mouwafac Sidaoui, with whom I co-teach the Big Data MBA at the University of San Francisco School of Management (USF SOM). I could not pick a better partner in crime—he is smart, humble, demanding, fun, engaging, worldly, and everything that one could want in a friend. I am a Fellow at the USF SOM because of Mouwafac’s efforts, and he has set me up for my next career—teaching.
I also what to thank Dean Elizabeth Davis and the USF MBA students who were willing to be guinea pigs for testing many of the concepts and techniques captured in this book. They helped me to determine which ideas worked and how to fi x the ones that did not work.
Another special thank you to EMC, who supported me as I worked at the leading edge of the business transformational potential of big data. EMC has afforded me the latitude to pursue new ideas, concepts, and offerings and in many situations has allowed me to be the tip of the big data arrow. I could not ask for a better employer and partner.
The thank you list should include the excellent and creative people at EMC with whom I interact on a regular basis, but since that list is too long, I’ll just mention Ed, Jeff, Jason, Paul, Dan, Josh, Matt, Joe, Scott, Brandon, Aidan, Neville, Bart, Billy, Mike, Clark, Jeeva, Sean, Shriya, Srini, Ken, Mitch, Cindy, Charles, Chuck, Peter, Aaron, Bethany, Susan, Barb, Jen, Rick, Steve, David, and many, many more.
My mom and dad both passed away, but I can imagine their look of surprise and pride in the fact that I have written two books and am teaching at the University of San Francisco in my spare time. We will get the chance to talk about that in my next life.
xv
Introduction xxiii
Part I Business Potential of Big Data
C H A P T E R
1Chapter 1 The Big Data Business Mandate 3
Chapter 2 Big Data Business Model Maturity Index 17
Chapter 3 The Big Data Strategy Document 35
Chapter 4 The Importance of the User Experience 61
Part II Data Science 83
Chapter 5 Diff erences Between Business Intelligence and Data Science 85
Chapter 6 Data Science 101 107
Chapter 7 The Data Lake 133
Part III Data Science for Business Stakeholders 153
Chapter 8 Thinking Like a Data Scientist 155
Chapter 9 “By” Analysis Technique 171
Chapter 10 Score Development Technique 183
Chapter 11 Monetization Exercise 199
Part IV Building Cross-Organizational Support 229
Chapter 13 Power of Envisioning 231
Chapter 14 Organizational Ramifi cations 245
Chapter 15 Stories 255
xvii
Introduction xxiii
Part I Business Potential of Big Data
C H A P T E R
1Chapter 1 The Big Data Business Mandate 3
Big Data MBA Introduction 4
Focus Big Data on Driving Competitive Differentiation 6
Leveraging Technology to Power Competitive Differentiation 7 History Lesson on Economic-Driven Business Transformation 7
Critical Importance of “Thinking Differently” 10
Don’t Think Big Data Technology, Think Business
Transformation 10
Don’t Think Business Intelligence, Think Data Science 11
Don’t Think Data Warehouse, Think Data Lake 11
Don’t Think “What Happened,” Think “What Will Happen” 12
Don’t Think HIPPO, Think Collaboration 14
Summary 14
Homework Assignment 15
Chapter 2 Big Data Business Model Maturity Index 17 Introducing the Big Data Business Model Maturity Index 18
Phase 1: Business Monitoring 20
Phase 2: Business Insights 21
Phase 3: Business Optimization 25
Phase 4: Data Monetization 27
Phase 5: Business Metamorphosis 28
Big Data Business Model Maturity Index Lessons Learned 30
Lesson 1: Focus Initial Big Data Efforts Internally 30
Lesson 2: Leverage Insights to Create New Monetization
Opportunities 31
Summary 33
Homework Assignment 34
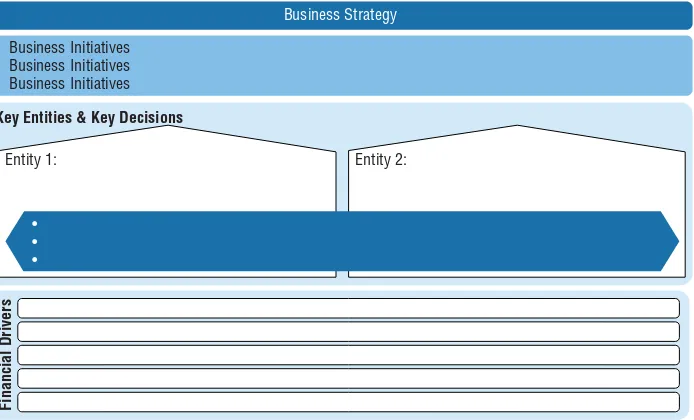
Chapter 3 The Big Data Strategy Document 35
Establishing Common Business Terminology 37 Introducing the Big Data Strategy Document 37
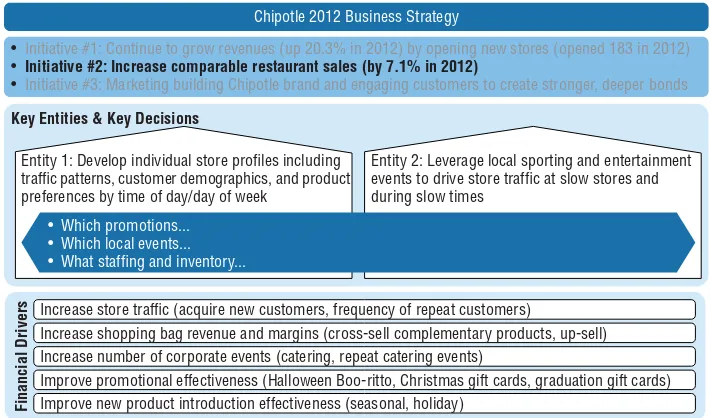
Identifying the Organization’s Key Business Initiatives 39
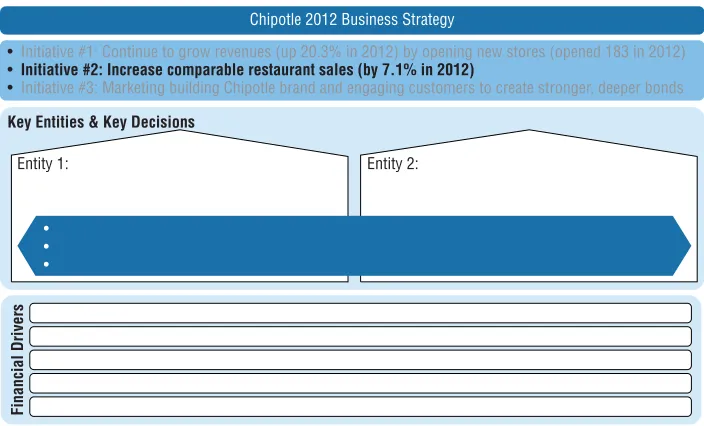
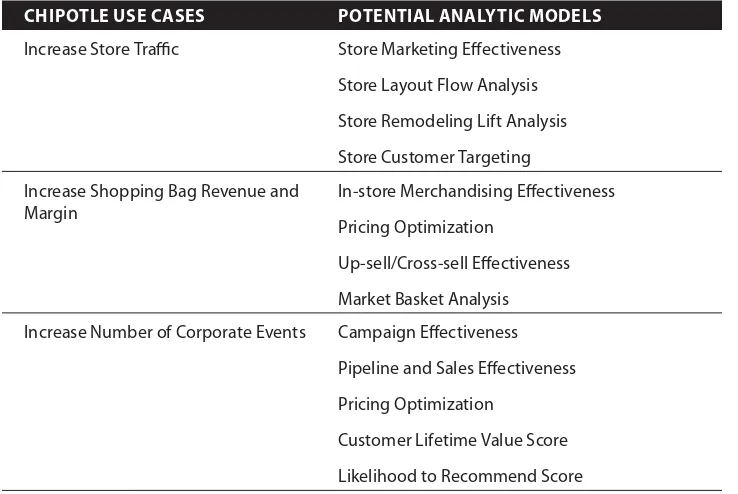
What’s Important to Chipotle? 40
Identify Key Business Entities and Key Decisions 41
Identify Financial Drivers (Use Cases) 45
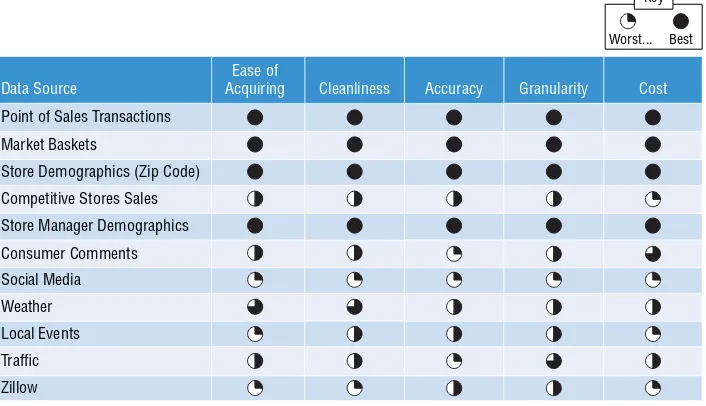
Identify and Prioritize Data Sources 48
Introducing the Prioritization Matrix 51
Using the Big Data Strategy Document to
Win the World Series 52
Summary 57
Homework Assignment 58
Chapter 4 The Importance of the User Experience 61
The Unintelligent User Experience 62
Capture the Key Decisions 63
Support the User Decisions 63
Consumer Case Study: Improve Customer Engagement 64 Business Case Study: Enable Frontline Employees 66
Store Manager Dashboard 67
Sample Use Case: Competitive Analysis 69
Additional Use Cases 70
B2B Case Study: Make the Channel More Effective 71
The Advisors Are Your Partners—Make Them Successful 72
Financial Advisor Case Study 72
Informational Sections of Financial Advisor Dashboard 74
Recommendations Section of Financial Advisor Dashboard 77
Summary 80
Homework Assignment 81
Part II Data Science 83
Chapter 5 Diff erences Between Business Intelligence and Data Science 85
What Is Data Science? 86
BI Versus Data Science: The Questions Are Different 87
BI Questions 88
Data Science Questions 88
The Analyst Characteristics Are Different 89
The Analytic Approaches Are Different 91
Business Intelligence Analyst Engagement Process 91
The Data Scientist Engagement Process 93
Data Modeling for BI 96
Data Modeling for Data Science 98
The View of the Business Is Different 100 Summary 104
Homework Assignment 104
Chapter 6 Data Science 101 107
Data Science Case Study Setup 107
Fundamental Exploratory Analytics 110
Trend Analysis 110
Boxplots 112
Geographical (Spatial) Analysis 113
Pairs Plot 114
Time Series Decomposition 115
Analytic Algorithms and Models 116
Cluster Analysis 116
Normal Curve Equivalent (NCE) Analysis 117
Association Analysis 119
Graph Analysis 121
Text Mining 122
Sentiment Analysis 123
Traverse Pattern Analysis 124
Decision Tree Classifi er Analysis 125
Cohorts Analysis 126
Summary 128
Homework Assignment 131
Chapter 7 The Data Lake 133
Introduction to the Data Lake 134
Characteristics of a Business-Ready Data Lake 136 Using the Data Lake to Cross the Analytics Chasm 137 Modernize Your Data and Analytics Environment 140
Action #1: Create a Hadoop-Based Data Lake 140
Action #2: Introduce the Analytics Sandbox 141
Action #3: Off-Load ETL Processes from Data Warehouses 142
Analytics Hub and Spoke Analytics Architecture 143
Early Learnings 145
Lesson #1: The Name Is Not Important 145
Lesson #2: It’s Data Lake, Not Data Lakes 146
Lesson #3: Data Governance Is a Life Cycle, Not a Project 147 Lesson #4: Data Lake Sits Before Your Data Warehouse,
Not After It 148
What Does the Future Hold? 149
Summary 150
Part III Data Science for Business Stakeholders 153
Chapter 8 Thinking Like a Data Scientist 155
The Process of Thinking Like a Data Scientist 157
Step 1: Identify Key Business Initiative 157
Step 2: Develop Business Stakeholder Personas 158
Step 3: Identify Strategic Nouns 160
Step 4: Capture Business Decisions 161
Step 5: Brainstorm Business Questions 162
Step 8: Putting Analytics into Action 166
Summary 168
Homework Assignment 169
Chapter 9 “By” Analysis Technique 171
“By” Analysis Introduction 172
“By” Analysis Exercise 174
Foot Locker Use Case “By” Analysis 178
Summary 181
Homework Assignment 182
Chapter 10 Score Development Technique 183
Defi nition of a Score 184
FICO Score Example 185
Other Industry Score Examples 188
LeBron James Exercise Continued 189
Foot Locker Example Continued 193
Summary 197
Homework Assignment 197
Chapter 11 Monetization Exercise 199
Fitness Tracker Monetization Example 200
Step 1: Understand Product Usage 200
Step 2: Develop Stakeholder Personas 201 Step 3: Brainstorm Potential Recommendations 203 Step 4: Identify Supporting Data Sources 204 Step 5: Prioritize Monetization Opportunities 206 Step 6: Develop Monetization Plan 208
Summary 209
Homework Assignment 210
Chapter 12 Metamorphosis Exercise 211
Business Metamorphosis Review 212
Business Metamorphosis Exercise 213
Articulate the Business Metamorphosis Vision 214
Understand Your Customers 215
Articulate Value Propositions 215 Defi ne Data and Analytic Requirements 216
Summary 226
Homework Assignment 227
Part IV Building Cross-Organizational Support 229
Chapter 13 Power of Envisioning 231
Envisioning: Fueling Creative Thinking 232
Big Data Vision Workshop Process 232
Pre-engagement Research 233
Business Stakeholder Interviews 234
Explore with Data Science 235
Workshop 236
Setting Up the Workshop 239
The Prioritization Matrix 241
Summary 243
Homework Assignment 244
Chapter 14 Organizational Ramifi cations 245
Chief Data Monetization Offi cer 245
CDMO Responsibilities 246
CDMO Organization 246
Analytics Center of Excellence 247
CDMO Leadership 248
Privacy, Trust, and Decision Governance 248
Privacy Issues = Trust Issues 249
Decision Governance 250
Unleashing Organizational Creativity 251
Summary 253
Homework Assignment 254
Chapter 15 Stories 255
Customer and Employee Analytics 257
Product and Device Analytics 261
Network and Operational Analytics 263
Characteristics of a Good Business Story 265 Summary 266
Homework Assignment 267
xxiii I never planned on writing a second book. Heck, I thought writing one book was enough to check this item off my bucket list. But so much has changed since I wrote my fi rst book that I felt compelled to continue to explore this once-in-a-lifetime opportunity for organizations to leverage data and analytics to transform their business models. And I’m not just talking the “make me more money” part of businesses. Big data can drive signifi cant “improve the quality of life” value in areas such as education, poverty, parole rehabilitation, health care, safety, and crime reduction.
My fi rst book targeted the Information Technology (IT) audience. However, I soon realized that the biggest winner in this big data land grab was the business. So this book targets the business audience and is based on a few key premises:
■ Organizations do not need a big data strategy as much as they need a
business strategy that incorporates big data.
■ The days when business leaders could turn analytics over to IT are over;
tomorrow’s business leaders must embrace analytics as a business disci-pline in the same vein as accounting, fi nance, management science, and marketing.
■ The key to data monetization and business transformation lies in
unleash-ing the organization’s creative thinkunleash-ing; we have got to get the business users to “think like a data scientist.”
■ Finally, the business potential of big data is only limited by the creative
thinking of the business users.
experienced while working with these outstanding and creative students and Professor Mouwafac Sidaoui compelled me to undertake the challenge of writing this second book, targeting those students and tomorrow’s business leaders.
One of the topics that I hope jumps out in the book is the power of data science. There have been many books written about data science with the goal of helping people to become data scientists. But I felt that something was missing—that instead of trying to create a world of data scientists, we needed to help tomorrow’s business leaders think like data scientists.
So that’s the focus of this book—to help tomorrow’s business leaders integrate data and analytics into their business models and to lead the cultural transformation by unleashing the organization’s creative juices by helping the business to “think like a data scientist.”
Overview of the Book and Technology
The days when business stakeholders could relinquish control of data and analytics to IT are over. The business stakeholders must be front and center in championing and monetizing the organization’s data collection and analysis efforts. Business leaders need to understand where and how to leverage big data, exploiting the collision of new sources of customer, product, and operational data coupled with data science to optimize key business processes, uncover new monetization opportunities, and create new sources of competitive differentiation. And while it’s not realistic to convert your business users into data scientists, it’s critical that we teach the business users to think like data scientists so they can collaborate with IT and the data scientists on use case identifi cation, require-ments defi nition, business valuation, and ultimately analytics operationalization. This book provides a business-hardened framework with supporting methodology and hands-on exercises that not only will help business users to identify where and how to leverage big data for business advantage but will also provide guidelines for operationalizing the analytics, setting up the right organizational structure, and driving the analytic insights throughout the organization’s user experience to both customers and frontline employees.
How This Book Is Organized
The book is organized into four sections:
■ Part I: Business Potential of Big Data. Part I includes Chapters 1 through
need a big data strategy as much as they need a business strategy that incorporates big data.”
■ Part II: Data Science. Part II includes Chapters 5 through 7 and covers the
principle behind data science. These chapters introduce some data science basics and explore the complementary nature of Business Intelligence and data science and how these two disciplines are both complementary and different in the problems that they address.
■ Part III: Data Science for Business Stakeholders. Part III includes Chapters
8 through 12 and seeks to teach the business users and business leaders to “think like a data scientist.” This part introduces a methodology and several exercises to reinforce the data science thinking and approach. It has a lot of hands-on work.
■ Part IV: Building Cross-Organizational Support. Part IV includes Chapters
13 through 15 and discusses organizational challenges. This part covers envisioning, which may very well be the most important topic in the book as the business potential of big data is only limited by the creative thinking of the business users.
Here are some more details on each of the chapters in the book:
■ Chapter 1: The Big Data Business Mandate. This chapter frames the big
data discussion on how big data is more about business transformation and the economics of big data than it is about technology.
■ Chapter 2: Big Data Business Model Maturity Index. This chapter
cov-ers the Big Data Business Model Maturity Index (BDBM), which is the foundation for the entire book. Take the time to understand each of the
fi ve stages of the BDBM and how the BDBM provides a road map for measuring how effective your organization is at integrating data and analytics into your business models.
■ Chapter 3: The Big Data Strategy Document. This chapter introduces a
CXO level document and process for helping organizations identify where and how to start their big data journeys from a business perspective.
■ Chapter 4: The Importance of the User Experience. This is one of my
favorite topics. This chapter challenges traditional Business Intelligence reporting and dashboard concepts by introducing a more simple but direct approach for delivering actionable insights to your key business stakeholders—frontline employees, channel partners, and end customers.
■ Chapter 5: Differences Between Business Intelligence and Data Science.
■ Chapter 6: Data Science 101. This chapter (my favorite) reviews 14
dif-ferent analytic techniques that my data science teams commonly use and in what business situations you should contemplate using them.
It is accompanied by a marvelous fi ctitious case study using Fairy-Tale Theme Parks (thanks Jen!).
■ Chapter 7: The Data Lake. This chapter introduces the concept of a data
lake, explaining how the data lake frees up expensive data warehouse resources and unleashes the creative, fail-fast nature of the data science teams.
■ Chapter 8: Thinking Like a Data Scientist. The heart of this book, this
chapter covers the eight-step “thinking like a data scientist” process. This chapter is pretty deep, so plan on having a pen and paper (and probably an eraser as well) with you as you read this chapter.
■ Chapter 9: “By” Analysis Technique. This chapter does a deep dive into
one of the important concepts in “thinking like a data scientist”—the “By” analysis technique.
■ Chapter 10: Score Development Technique. This chapter introduces
how scores can drive collaboration between the business users and data scientist to create actionable scores that guide the organization’s key business decisions.
■ Chapter 11: Monetization Exercise. This chapter provides a technique
for organizations that have a substantial amount of customer, product, and operational data but do not know how to monetize that data. This chapter can be very eye-opening!
■ Chapter 12: Metamorphosis Exercise. This chapter is a fun,
out-of-the-box exercise that explores the potential data and analytic impacts for an organization as it contemplates the Business Metamorphosis phase of the Big Data Business Model Maturity Index.
■ Chapter 13: Power of Envisioning. This chapter starts to address some
of the organizational and cultural challenges you may face. In particular, Chapter 13 introduces some envisioning techniques to help unleash your organization’s creative thinking.
■ Chapter 14: Organizational Ramifi cations. This chapter goes into more
detail about the organizational ramifi cations of big data, especially the role of the Chief Data (Monetization) Offi cer.
■ Chapter 15: Stories. The book wraps up with some case studies, but not
Who Should Read This Book
This book is targeted toward business users and business management. I wrote this book so that I could use it in teaching my Big Data MBA class, so included all of the hands-on exercises and templates that my students would need to successfully earn their Big Data MBA graduation certifi cate.
I think folks would benefi t by also reading my fi rst book, Big Data: Understanding How Data Powers Big Business, which is targeted toward the IT audience. There is some overlap between the two books (10 to 15 percent), but the fi rst book sets the stage and introduces concepts that are explored in more detail in this book.
Tools You Will Need
No special tools are required other than a pencil, an eraser, several sheets of paper, and your creativity. Grab a chai tea latte, some Chipotle, and enjoy!
What’s on the Website
You can download the “Thinking Like a Data Scientist” workbook from the book’s website at www.wiley.com/go/bigdatamba. And oh, there might be another surprise there as well! Hehehe!
What This Means for You
I
Business Potential of Big Data
Chapters 1 through 4 set the foundation for driving business strategies with data science. In particular, the Big Data Business Model Maturity Index highlights the realm of what’s possible from a business potential perspective by providing a road map that measures the effectiveness of your organization to leverage data and analytics to power your business models.
In This Part
Chapter 1: The Big Data Business Mandate
Chapter 2: Big Data Business Model Maturity Index Chapter 3: The Big Data Strategy Document
3 Having trouble getting your senior management team to understand the business
potential of big data? Can’t get your management leadership to consider big data to be something other than an IT science experiment? Are your line-of-business leaders unwilling to commit themselves to understanding how data and analytics can power their top initiatives?
If so, then this “Big Data Senior Executive Care Package” is for you!
And for a limited time, you get an unlimited license to share this care package with as many senior executives as you desire. But you must act NOW! Become the life of the company parties with your extensive knowledge of how new customer, product, and operational insights can guide your organization’s value creation processes. And maybe, just maybe, get a promotion in the process!!
N O T E All company material referenced in this book comes from public sources and is referenced accordingly.
1
Big Data MBA Introduction
The days when business users and business management can relinquish con-trol of data and analytics to IT are over, or at least for organizations that want to survive beyond the immediate term. The big data discussion now needs to focus on how organizations can couple new sources of customer, product, and operational data with advanced analytics (data science) to power their key business processes and elevate their business models. Organizations need to understand that they do not need a big data strategy as much as they need a business strategy that incorporates big data.
The Big Data MBA challenges the thinking that data and analytics are ancil-lary or a “bolt on” to the business; that data and analytics are someone else’s problem. In a growing number of leading organizations, data and analytics are critical to business success and long-term survival. Business leaders and business users reading this book will learn why they must take responsibil-ity for identifying where and how they can apply data and analytics to their businesses—otherwise they put their businesses at risk of being made obsolete by more nimble, data-driven competitors.
The Big Data MBA introduces and describes concepts, techniques, methodologies, and hand-on exercises to guide you as you seek to address the big data business mandate. The book provides hands-on exercises and homework assignments to make these concepts and techniques come to life for your organization. It provides recommendations and actions that enable your organization to start today. And in the process, Big Data MBA teaches you to “think like a data scientist.”
The Forrester study “Reset on Big Data” (Hopkins et al., 2014)1 highlights the critical role of a business-centric focus in the big data discussion. The study argues that technology-focused executives within a business will think of big data as a technology and fail to convey its importance to the boardroom.
Businesses of all sizes must reframe the big data conversation with the busi-ness leaders in the boardroom. The critical and diffi cult big data question that business leaders must address is:
How effective is our organization at integrating data and analytics into our busi-ness models?
Before business leaders can begin these discussions, organizations must understand their current level of big data maturity. Chapter 2 discusses in detail the “Big Data Business Model Maturity Index” (see Figure 1-1). The Big Data Business Model Maturity Index is a measure of how effective an organization is at integrating data and analytics to power their business model.
1 Hopkins, Brian, Fatemeh Khatibloo with Kyle McNabb, James Staten, Andras Cser, Holger
Measures the degree to which the organization has integrated data and analytics into their business
models
Business Optimization Business
Insights Business
Monitoring
Data Monetization
Business Metamorphosis
Figure 1-1: Big Data Business Model Maturity Index
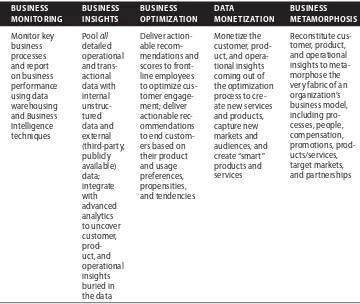
The Big Data Business Model Maturity Index provides a road map for how organizations can integrate data and analytics into their business models. The Big Data Business Model Maturity Index is composed of the following fi ve phases:
■ Phase 1: Business Monitoring. In the Business Monitoring phase,
orga-nizations are leveraging data warehousing and Business Intelligence to monitor the organization’s performance.
■ Phase 2: Business Insights. The Business Insights phase is about
leverag-ing predictive analytics to uncover customer, product, and operational insights buried in the growing wealth of internal and external data sources. In this phase, organizations aggressively expand their data acquisition efforts by coupling all of their detailed transactional and operational data with internal data such as consumer comments, e-mail conversations, and technician notes, as well as external and publicly available data such as social media, weather, traffi c, economic, demographics, home values, and local events data.
■ Phase 3: Business Optimization. In the Business Optimization phase,
organizations apply prescriptive analytics to the customer, product, and operational insights uncovered in the Business Insights phase to deliver actionable insights or recommendations to frontline employees, busi-ness managers, and channel partners, as well as customers. The goal of the Business Optimization phase is to enable employees, partners, and customers to optimize their key decisions.
■ Phase 4: Data Monetization. In the Data Monetization phase,
“smart” products, or re-packaging customer, product, and operational insights to create new products and services, to enter new markets, and/ or to reach new audiences.
■ Phase 5: Business Metamorphosis. The holy grail of the Big Data Business
Model Maturity Index is when an organization transitions its business model from selling products to selling “business-as-a-service.” Think GE selling “thrust” instead of jet engines. Think John Deere selling “farming optimization” instead of farming equipment. Think Boeing selling “air miles” instead of airplanes. And in the process, these orga-nizations will create a platform enabling third-party developers to build and market solutions on top of the organization’s business-as-a-service business model.
Ultimately, big data only matters if it helps organizations make more money and improve operational effectiveness. Examples include increasing customer acquisition, reducing customer churn, reducing operational and maintenance costs, optimizing prices and yield, reducing risks and errors, improving compli-ance, improving the customer experience, and more.
No matter the size of the organization, organizations don’t need a big data strategy as much as they need a business strategy that incorporates big data.
Focus Big Data on Driving Competitive Diff erentiation
I’m always confused about how organizations struggle to differentiate between technology investments that drive competitive parity and those technology investments that create unique and compelling competitive differentiation. Let’s explore this difference in a bit more detail.
Competitive parity is achieving similar or same operational capabilities as those of your competitors. It involves leveraging industry best practices and pre-packaged software to create a baseline that, at worst, is equal to the operational capabilities across your industry. Organizations end up achieving competitive parity when they buy foundational and undifferentiated capabilities from enter-prise software packages such as Enterenter-prise Resource Planning (ERP), Customer Relationship Management (CRM), and Sales Force Automation (SFA).
Competitive differentiation is achieved when an organization leverages people, processes, and technology to create applications, programs, processes, etc., that differentiate its products and services from those of its competitors in ways that add unique value for the end customer and create competitive differentiation in the marketplace.
Let’s call this the ERP effect. ERP software packages were sold as a software solution that would make everyone more profi table by delivering operational excellence. But when everyone is running the same application, what’s the source of the competitive differentiation?
Analytics, on the other hand, enables organizations to uniquely optimize their key business processes, drive a more engaging customer experience, and uncover new monetization opportunities with unique insights that they gather about their customers, products, and operations.
Leveraging Technology to Power Competitive Diff erentiation
While most organizations have invested heavily in ERP-type operational systems, far fewer have been successful in leveraging data and analytics to build strategic applications that provide unique value to their customers and create competitive differentiation in the marketplace. Here are some examples of organizations that have invested in building differentiated capabilities by leveraging new sources of data and analytics:
■ Google: PageRank and Ad Serving
■ Yahoo: Behavioral Targeting and Retargeting ■ Facebook: Ad Serving and News Feed ■ Apple: iTunes
■ Netfl ix: Movie Recommendations
■ Amazon: “Customers Who Bought This Item,” 1-Click ordering, and
Supply Chain & Logistics
■ Walmart: Demand Forecasting, Supply Chain Logistics, and Retail Link ■ Procter & Gamble: Brand and Category Management
■ Federal Express: Critical Inventory Logistics ■ American Express and Visa: Fraud Detection
■ GE: Asset Optimization and Operations Optimization (Predix)
None of these organizations bought these strategic, business-differentiating applications off the shelf. They understood that it was necessary to provide dif-ferentiated value to their internal and external customers, and they leveraged data and analytics to build applications that delivered competitive differentiation.
History Lesson on Economic-Driven Business Transformation
to use traditional data warehousing technologies. This 20 to 50 times economic impact is courtesy of commodity hardware, open source software, an explo-sion of new open source tools coming out of academia, and ready access to free online training on topics such as big data architectures and data science. A client of mine in the insurance industry calculated a 50X economic impact. Another client in the health care industry calculated a 49X economic impact (they need to look harder to fi nd that missing 1X).
History has shown that the most signifi cant technology innovations are ones that drive economic change. From the printing press to interchangeable parts to the microprocessor, these technology innovations have provided an unprecedented opportunity for the more agile and more nimble organizations to disrupt existing markets and establish new value creation processes.
Big data possesses that same economic potential whether it be to create smart cities, improve the quality of medical care, improve educational effectiveness, reduce poverty, improve safety, reduce risks, or even cure cancer. And for many organizations, the fi rst question that needs to be asked about big data is:
How effective is my organization at leveraging new sources of data and advanced analytics to uncover new customer, product, and operational insights that can be used to differentiate our customer engagement, optimize key business processes, and uncover new monetization opportunities?
Big data is nothing new, especially if you view it from the proper perspective. While the popular big data discussions are around “disruptive” technology innovations like Hadoop and Spark, the real discussion should be about the economic impact of big data. New technologies don’t disrupt business models; it’s what organizations do with these new technologies that disrupts business models and enables new ones. Let’s review an example of one such economic-driven business transformation: the steam engine.
The steam engine enabled urbanization, industrialization, and the conquer-ing of new territories. It literally shrank distance and time by reducconquer-ing the time required to move people and goods from one side of a continent to the other. The steam engine enabled people to leave low-paying agricultural jobs and move into cities for higher-paying manufacturing and clerical jobs that led to a higher standard of living.
percent of London’s population was employed in agriculture, while 49.4 percent were in the manufacturing or transportation business. The steam locomotive was a major turning point in history as it transformed society from largely rural and agricultural into urban and industrial.2
Table 1-1 shows other historical lessons that demonstrate how technology innovation created economic-driven business opportunities.
Table 1-1: Exploiting Technology Innovation to Create Economic-Driven Business Opportunities
TECHNOLOGY
INNOVATION ECONOMIC IMPACT
Printing Press Expanded literacy (simplifi ed knowledge capture and enabled knowledge dissemination and the education of the masses)
Interchangeable Parts Drove the standardization of manufacturing parts and fueled the industrial revolution
Steam Engine (Railroads and Steamboats)
Sparked urbanization (drove transition from agricultural to manufacturing-centric society)
Internal Combustion Engine Triggered suburbanization (enabled personal mobility, both geographically and socially)
Interstate Highway System Foundation for interstate commerce (enabled regional specialization and wealth creation)
Telephone Democratized communications (by eliminating distance and delays as communications issues)
Computers Automated common processes (thereby freeing humans for more creative engagement)
Internet Gutted cost of commerce and knowledge shar-ing (enabled remote workforce and international competition)
This brings us back to big data. All of these innovations share the same lesson: it wasn’t the technology that was disruptive; it was how organizations leveraged the technology to disrupt existing business models and enabled new ones.
Critical Importance of “Thinking Diff erently”
Organizations have been taught by technology vendors, press, and analysts to think faster, cheaper, and smaller, but they have not been taught to “think differently.” The inability to think differently is causing organizational align-ment and business adoption problems with respect to the big data opportunity. Organizations must throw out much of their conventional data, analytics, and organizational thinking in order to get the maximum value out of big data. Let’s introduce some key areas for thinking differently that will be covered throughout this book.
Don’t Think Big Data Technology, Think Business
Transformation
Many organizations are infatuated with the technical innovations surround-ing big data and the three Vs of data: volume, variety, and velocity. But startsurround-ing with a technology focus can quickly turn your big data initiative into a science experiment. You don’t want to be a solution in search of a problem.
Instead, focus on the four Ms of big data: Make Me More Money (or if you are a non-profi t organization, maybe that’s Make Me More Effi cient). Start your big data initiative with a business-fi rst approach. Identify and focus on addressing the organization’s key business initiatives, that is, what the organization is trying to accomplish from a business perspective over the next 9 to 12 months (e.g., reduce supply chain costs, improve supplier quality and reliability, reduce hospital-acquired infections, improve student performance). Break down or decompose this business initiative into the supporting decisions, questions, metrics, data, analytics, and technology necessary to support the targeted business initiative.
C R O S S R E F E R E N C E This book begins by covering the Big Data Business Model Maturity Index in Chapter 2. The Big Data Business Model Maturity Index helps organizations address the key question:
How effective is our organization at leveraging data and analytics to power our key business processes and uncover new monetization opportunities?
Don’t Think Business Intelligence, Think Data Science
Data science is different from Business Intelligence (BI). Resist the advice to try to make these two different disciplines the same. For example:
■ Business Intelligence focuses on reporting what happened (descriptive
analytics). Data science focuses on predicting what is likely to happen (predictive analytics) and then recommending what actions to take (pre-scriptive analytics).
■ Business Intelligence operates with schema on load in which you have to
pre-build the data schema before you can load the data to generate your BI queries and reports. Data science deals with schema on query in which the data scientists custom design the data schema based on the hypothesis they want to test or the prediction that they want to make.
Organizations that try to “extend” their Business Intelligence capabilities to encompass big data will fail. That’s like stating that you’re going to the moon, then climbing a tree and declaring that you are closer. Unfortunately, you can’t get to the moon from the top of a tree. Data science is a new discipline that offers compelling, business-differentiating capabilities, especially when coupled with Business Intelligence.
C R O S S R E F E R E N C E Chapter 5 (“Diff erences Between Business Intelligence and Data Science”) discusses the diff erences between Business Intelligence and data science and how data science can complement your Business Intelligence organiza-tion. Chapter 6 (“Data Science 101”) reviews several diff erent analytic algorithms that your data science team might use and discusses the business situations in which the diff erent algorithms might be most appropriate.
Don’t Think Data Warehouse, Think Data Lake
In the world of big data, Hadoop and HDFS is a game changer; it is funda-mentally changing the way organizations think about storing, managing, and analyzing data. And I don’t mean Hadoop as yet another data source for your data warehouse. I’m talking about Hadoop and HDFS as the foundation for your data and analytics environments—to take advantage of the massively parallel processing, cheap scale-out data architecture that can run hundreds, thousands, or even tens of thousands of Hadoop nodes.
to treat data as an organizational asset to be gathered and nurtured versus a cost to be minimized.
Organizations need to treat their reporting environments (traditional BI and data warehousing) and analytics (data science) environments differently. These two environments have very different characteristics and serve different purposes. The data lake can make both of the BI and data science environments more agile and more productive (Figure 1-2).
ALL Data Fed Into Hadoop Data Lake
Hadoop Data Lake
Data Preparation and Enrichment
Analytic Sandbox Analytics Environment
BI Environment
DW
• Production • Predictable load • SLA-driven • Heavily governed • Standard tools
• Exploratory, ad hoc • Unpredictable load • Experimentation • Loosely governed • Best tool for the job ETL
Figure 1-2: Modern data/analytics environment
C R O S S R E F E R E N C E Chapter 7 (”The Data Lake“) introduces the concept of a data lake and the role the data lake plays in supporting your existing data warehouse and Business Intelligence investments while providing the foundation for your data science environment. Chapter 7 discusses how the data lake can un-cuff your data sci-entists from the data warehouse to uncover those variables and metrics that might be better predictors of business performance. It also discusses how the data lake can free up expensive data warehouse resources, especially those resources associated with Extract, Transform, and Load (ETL) data processes.
Don’t Think “What Happened,” Think “What Will Happen”
performance, such as “How many widgets did I sell last month?” and “What were my gross sales last quarter?”
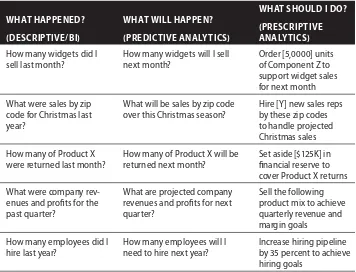
Unfortunately, this retrospective view of the business doesn’t help when try-ing to make decisions and take action about future situations. We need to get business users to “think differently” about the types of questions they can ask. We need to move the business investigation process beyond the performance monitoring questions to the predictive (e.g., What will likely happen?) and pre-scriptive (e.g., What should I do?) questions that organizations need to address in order to optimize key business processes and uncover new monetization opportunities (see Table 1-2).
Table 1-2: Evolution of the Business Questions
WHAT HAPPENED?
How many widgets did I sell last month?
How many widgets will I sell next month?
Order [5,0000] units of Component Z to support widget sales for next month
What were sales by zip code for Christmas last year?
What will be sales by zip code over this Christmas season?
Hire [Y] new sales reps by these zip codes to handle projected fi nancial reserve to cover Product X returns
What were company rev-enues and profi ts for the past quarter?
What are projected company revenues and profi ts for next quarter?
Sell the following product mix to achieve quarterly revenue and margin goals
How many employees did I hire last year?
How many employees will I need to hire next year?
Increase hiring pipeline by 35 percent to achieve hiring goals
Don’t Think HIPPO, Think Collaboration
Unfortunately, today it is still the HIPPO—the Highest Paid Person’s Opinion— that determines most of the business decisions. Reasons such as “We’ve always done things that way” or “My years of experience tell me …” or “This is what the CEO wants …” are still given as reasons for why the HIPPO needs to drive the important business decisions.
Unfortunately, that type of thinking has led to siloed data fi efdoms, siloed deci-sions, and an un-empowered and frustrated business team. Organizations need to think differently about how they empower all of their employees. Organizations need to fi nd a way to promote and nurture creative thinking and groundbreak-ing ideas across all levels of the organization. There is no edict that states that the best ideas only come from senior management.
The key to big data success is empowering cross-functional collaboration and exploratory thinking to challenge long-held organizational rules of thumb, heuristics, and “gut” decision making. The business needs an approach that is inclusive of all the key stakeholders—IT, business users, business management, channel partners, and ultimately customers. The business potential of big data is only limited by the creative thinking of the organization.
C R O S S R E F E R E N C E Chapter 13 (“Power of Envisioning”) discusses how the BI and data science teams can collaborate to brainstorm, test, and refi ne new variables that might be better predictors of business performance. We will introduce several techniques and concepts that can be used to drive collaboration between the busi-ness and IT stakeholders and ultimately help your data science team uncover new customer, product, and operational insights that lead to better business performance. Chapter 14 (“Organizational Ramifi cations”) introduces organizational ramifi cations, especially the role of Chief Data Monetization Offi cer (CDMO).
Summary
Big data is interesting from a technology perspective, but the real story for big data is how organizations of different sizes are leveraging data and analytics to power their business models. Big data has the potential to uncover new customer, product, and operational insights that organizations can use to optimize key business processes, improve customer engagement, uncover new monetization opportunities, and re-wire the organization’s value creation processes.
group your organization will likely fall. Senior business leadership needs to determine where and how to leverage data and analytics to power your business models before a more nimble competitor or a hungrier competitor disintermedi-ates your business.
To realize the fi nancial potential of big data, business leadership must make big data a top business priority, not just a top IT priority. Business leadership must actively participate in determining where and how big data can deliver business value, and the business leaders must be front and center in leading the integration of the resulting analytic insights into the organization’s value creation processes.
For leading organizations, big data provides a once-in-a-lifetime business opportunity to build key capabilities, skills, and applications that optimize key business processes, drive a more compelling customer experience, uncover new monetization opportunities, and drive competitive differentiation. Remember: buy for parity, but build for competitive differentiation.
At its core, big data is about economic transformation. Big data should not be treated like just another technology science experiment. History is full of lessons of how organizations have been able to capitalize on economics-driven business transformations. Big data provides one of those economic “Forrest Gump” moments where organizations are fortunate to be at the right place at the right time. Don’t miss this opportunity.
Finally, organizations have been taught to think cheaper, smaller, and faster, but they have not been taught to think differently, and that’s exactly what’s required if you want to exploit the big data opportunity. Many of the data and analytics best practices that have been taught over the past several decades no longer hold true. Understand what has changed and learn to think differently about how your organization leverages data and analytics to deliver compel-ling business value.
In summary, business leadership needs to lead the big data initiative, to step up and make big data a top business mandate. If your business leaders don’t take the lead in identifying where and how to integrate big data into your business models, then you risk being disintermediated in a marketplace where more agile, hungrier competitors are learning that data and analytics can yield compelling competitive differentiation.
Homework Assignment
Use the following exercises to apply what you learned in this chapter.
acquisition, reduce customer churn, optimize predictive maintenance, reduce revenue theft, and so on.
Exercise #2: Brainstorm and write down what (1) customer, (2) product, and (3) operational insights your organization would like to uncover in order to support the targeted business initiative. Start by capturing the different types of descriptive, predictive, and prescriptive questions you’d like to answer about the targeted business initiative. Tip: Don’t worry about whether or not you have the data sources you need to derive the insights you want (yet).
17 Organizations do not understand how far big data can take them from a business transformation perspective. Organizations don’t have a way of understanding what the ultimate big data end state would or could look like or answering questions such as:
■ Where and how should I start my big data journey?
■ How can I create new revenue or monetization opportunities?
■ How do I compare to others with respect to my organization’s adoption
of big data as a business enabler?
■ How far can I push big data to power—even transform—my business
models?
To help address these types of questions, I’ve created the Big Data Business Model Maturity Index. Not only can organizations can use this index to under-stand where they sit with respect to other organizations in exploiting big data and advanced analytics to power their business models, but the index provides a road map to help organizations accelerate the integration of data and analytics into their business models.
The Big Data Business Model Maturity Index is a critical foundational concept supporting the Big Data MBA and will be referenced regularly throughout the book. It’s important to lay a strong base foundation in how organizations can use the Big Data Business Model Maturity Index to answer this fundamental
2
big data business question: “How effective is my organization at integrating data and analytics into our business models?”
CHAPTER 2 OBJECTIVES
■ Introduce the Big Data Business Model Maturity Index as a framework for orga-nizations to measure how eff ective they are at leveraging data and analytics to power their business models
■ Discuss the objectives and characteristics of each of the fi ve phases of the Big Data Business Model Maturity Index: Business Monitoring, Business Insights, Business Optimization, Data Monetization, and Business Metamorphosis
■ Discuss how the economics of big data and the four big data value drivers can enable organizations to cross the analytics chasm and advance past the Business Monitoring phase into the Business Insights and Business Optimization phases
■ Review lessons learned that help organizations advance through the phases of the Big Data Business Model Maturity Index
Introducing the Big Data Business Model Maturity Index
Organizations are moving at different paces with respect to where and how they are adopting big data and advanced analytics to create business value. Some organizations are moving very cautiously, as they are unclear as to where and how to start and which of the bevy of new technology innovations they need to deploy in order to start their big data journeys. Others are moving at a more aggressive pace by acquiring and assembling a big data technology foundation built on many new big data technologies such as Hadoop, Spark, MapReduce, YARN, Mahout, Hive, HBase, and more.
However, a select few are looking beyond just the technology to identify where and how they should be integrating big data into their existing business processes. These organizations are aggressively looking to identify and exploit opportunities to optimize key business processes. And these organizations are seeking new monetization opportunities; that is, seeking out business oppor-tunities where they can
■ Package and sell their analytic insights to others
■ Integrate advanced analytics into their products and services to create
“intelligent” products
■ Create entirely new products and services that help them enter new
These are the folks who realize that they don’t need a big data strategy as much as they need a business strategy that incorporates big data. And when organizations “fl ip that byte” on the focus of their big data initiatives, the busi-ness potential is almost boundless.
Organizations can use the Big Data Business Model Maturity Index as a framework against which they can measure where they sit today with respect to their adoption of big data. The Big Data Business Model Maturity Index provides a road map for helping organizations to identify where and how they can leverage data and analytics to power their business models (see Figure 2-1).
Measures the degree to which the organization has integrated data
and analytics into its business models
Business Optimization Business
Insights Business
Monitoring
Data Monetization
Business Metamorphosis
Figure 2-1: Big Data Business Model Maturity Index
Organizations tend to fi nd themselves in one of fi ve phases on the Big Data Business Model Maturity Index:
■ Phase 1: Business Monitoring. In the Business Monitoring phase,
organiza-tions are applying data warehousing and Business Intelligence techniques and tools to monitor the organization’s business performance (also called Business Performance Management).
■ Phase 2: Business Insights. In the Business Insights phase, organizations
aggressively expand their data assets by amassing all of their detailed transactional and operational data and coupling that transactional and operational data with new sources of internal data (e.g., consumer com-ments, e-mail conversations, technician notes) and external data (e.g., social media, weather, traffi c, economic, data.gov) sources. Organizations in the Business Insights phase then use predictive analytics to uncover customer, product, and operational insightsburied in and across these data sources.
■ Phase 3: Business Optimization. In the Business Optimization phase,
analytics to optimize key business processes. Organizations in the Business Optimization phase push the analytic results (e.g., recommendations, scores, rules) to frontline employees and business managers to help them optimize the targeted business process through improved decision making. The Business Optimization phase also provides opportunities for
organi-zations to push analytic insights to their customers in order to infl uence customer behaviors. An example of the Business Optimization phase is a retailer that delivers analytic-based merchandising recommendations to the store managers to optimize merchandise markdowns based on purchase patterns, inventory, weather conditions, holidays, consumer comments, and social media postings.
■ Phase 4: Data Monetization. The Data Monetization phase is where
organizations seek to create new sources of revenue. This could include selling data—or insights—into new markets (a cellular phone provider selling customer behavioral data to advertisers), integrating analytical insights into products and services to create “smart” products and ser-vices, and/or re-packaging customer, product, and operational insights to create entirely new products and services that help them enter new markets and target new customers or audiences.
■ Phase 5: Business Metamorphosis. The holy grail of the Big Data Business
Model Maturity Index is when an organization leverages data, analytics, and insights to metamorphose its business. This metamorphosis necessi-tates a major shift in the organization’s core business model (e.g., processes, people, products and services, partnerships, target markets, management, promotions, rewards and incentives) driven by the insights gathered as the organization traversed the Big Data Business Model Maturity Index. One example is organizations that metamorphose from selling products to selling “business-as-a-service.” Think GE selling “thrust” instead of selling jet engines. Think John Deere selling “farming optimization” instead of selling farming equipment. Think Boeing selling “air miles” instead of airplanes. Another example is an organization creating a data and analytics platform that enables the growing body of third-party devel-opers to build and market value-added applications on the organization’s business-as-a-service platform.
Let’s explore each of these phases in more detail.
Phase 1: Business Monitoring
business performance. Sometimes called Business Performance Management, organizations in the Business Monitoring phase create reports and dashboards that monitor the current state of the business, fl ag under- and/or over-perfor-mance areas of the business, and alert key business stakeholders with pertinent information whenever special “out of bound” performance situations occur.
The Business Monitoring phase is a great starting point for most big data journeys. As part of their Business Intelligence and data warehousing efforts, organizations have invested signifi cant time, money, and effort to identify and document their key business processes; that is, those business processes that make their organizations unique and successful. They have assembled, cleansed, normalized, enriched, and integrated the key operational data sources; have painstakingly constructed a supporting data model and data architecture; and have built countless reports, dashboards, and alerts around the key activities and metrics that support that business process. Lots of great assets have already been created, and these assets provide the launching pad for starting our big data journey.
Unfortunately, moving beyond the Business Monitoring phase is a signifi -cant challenge for many organizations. The inertia established from years and decades of BI and data warehouse efforts work against the “think differently” approach that is necessary to fully exploit big data for business value. Plus the big fi nancial payoff isn’t typically realized until the organization pushes through the Business Insights phase into the Business Optimization phase. So let’s discuss how organizations can leverage the economics of big data to cross the analytics chasm.
Phase 2: Business Insights
The Business Insights phase couples the organization’s growing wealth of internal and external structured and unstructured data with predictive analyt-ics to uncover customer, product, and operational insights buried in the data. This means uncovering occurrences in the data that are unusual (or outside normal behaviors, trends, and patterns) and worthy of business investigation.
the analytics chasm and move beyond the Business Monitoring phase into the Business Insights phase. These four big data value drivers are:
1. Access to All of the Organization’s Transactional and Operational Data. In big data, we need to move beyond the summarized and aggregated data that is housed in the data warehouse and be prepared to store and analyze the organization’s complete history of detailed transactional and operational data. Think 25 years of detailed point of sale (POS) transac-tional data, not just the 13 to 25 months of aggregated POS data stored in the data warehouse.
Imagine the business potential of being able to analyze each POS transaction at the individual customer level (courtesy of loyalty programs) for the past 15 to 25 years. For example, grocers could see when individual customers
start to struggle fi nancially because they are likely to change their purchase behaviors and product preferences (i.e., buying lower-quality products, replacing branded products with private label products, increasing the use of discounts and coupons). You can’t see those individual customer behaviors and purchase tendencies in the aggregated data stored in the data warehouse. With big data, organizations have the ability to collect, analyze, and act on the entire history of every purchase occasion by Bill Schmarzo—what products he bought in what combinations, what prices he paid, what coupons he used, what and when he bought on discount, which stores he frequented on what time of day and day of the week, what were the outside weather conditions during those purchase occasions, what were the local economic conditions, etc.
When you can analyze transactional and operational data at the individual customer (or patient, student, technician, teacher, wind turbine, ATM, truck, jet engine, etc.) level, you can uncover insights about individual customer or product behaviors, tendencies, propensities, preferences, and usage patterns. It is on these individual customer or product insights that organizations can take action. It’s very diffi cult to create actionable insights at the aggregated level of store, zip code, or customer behavioral categories.
2. Access to Internal and External Unstructured Data. Data warehouses don’t like unstructured data. Data warehouses want structured data. Since data warehouses have been built on relational database management systems (RDMBS), the data warehouse wants its data in rows and columns. As a consequence, organizations and their business users have been taught that they really don’t need access to unstructured data.