Meliyanni Johar, Prastuti Soewondo, Ardi Adji,
Retno Pujisubekti, Harsa Kunthara Satrio,
Iqbal Dawam Wibisono
TNP2K
WORKING PAPER
IN DATA WE TRUST?
AN ANALYSIS OF INDONESIAN
SOCIO-ECONOMIC SURVEY DATA
TNP2K WORKING PAPER 2 - 2017
December 2017
The TNP2K Working Paper Series disseminates the findings of work in progress to encourage discussion and exchange of ideas on poverty, social protection and development issues.
Support to this publication is provided by the Australian Government through the MAHKOTA Program.
The findings, interpretations and conclusions herein are those of the author(s) and do not necessarily reflect the views of the Government of Indonesia or the Government of Australia.
You are free to copy, distribute and transmit this work, for non-commercial purposes.
Suggested citation: Johar, M., Soewondo, P., Adji, A., Pujisubekti, R., Satrio, H.K., Wibisono, I.D.. 2017. In data we trust? An analysis of Indonesian socio-economic survey data. TNP2K Working Paper 2-2017. Jakarta, Indonesia.
To request copies of this paper or for more information, please contact: info@tnp2k.go.id. The papers are also available at the TNP2K (www.tnp2k.go.id).
TNP2K
Grand Kebon Sirih Lt. 4,
IN DATA WE TRUST?
AN ANALYSIS OF INDONESIAN
SOCIO-ECONOMIC SURVEY DATA
In Data We Trust?
An Analysis of Indonesian Socio-Economic Survey Data
Meliyanni Johar, Prastuti Soewondo, Ardi Adji, Retno Pujisubekti,
Harsa Kunthara Satrio, Iqbal Dawam Wibisono
ABSTRACT
In Data We Trust? An Analysis of Indonesian Socio-Economic Survey D
Meliyanni Johar, Prastuti Soewondo , Ardi Adji, Retno Pujisubekti, Harsa Kunthara Satrio, Iqbal Dawam Wibisono
National Team for the Acceleration of Poverty Reduction (TNP2K), Indonesia
Abstract
What if a popular data set that has generated a long stream of literature has been misunderstoodand has led to misleading inferences? In this paper, we use the case of household expenditure in the Indonesian National Socio-Economic Survey data, SUSENAS, which started over 50 years ago. Appropriate use of SUSENAS for policy analysis requires an understanding that the expenditure variable in SUSENAS does not measure ahousehold’sout-of-pocket expenditure, because it includes the approximated value of any subsidy received by the household in obtaining goods and services. Inferences about private expenditureandincome, which are often derived from the expenditure variable,need to be carefully considered. We also draw attention to an abrupt change in survey instrument in SUSENAS 2014 onwards that extends the reference period of several expenditure items. Using health items as a case study, we demonstrate that this change generates movement in health expenditure that can be misinterpreted as a result of a major national health insurance reform introduced in the same year to lower households’ health care burden. Accordingly, we propose a way to account for this synthetic movement in the health expenditure variable.
Table of Contents
1. Introduction
2. Expenditure in SUSENAS
3. A case study: health care expenditure 4. Discussions
References
List of Figures
Figure 1: Floor and wall materials in households at various income and wealth quintiles
2011-2016
Figure 2: The evolution of conditional total health expenditure
Figure 3: The evolution of conditional total health expenditure by region
Figure 4: The evolution of conditional total health expenditure with comparable zero rate
across waves
List of Tables
Table 1: Cross-tabulation of income and wealth quintiles 2011-2016
Table 2: Total health care expenditure under various reference periods
1
2-4
4-9
9-10
11-13
4
6
7
9
1. Introduction
Indonesia has only one nationally representative data set on socio-economic conditions calledSurvei Sosial Ekonomi Nasional (SUSENAS). SUSENAS is collected by Badan Pusat Statistik (Statistics Indonesia) since 1963. It is a repeated cross-section data every year or two covering all Indonesian provinces. The first wave of SUSENAS involved 14,670 households, but since 2011, itssample size has grown to some 300,000 households and 1.1 million household members. Frequency weights are provided which give counts that reflect the nation’s true population. In 2007, a subset of SUSENAS households (about 27%) was followed for a yeartostudy poverty within a relatively small geographic area (kabupaten). SUSENAS can be linked to various Indonesian data sets, such as Potensi Desa (PODES) at district (kabupaten) level, Riset Kesehatan Dasar (RISKESDAS) and Survei Angkatan Kerja Nasional (SAKERNAS) at group-level (e.g., age-sex group) to give a richer picture of the life of Indonesian households. As such, SUSENAS has been widely used by national and international researchers to answer various research questions, including income inequality (Sidique et al., 2014; Nugraha and Lewis, 2013; Sumarto et al. 2007; Asra, 2000; Cameron, 2000; Akita et al., 1999; Akita and Lukman, 1995), health care behaviours(Sparrow et al., 2014; Van Doorslaer et al., 2010; Kruse et al., 2012; Pradhan and Prescott, 2002), education outcomes (Suryadama, 2012; Akita and Miyata, 2008; Sparrow 2007; Thomas et al., 2004), fertility choice (Grimm et al., 2015; Kim 2010), labour market outcomes (Pasay et al., 2011; Comola and De Mello, 2011;Bird andManning, 2008), as well as policy evaluation studies (Sparrow et al., 2013; Nugraha and Lewis, 2013; Sumarto et al., 2007; Van Doorslaer et al., 2006; Sumarto et al., 2005; Levinshon et al., 2003; Waters et al., 2003).
2. Expenditure in SUSENAS
Buku Pengeluaran(expenditure book) in SUSENAS asks each household’s representative: “How much did the household spend on [item] in the past [reference period]?”1For food items, the reference period is the past 7 days. For non-food items, there arevariationsin the reference period in the last few waves of SUSENAS. Up to 2014, expenditures on all non-food items are available for each month in the past three months. In contrast, in SUSENAS 2015-2016, some items have a reference period of a month while others have a reference period of a year. Previous month’s expenditures are available for rent payments, utilities, fuels for cooking and vehicles, telephone bills, internet bills, hygienic products, newspapers and salaries of domestic workers. Meanwhile, durable goods, home renovation costs, insurance premiums and taxes, clothing expenses, health goods and services, motor vehicle service costs, postage, party and ceremonial supplies and the costsof running own generator at home have a reference period of twelve months.
Although the questionnaire asks“How much didyou spend?”, the values recorded in the data are not purely private spending. For instance, if a household did not pay for, say, its gas bill because of government subsidy, then the interviewer would prompt the respondent to estimate the cost of the gas bill if he/she had to pay. Similarly, if the household received free rice, the value of the rice would also be estimated by the respondent. In general, if a household wasable to postpone or avoid paying for goods or services, the replacement cost, which is the value of any subsidy estimated by the respondent with the help of the interviewer, would be added to the household’s private expenditure. In the case of an item bought by credit, the full purchase price of the itemwas recorded. Replacement cost has been used in all SUSENAS waves but this has not been previously documented.2The observed expenditure
in SUSENAS, therefore, isthe totalexpenditure, equal to a household’s private out-of-pocket plus any replacement cost.This is the first misunderstanding surrounding the expenditure variable in SUSENAS, in that it does not measure households’ private expenditure. Previous studies that have misinterpreted the expenditure variable in SUSENAS as households’ private expenditure are likely to overestimate the purchasing power of these households, especially the purchasing power of low-income households who are likely to receive various kinds of economic assistances. This argument extends tothe creation of an income variable fromthe expenditure variable.Because self-reported income is often unreliable (e.g.,
1 There is no explicit writing on the SUSENAS’s Keterangan Konsumsi/ Pengeluaran Makanan dan Bukan
Makanan, Dan Pendapatan/ Penerimaan Rumah Tanggamodule (Indonesian version) about how the interviewer
askseach expenditure question to household respondents. However, there are titles to each section in the booklet
(e.g., Pengeluaran Untuk Barang-Barang Bukan Makanan Selama Sebulan dan Setahun Terakhir (Dalam
Rupiah)with the health spending located in BLOK IV.2), which can be translated like this in English.
2Unfortunately, there is no indicator as to which item(s) include a replacement cost. There is some information
due to underreporting), income is typically proxied by the sum of expenditures on all items. Since SUSENAS’s expenditure contains subsidies, however, households may appear to have high income when some parts of this income were actually subsidies.
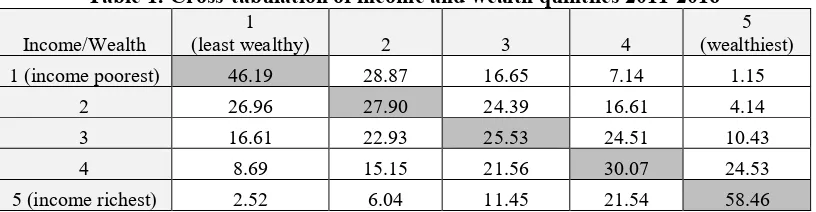
To examine the reliability of the income variable derived from the sum of all expenditures in SUSENAS, we compare it against another measure of households’ economic power, wealth. To measure wealth, we summarise ahousehold’s possession of motor vehicles, house and other valuable goods and housing characteristics (e.g., type of flooring and roofing, utility connections, etc) as wealth indicators using a principle component analysis. For each year, income and wealth quintiles are created. Households are ranked according to their income, weighted by the population frequency weight, then divided into quintiles. Income quintile 1 represents 20% of income-poorest households and income quintile 5 represents 20% of income-richest households. In a similar manner, households are ranked according to their wealth index, weighted by population frequency weight, then divided into quintiles. Wealth quintile 1 represents 20% of the least wealthy households and wealth quintile 5 represents 20% of the wealthiest households.
Table 1 cross-tabulatesthe quintiles of income and wealth. We use the last six waves of SUSENAS in years 2011-2016. The diagonal entries in Table 1 give the proportion of households in a given income quintile that belong to the same quintile of wealth. For instance, 46.19% of households in income quintile 1 (bottom 20% of the income distribution) also belong to the first quintile of wealth (bottom 20% of the wealth distribution). This indicates that a large proportion of households that are poor in income are also poor in wealth. Likewise, 58.46% of households with the highest income (top 20% of the income distribution) are also the wealthiest (top 20% of the wealth distribution). While the diagonal entries give the highest proportion in each row, there are considerable shares in the off-diagonal cells. Among the richest households, 8.54% are in the bottom two wealth quintiles. Similarly, almost 25% of households in the 4thincome quintile are in the bottom two wealth quintiles.
Table 1: Cross-tabulation of income and wealth quintiles 2011-2016
Income/Wealth
1
(least wealthy) 2 3 4
5 (wealthiest) 1 (income poorest) 46.19 28.87 16.65 7.14 1.15
2 26.96 27.90 24.39 16.61 4.14
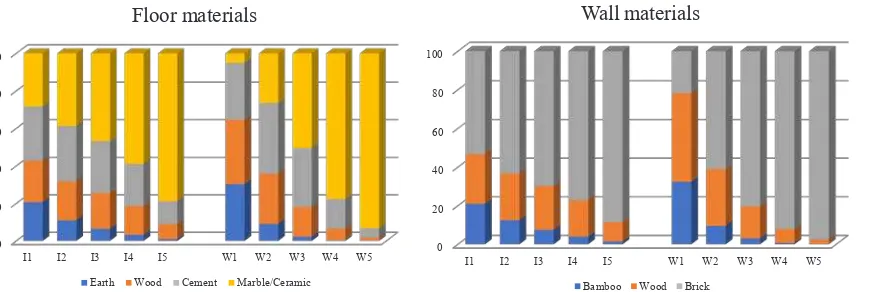
In Figure 1, we single out two housing characteristics, floor and wall materials, and relate them with income and wealth. This picture, perhaps, is more concrete than Table 1, as the wealth index is a summary measure. Wecan see that some householdswith the highest income (I5) still live in a house with earth or wooden flooring and non-brick wall. In contrast, almost all wealthiest households (W5) live in brick houses with marble or ceramic floors.This picture suggests that if one wants a variable that captures households’ economic power in SUSENAS, wealth might be a better variable to use instead of income derived from expenditure.
Figure 1: Floor and wall materials in households at various income and wealth quintiles 2011-2016
Note: each I1-I5 indicates income quintile 1-5. Each W1-W5 indicates wealth quintile. The width of each region in each bar represents the proportion of households in a given income-wealth quintile with a given housing characteristic.
3. A case study: health care expenditure
In this section, our aim is to show that taking SUSENAS’ expenditure at face value can lead to misleading conclusions. Health is an interesting example for at least two reasons.
First, for health services and medical goods, adding areplacement cost for any health subsidy received to households’ out-of-pocket expenditure poses a particularly big problem. Unlike subsidies for utilities and rice, which can be estimated by researchers, for example, through housing characteristics and household size, the size of a health subsidy is difficult to calculate because health goods and services vary greatly in both type and intensity. SUSENAS has relied on appraisal value from the household’s representative. However, people in general do not know the exact price of health services until they see their medical bills. For subsidy recipients, this bill does not exist. It is very unlikely that household representatives can accurately price medical treatments, especially when these treatments involve hospitalisation episode(s), complex procedures and prescription medicines. As a result, the level of
households with high medical needs.The growthinhealth expenditure, on the other hand, may be less affected since the replacement cost has always been added to households’out-of-pocket expenditure.
Second, the reference period for expenditure on non-food items and health care items changed in SUSENAS 2015-2016. Prior to 2015, expenditure on health goods and services in the pastmonth and three months were recorded but in 2015 and 2016, the reference period was changed to the past twelve months. The longer reference period affects mean health expenditure, conditional on positive value (i.e., the conditional mean), which measures the intensity of households’ health care utilisations. To define a health expenditure variable that is comparable across all survey waves, the annual health expenditure in 2015-2016 may be converted to monthly or quarterly health expenditure to match those in SUSENAS 2014 and prior. The problem is that there would be fewer zero observations under the one-year reference period. Many households would have small, but positive monthly and quarterly health expenditure in 2015-2016 because of averaging, not because their health care utilisation has truly increased. Averaging also smooths out the full cost of an adverse health shock. All in all, the conditional mean health expenditure in 2015 and 2016 are likely to smaller than that in 2014 and prior. In addition, longer reference period entails bigger recall bias, especially for occasional outpatient visits and drugs, so households may fail to report all health care consumption during the past year.
Table 2 reports the proportion of households with zero expenditure on all health items and the mean total health expenditure under various scenarios. Thetotal health expenditure is the sum of expenditures on all formal health services and prescription medicines, not including expenditure on any health insurance premium. Only 2-7% of the sample has positive health insurance premium. The nominal expenditure is converted to real 2016 Rupiah. As expected, the proportion of households with zero total health expenditure is the highest under one-month reference period: 52-54%. When the reference period isexpanded to one year in 2015-2016, the proportion of households with zero total health expenditure falls dramatically to 23-26%. As a result, the conditional mean monthly total health expenditure is severely affected: it falls dramatically in 2015 and does not return to the 2014’s level. The mean expenditure in 2015-2016 are italicised to indicate that they are derived from annual total health expenditure. We note that there was neither a massive expansion of health infrastructure nor a major discount in the supply price of health goods and services in the country during 2014-2015, so market condition cannot explain the sharp fall in monthly total health expenditure.
Table 2: Total health care expenditure under various reference periods
2011 2012 2013 2014 2015 2016
Reference: 1 month
Proportion 0 expenditure 0.535 0.528 0.535 0.521 0.228 0.260 Unconditional mean Rp.37,931 Rp.44,782 Rp.55,828 Rp.63,307 Rp.58,587 Rp.66,233
Conditional mean Rp.81,560 Rp.94,861 Rp.120,103 Rp.132,053 Rp.75,865 Rp.89,493
Reference: 3 months
Proportion 0 expenditure 0.367 0.365 0.383 0.377 0.228 0.260
Unconditional mean Rp.103,698 Rp.116,361 Rp.136,441 Rp.156,771 Rp.175,761 Rp.198,699
Conditional mean Rp.163,713 Rp.183,344 Rp.221,165 Rp.251,657 Rp.227,594 Rp.268,478
Note: total health care costs are in real 2016Rp. In 2015-2016, the means are italicised to indicate that they are imputed from the annual total health expenditure observed in the data. Monthly level is derived by dividing the annual level by twelve whilst the quarterly level is derived by dividing the annual level by four. All figures are computed using population frequency weight.
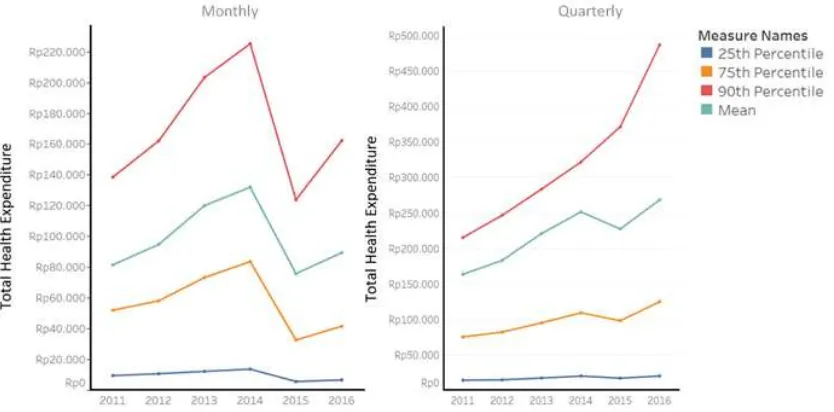
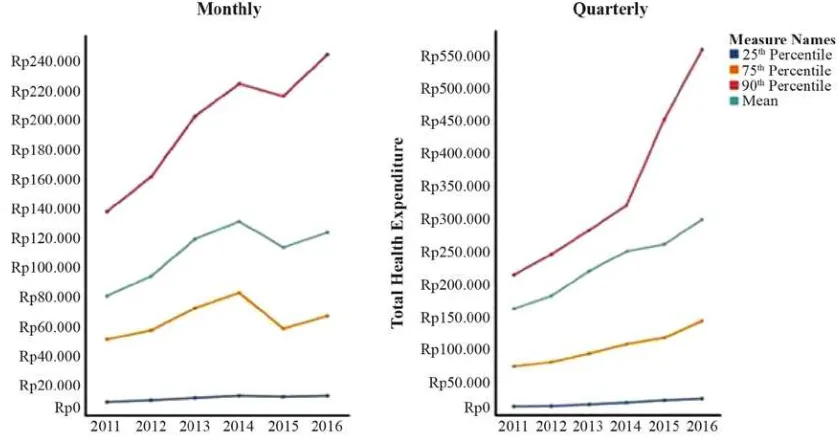
Figure 2 plots the evolution of the conditional mean, 25th, 75th and 90th percentiles total health expenditure over time to give picture of the entire total health expenditure distribution. It shows a dramatic fall in the monthly total health expenditure at the mean and all percentiles in 2015, before rising again in 2016, but not to their respective levels in 2014. For quarterly expenditure, except at the top 10% (i.e., 10% households with the highesttotal health expenditure), total health expenditure also falls in 2015, butrisesagain in 2016. At the top 10%, total health expenditure increases steadily over timewith a sharp increase in 2016.
Figure 2: The evolution of conditional total health expenditure
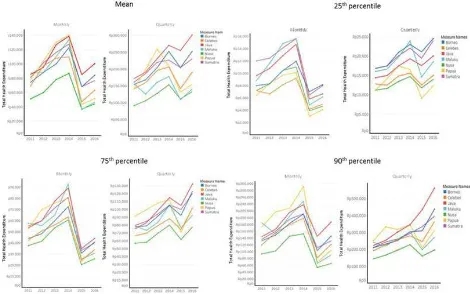
Figure 3 disaggregates the conditional distribution at the national level to regional level. For monthly expenditure, the trend at the national level is replicated in all regions: total health expenditure falls sharply in 2015 and does not return to 2014’s level. This picture supports the hypothesis that the fall in the total health expenditure in 2014-2015 is driven by other factors, not by health market factors because otherwise, different regions with different health infrastructure would have different trends. For quarterly series, we observe some variations across regions, especially in Maluku and Papua. In these two regions, households experienceda sharp fall in total health expenditure in 2015 that doesnot return to the 2014 level by 2016. In other regions, the trend is similar with the national trend.
Figure 3: The evolution of conditional total health expenditure by region
Note: see note underneath Figure 2. Java includes Bali.
This abrupt change in the reference period coincided with a major policy change in the national health market. In 2014, Jaminan Kesehatan Nasional (JKN), a national health insurance scheme, was introduced to ensure access to basic health care by all Indonesians and to protect households from very high out-of-pocket health expenditure. JKN’s enrolment is mandatory (by 2019) and its coverage includes unlimited amount of outpatient care at primary health facilities and inpatient care at public hospitals and participating private hospitals. Naturally, health researchers and policymakers are interested in the JKN’s impact on households’ health care burden. For instance, a recent World Bank
SUSENAS cannot be used to make any inference about households’ health care burden, incidence of catastrophic health spending or impoverishment due to health spending–which definitionrestsunder the assumption that consumption is financed entirely by households’own earned (labour) incomes–, because SUSENAS’s health expenditure includes the contribution of other payers.
Thefall in the monthly total health expenditure in 2015 may be misinterpreted as a change due to JKN. Thedownward movement in total health expenditure would be celebrated as JKN’s success in lowering households’ health care burden by ignorant researchers. However, the change in the reference period of expenditures on health items in SUSENAS 2015-2016 alone can generate movement in total health expenditure. A way to deal with this survey-driven change may be to synchronise the proportion of households with zero total health expenditure in 2015-2016 to that in 2011-2014 (Table 2). We ask the question: “what is the level of total health cost,x, that would make the proportion of households with zero total health expenditure under one year reference period similar to that underone monthreference period?”We find xto be Rp.7,900 in both 2015 and 2016. Below this level, 50% of households actually have total health expenditure less than Rp.4,330 and 75% of households have total health expenditure less than Rp.6,039. Given that an average Indonesian household has 4 members and that the fees at puskemas(the main public primary care provider) is about Rp.6,000 per person per month (repeat visits are not charged), households with monthly total health expenditure below Rp.7,900 would tend to be occasional or low users of health services. These households may seek health care once or twice in a year but may not use any health services every month. If so, it might be reasonable to assume that, had the reference period of health items remained unchanged at one month through to 2016, these households would have zero monthly total health expenditureand they would be excluded from the calculation of the conditional mean. By similar argument, we can adjust the implied quarterly total health expenditurein2015 and 2016 with xcalculatedtobe Rp.11,000.
Figure 4 shows the evolution of the conditional monthly and quarterly total health expenditure after applying the above method to synchronise the proportion of zero observation from 2011 through to 2016. We find quite a different trend tothat in Figure 2 and 3, especially at the bottom and the top of the health expenditure distribution. At the 25thpercentile, total health expenditure increases in the last
2 years, which may capture first-time users of primary health services. At the 90thpercentile, total health
June, September and December. In contrast, there is only one collection point for SUSENAS 2015-2016 in March. It is possible that, because none of the month prior to the collection months in 2011-2014 coincides with a holiday season, health care providers’ availability is high. In effect, the monthly total health expenditure in 2011-2014 is higher relative to that in 2015-2016, which covers some holiday seasons. One other hand, three months prior to the collection months in 2011-2014 always coincides with some holiday periods. As such, when compared to the implied quarterly total health expenditure from the annual total health expenditure in 2015-2016, the trend in quarterly total health expenditure is more stable. We recommend using quarterly total health expenditure for trend over time analysis.
Figure 4: The evolution of conditional total health expenditure with comparable zero rate across waves
Note: see note underneath Figure 3. For monthly series, the adjustment in 2015-2016 involves the exclusion of total health expenditure less than Rp.7,900. For quarterly series, the adjustment in 2015-2016 involves the exclusion of total health expenditure less than Rp.11,000.
4. Discussions
As the official survey of Indonesian households, SUSENAS has informed much economic policy and social assistance programs. Numerous academic papers rely on SUSENAS. The objective of this paper is to help future studies avoid making misleading inferences about household expenditure and income when using information from SUSENAS. We have focused on the misunderstanding concerning the expenditure variable in SUSENAS, which actually comprises of private households’ out-of-pocket expenditure plus the contributionsof other payers. In this sense, SUSENAS’s expenditure reflects total
may be related to the characteristics of the respondent, such as education level and unobserved motive to understate external assistance, or it may increase over time as the national credit market grows and the amount of social assistance increases.
We have also demonstrated that caution is required when using the latest two waves of SUSENAS (SUSENAS 2016). In the case of expenditures on health goods and services, SUSENAS 2015-2016 records health expenditure in the last year whilst earlier SUSENAS waves record health expenditure in the last three months. The change in the reference period creates an artificial movement in the health expenditure that is not due to a real change in health marketactivities.There are also other data issues, albeitminor, which are important for researchers. In SUSENAS 2015-2016, there is a health item number, number 183, assigned to the heading of the medication sub-section. This item should not have any entry, but in 2015, it has non-negligible positive value that is not equal to the total expenditure of the various types of medication listed under this sub-section. Adding this item would inflate the total health expenditure in 2015, but perhaps for the wrong reason. There is also ambiguity in the question about the use of modern medicine. In particular, the questionnaire asks whether during the reference period, the household has consumed“any medicine with prescription from a health practitioner” (“obat yang dibeli dengan resep dari tenaga kesehatan”) and “any modern medicine without prescription from a health practitioner” (“obat modern yang dibeli tanpa resep dari tenaga kesehatan”). While the former question is clear, the latter may be interpreted as (i) a modern medicine that is bought based on a health practitioner’s advice but available over-the-counter and does not require a prescription (e.g., vitamin D supplement for patients with osteoporosis, medicines according a pharmacist’s advice, paracetamol, cough medicine, etc) or (ii) a modern medicine that is bought to self-medicate and the individual has never seen a health practitioner. This issue is relevant for researchers who want to calculate total health expenditure related to doctors’ visitations. If interpretation (ii) applies then the non-prescription medicines should not be included in the total health expenditure but if interpretation (i) applies then it should be part of the total health expenditure.
References
Akita, T. and Lukman, R.A., 1995. Interregional inequalities in Indonesia: a sectoral decomposition
analysis for 1975–92.Bulletin of Indonesian Economic Studies,31(2), pp.61-81.
Akita, T. and Miyata, S., 2008. Urbanization, educational expansion, and expenditure inequality in
Indonesia in 1996, 1999, and 2002.Journal of the Asia Pacific Economy,13(2), pp.147-167.
Akita, T., Lukman, R.A. and Yamada, Y., 1999. Inequality in the distribution of household expenditures
in Indonesia: A Theil decomposition analysis.The Developing Economies,37(2), pp.197-221.
Asra, A., 2000. Poverty and inequality in Indonesia: estimates, decomposition and key issues.Journal
of the Asia Pacific Economy,5(1-2), pp.91-111.
Bird, K. and Manning, C., 2008. Minimum wages and poverty in a developing country: Simulations
from Indonesia’s Household Survey.World Development,36(5), pp.916-933.
Cameron, L.A., 2000. Poverty and inequality in Java: examining the impact of the changing age,
educational and industrial structure.Journal of Development Economics,62(1), pp.149-180.
Comola, M. and De Mello, L., 2011. How does decentralized minimum wage setting affect employment
and informality? The case of Indonesia.Review of Income and Wealth,57(s1), pp.S79-S99.
Grimm, M., Sparrow, R. and Tasciotti, L., 2015. Does electrification spur the fertility transition?
Evidence from Indonesia.Demography,52(5), pp.1773-1796.
Kim, J., 2010. Women’s education and fertility: an analysis of the relationship between education and
birth spacing in Indonesia.Economic development and cultural change,58(4), pp.739-774.
Kruse, I., Pradhan, M. and Sparrow, R., 2012. Marginal benefit incidence of public health spending:
Evidence from Indonesian sub-national data.Journal of Health Economics,31(1), pp.147-157.
Levinsohn, J.A., Berry, S.T. and Friedman, J., 2003. Impacts of the Indonesian economic crisis. Price
changes and the poor. InManaging currency crises in emerging markets(pp. 393-428). University of
Chicago Press.
Nugraha, K. and Lewis, P., 2013. The impact of taxation on income distribution: Evidence from
Indonesia.The Singapore Economic Review,58(04), p.1350024.
Nugraha, K. and Lewis, P., 2013. Towards a better measure of income inequality in Indonesia.Bulletin
of Indonesian Economic Studies,49(1), pp.103-112.
Pasay, N.H.A., Handayani, D. and Setiawan, B., 2011. Sheepskin and Working Experience Effects on
pp.117-Pradhan, M. and Prescott, N., 2002. Social risk management options for medical care in
Indonesia.Health economics,11(5), pp.431-446.
Sidique http://www.business.uwa.edu.au/__data/assets/pdf_file/0009/2585205/14-22 -Fiscal-Decentralisation-and-Inequality-in-Indonesia-1999-2008.pdf
Sparrow, R., 2007. Protecting education for the poor in times of crisis: An evaluation of a scholarship
programme in Indonesia.Oxford Bulletin of Economics and Statistics,69(1), pp.99-122.
Sparrow, R., Poel, E.V., Hadiwidjaja, G., Yumna, A., Warda, N. and Suryahadi, A., 2014. Coping with
the economic consequences of ill health in Indonesia.Health economics,23(6), pp.719-728.
Sparrow, R., Suryahadi, A. and Widyanti, W., 2013. Social health insurance for the poor: Targeting and
impact of Indonesia's Askeskin programme.Social science & medicine,96, pp.264-271.
Sumarto, S., Suryadarma, D. and Suryahadi, A., 2007. Predicting consumption poverty using
non-consumption indicators: experiments using Indonesian data.Social Indicators Research,81(3),
pp.543-578.
Sumarto, S., Suryahadi, A. and Widyanti, W., 2005. Assessing the impact of Indonesian social safety
net programmes on household welfare and poverty dynamics.The European Journal of Development
Research,17(1), pp.155-177.
Sumarto, S., Suryahadi, A., Mawardi, S., Sulaksono, B., Devina, S., Artha, R.P., Dewi, R., Saputra, J., Rubianto, H., Udin, L. and Weatherley, K., 2007. The Effectiveness of the Raskin Program. Available http://documents.worldbank.org/curated/en/697641468044690933/pdf/456210ENGLISH010SMERU 1English1final.pdf
Suryadarma, D., 2012. How corruption diminishes the effectiveness of public spending on education in
Indonesia.Bulletin of Indonesian Economic Studies,48(1), pp.85-100.
Thomas, D., Beegle, K., Frankenberg, E., Sikoki, B., Strauss, J. and Teruel, G., 2004. Education in a
Crisis.Journal of Development economics,74(1), pp.53-85.
Van Doorslaer, E., O'Donnell, O., Rannan-Eliya, R.P., Somanathan, A., Adhikari, S.R., Akkazieva, B., Garg, C.C., Harbianto, D., Herrin, A.N., Huq, M.N. and Ibragimova, S., 2005. Paying out-of-pocket for
health care in Asia: Catastrophic and poverty impact.Erasmus University, Rotterdam and IPS,
Colombo.
Van Doorslaer, E., O'Donnell, O., Rannan-Eliya, R.P., Somanathan, A., Adhikari, S.R., Garg, C.C., Harbianto, D., Herrin, A.N., Huq, M.N., Ibragimova, S. and Karan, A., 2006. Effect of payments for
health care on poverty estimates in 11 countries in Asia: an analysis of household survey data.The
Waters, H., Saadah, F. and Pradhan, M., 2003. The impact of the 1997–98 East Asian economic crisis
on health and health care in Indonesia.Health policy and planning,18(2), pp.172-181.
TIM NASIONAL PERCEPATAN PENANGGULANGAN KEMISKINAN
Sekretariat Wakil Presiden Republik Indonesia Jl. Kebon Sirih No. 14, Jakarta Pusat 10110
Telepon : (021) 3912812
Faksimili : (021) 3912511
E-mail : info@tnp2k.go.id
Website : www.tnp2k.go.id