International Journal of Emerging Technologies in Computational
and Applied Sciences (IJETCAS)
www.iasir.net
Prediction of Harmonic Distortion in a Distribution System
Caused by Housing Loads
(Case Study in Surabaya, Indonesia)
Daniel Rohi, Dion Dwipayana Utomo, Ontoseno Penangsang
Electrical Engineering Departement, Faculty of Industrial Technology Petra Christian University Jl. Siwalankerto 121-131 Surabaya 60236, Indonesia
Abstract: This paper will discuss about impact of nonlinear load in residential costumer to harmonic distortion. Electricity consumer behaviour particularly in the household sector with the development of technology will evolve. Equipment used for everyday purposes continues to grow and has become a lifestyle. The modern life is becoming fabulous with the invention of new technology, so that many more electricity utilities are used by people and their houses in daily life. Nowadays, loads in the housing electricity utility do not only contain of linier loads, but also non-linier loads such as television, computer, microwave, fluorescent lamp and so on. The problem uses nonlinear load is create harmonic distortion. The harmonic distortion will reduce the life time of electrical equipment and inefficiency. The purpose of this research is to do modelling and prediction of harmonics level on housing electricity utility. The modelling and prediction of this research was using harmonic analysis with ETAP PowerStation version 4.0.0 C. This experiment was done in five houses as sample. The measurement was done on non-linier load and Kwh-meter in every house using Fluke 41B. The result of measurement on Kwh-meter on houses was compared in order to get the analysis result for VTHD, ITHD, power factor and frequency. The results research showed that VTHD, power factor (PF) and frequency on house are comply to the normal standard. VTHD result (maximum 5%) is 1.1 % – 3.6%. Beside those, ITHD on house also comformable to due standard, but there are houses that did not comply into the appointed standard. The analysis result showed that energy saving lamp cause the biggest harmonics level. The level of harmonics in every house depends on how many electricity equipment used in it.
Keywords: Power Quality, Harmonics, Housing Electricity Utility.
I. Introduction
Power quality is a major concern in the world of electricity in this decade. It is the electrical power used by consumers and not damage or reduce the life time of the equipment and the power can be used efficiently [1][2]. Power quality means the quality of voltage and current. Quality the voltage and currents is the value what used does not exceed limits of tolerance from equipment that used. In addition, a wave of currents and voltages are sinusoidal waves are normal. One of the problems that resulted in the current and voltage waveforms will not be sinusoidal or defect is caused by the resulting harmonics in the power system. Terms of quality power to a building and housing is power and voltage shall be in accordance with specified standards and Harmonics harmonic currents and voltages that occur must be small.
Harmonics is a phenomenon arising from the operation of the electrical load that is mainly caused from the non-linear load, which will form a high-frequency waves (100 Hz, 150 Hz, 200 Hz and so on) and can interfere with the electrical power system fundamental frequency is 50 Hz or 60 Hz, so that the current and voltage waveforms are purely sinusoidal ideally would be disabled as a result of harmonic distortion that occurs. The ideal form of the provision of electric power systems both voltage and current must be contained on a single frequency sinusoidal and constant value that is 50 Hz. In the power system voltage and current harmonics always contain, because the harmonics have a frequency which is an integer multiple of the fundamental wave component [3].
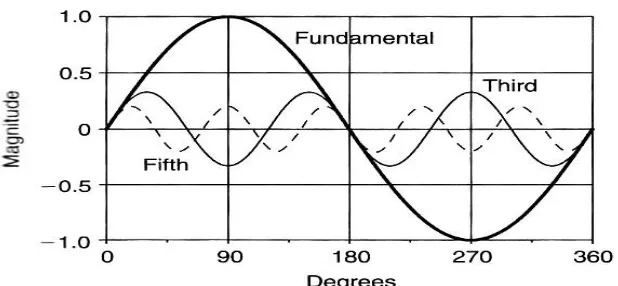
Figure 1 Fundamental and Sinusoidal Signal Distorted
Fundamental frequency (first harmonic) is f, the harmonics have frequencies 2f second, third harmonics have frequencies 3f and n-th harmonic has a frequency nf. If the fundamental frequency is 50 Hz, the second harmonic has a frequency of 100 Hz, the third harmonic has a frequency of 150 Hz, and so on.
Harmonic distortion can be understood through some major parameters. The important parameters to describe the effects of harmonics on power system components. The first parameter is the THD (Total Harmonic Distortion) Total harmonic distortion is the ratio of the rms value of the harmonic components to the rms value of the fundamental component is usually expressed in percent (%). The index is used to measure the deviation of a periodic waveform containing harmonics from a perfect sine wave [4]. For a perfect sine wave THD is zero percent. Here is the formula for the voltage and current THD, namely:
1
Where: Vn = Rated voltage harmonics, V1 = Fundamental value and n = maximum harmonic component is
observed
The second parameter is the IHD (Individual Harmonic Distortion). Individual harmonic distortion is the ratio of the rms value of the individual harmonics to the rms value of the fundamental [3]. The third parameter is TDD (Total Demand Distortion) Total demand distortion (TDD) are total harmonic current distortion is defined as:
R
Where : IR = the maximum demand load current (selama15 or 30 minutes) on the basis of the frequency of
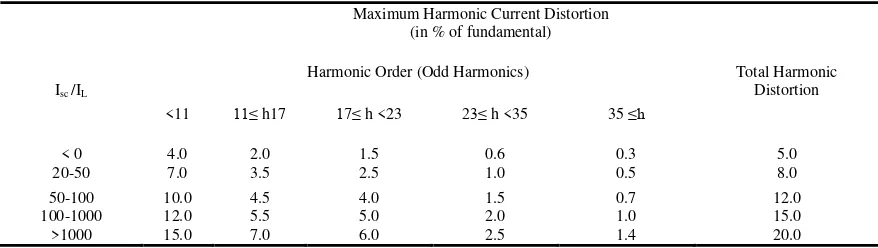
Table 1 Standard of Maximum Harmonic Current Distortion
Maximum Harmonic Current Distortion (in % of fundamental)
Isc /IL
Harmonic Order (Odd Harmonics) Total Harmonic Distortion
Percentage of the amount of harmonic current distortion (% ITHD) is the percentage of the total amount of
current is distorted by harmonics of the fundamental frequency. To determine (% ITHD) is depending on the ratio
of Isc / IL. Percentage of the number of harmonic voltage distortion (% VTHD) is the percentage of the total
voltage is distorted by harmonics of the fundamental frequency. % VTHD system is determined by the voltage
used. Detailed information on the standard harmonic current and voltage allowed is as shown in table 1 and table 2 [6].
Electrical load which is the source of harmonics can be grouped into two kinds, namely [7]: First Load linear, linear load is a load that gives a linear output waveform means the current flowing is proportional to the impedance and voltage changes. Non-linear load waveform output is not proportional to the voltage in each half cycle so that the current waveform and output voltage waveform is not the same as the input (distorted).
Table 2 Standard of Maximum Harmonic Voltage Distortion
Maximum Distortion semiconductor component in which the process works act as a switch that works on every cycle of the source voltage waveform. In addition, the harmonics are also often caused by equipment especially equipment that uses a rectifier diode and thyristor rectifier. Function of the rectifier is to convert alternating current into direct current. In the use of the converter as a direct resource to take a loss on the destructive power grid voltage waveform and alternating current so it is not a pure sinusoidal wave.
The main effect of voltage and current harmonics on power systems, namely: Addition of harmonics due to the level of the series and parallel resonant relationship and decrease the efficiency of power generators, transmission and load equipment. Broadly speaking, the effects of harmonics that arise in the power system depends on the location of the source harmonics and harmonics. In addition to the harmonics of the power system can cause undesirable effects such as equipment becomes heat, equipment not working properly, the life time of the equipment is reduced, equipment damage, signal interference or noise on the phone line. This is because the series is zero, the resonance between the capacitance and the transformer reactance resulting in excessive voltage and current. Economic and environmental losses caused by harmonic distortion is very serious, it becomes imperative to conduct routine of monitoring and evaluation of the distribution system and the identification of load used by electricity consumers [2]. Consumer household sector is one segment of consumers who use non-linear devices in large numbers. This research was conducted with the aim to identify the use of non-linear load in the household sector and its impact on the increase of harmonic distortion. This study is used five samples of household with loads 2200 VA < loads ≤ 6600 VA.
II. MATERIAL AND METHODS
Figure 2 Measurement Scheme for Load one Phase
Evaluation and calculation in this study uses of the IEEE 519-1992 standard. Current THD is evaluated by first calculating the value of the comparison between the ISC with IL. From the comparison of these
values can be evaluated from the value of THD that has been obtained from the measurement exceeds the standard or not. Short circuit current (ISC) is obtained by determining the upper side of the point as a benchmark,
the position where the short circuit current will be calculated. The first count is a short circuit in the transformer, which is connected to each Kwh-meter house. While the value of IL is the rms value of current generated from
measurement.
III. RESULT AND DISCUSSION
The value obtained from the ISC / IL will be compared with the standard current THD. One was selected as an
example for the calculation of current THD. The data is used to calculate are the length of cable from the transformer to the power pole closest to the 180 m with a cable cross-sectional area of 35 mm2. According to the data obtained cable short circuit current (ISC) of 1.6 kA. Cable length from power lines to Kwh-meter house with
a 15 m cross-sectional area of 6 mm2. Base on the data obtained short-circuit current (ISC) 1.1 kA.
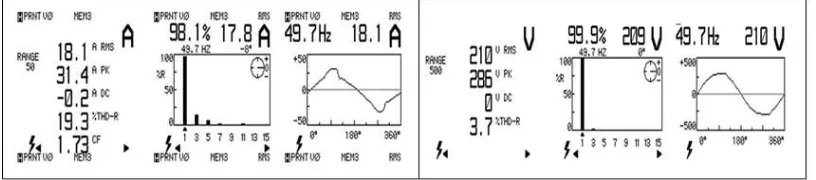
Figure 3 Spectrum of harmonic distortions
Calculation ISC / IL and ITHD by looking at the results of measurements obtained results are as follows: 1st Harmonic (fundamental rms current) is 99.26%., 3rd Harmonics is 6.92%, ie 5th Harmonics 5, 63%., Harmonics 7th namely 4.9%, 9th Harmonics, namely 2.98%, Harmonics 11th is 2.11% and Harmonic to-31 is 0.14%. ISC calculation results obtained at 6:08 kA and measurement results obtained from the value of IL = 13.65 A. From
the above calculation THD current is generated that is equal to 10.967% and these results do not exceed the prescribed standards. More an calculations measurement results contained in Table 3. This condition shows that 20% of houses do not meet standard evaluated from the aspect ITDH. The results of calculations and measurements for house IV are very small difference that is 0.3. So there is a specific between calculations and measurements. Differences between the measurements and standards reached 52.5%. The use of non-linear devices in the home will increase the electric current harmonic distortion wave, when connected to the distribution system [8] The Calculations for VTDH is used of standard IEEE 519-1992. In calculating the value of
not. Obtained from the calculation of the resulting voltage THD is equal to 2.86% and the result does not exceed the predetermined voltage standards.
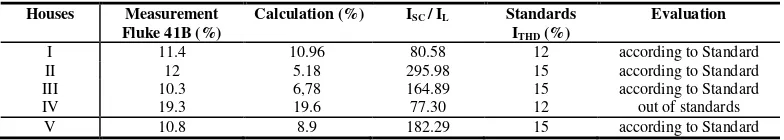
Table 4 Evaluation of Total Harmonic Distortion of Current (ITHD )
Houses Measurement
Other electrical parameters were measured as in Table 6. Measurement result shows that the power factor (PF) has been produced in accordance with the standards set by the standard Indonesia Electric Company PLN (0.85 minimum). The resulting frequencies are also in accordance with the standard 49.8 to 50 Hz. These data prove that, distortion harmonics can be seen from the electrical parameters. If the electrical parameters have been determined to meet the standards, means harmonics in conditions that are safe or in accordance with established standards.
Table 6 Evaluation of Electric Paremeter
Electric Parameter Houses Eveluations I II III IV V
Frekuensi (49,5-50,5) 49.8-50 50 49.8-50 49.8-50 49.7-50 According to standard Power 3080-3780 2800-3300 1830-2500 3400-3700 1290-1500 N/A Vrms (198-231) 389-391 210-217 225-226 210 199-201 According to standard
Irms 4.73-5.59 13.6-16.6 8.49-11.20 16,5-18,1 6.66-7.68 N/A PF (min 0.85) 0.95-0.96 0.95-0.96 0.95-0.99 0.97-0.98 0.97-0.98 According to standard
IV. CONCLUSION
The results of the simulation, calculation and measurement showed that VTHD range at 1.1% - 3.6%
already meet the IEEE standard is 5% and showed results ranging ITHD-10.3% -19.3%. At ITHD there are 20% of
households that do not meet the standards. Between simulation, calculation and measurement is not a significant difference. Energy-efficient lighting is one of the electronic devices that pose the greatest harmonic on residential electric utility compared with other electronic equipment and the amount of harmonics that may arise depending on the electronics used. If more and more electronic equipment, the greater the harmonics produced in the home.
References
[1]. Dugan, Roger.C and McGranaghan, Mark.F. Electrical Power Systems Quality. New York: McGraw-Hill. 2003.
[2]. Schipman , Kurt, at all, The Importance Of Go Od Power Quality Abb Power Quality Products, Belgium http://www05.abb.com/global
/power quality improvement with lv capacitors and filters.pdf [3]. Sankaran, C. Power Quality. Florida: CRC Press LLC, 2002.
[4]. Arrilaga, Jos and Watson, Neville. Power System Harmonics. Chicester: John Walley and Sons, 2003. [5]. Manual Book Power Harmonics Analyzer Fluke 41B. New York: Fluke Corporation, July 1995.
[6]. Mohan, Ned. Power Electronics: Converter, Application and Design. New York : John Wiley & Sons. 1994, p.412. [7]. Tribuana, at all, The impact of Harmonic Distortion to Distribution Transformer, 1999
http://www.elektroindonesia.com/elektro/ener25.html