IN
2002
JOHNBURGESS*, WILLIAMMITCHELL** ANDALISONPRESTON***
T
he Australian labour market continues to demonstrate resilience in the face of weaknesses in the international economy and domestic economy. The US economy remains in the doldrums and Japan still remains in recession. Locally, a severe drought has wiped at least one per cent off projected GDP growth. Yet, for the 10th successive year, jobs growth remains strong in Australia. Despite this record, employers and the Federal government continue to call for further reforms in order to ‘free’ up the labour market. With the profits share of Gross Domestic Product (GDP) at historic highs and trade union density at historic lows, the arguments are distinctly hollow. Indeed, there remains a considerable unfinished reform agenda for the Australian labour market. A decade of strong jobs growth has made only modest inroads into labour under-utilisation, it has seen unfettered working time developments, and important issues remain of equality and access to entitlements that confront many women workers.INTRODUCTION
What features stand out about Australia’s labour market development over the past decade? If we were asked to identify the key characteristics they would be: • strong and sustained jobs growth, particularly in part-time jobs;
• stickiness of the unemployment rate; • feminisation of employment;
• growth in contingent or flexible employment arrangements; • fragmentation of working hours;
• rising wage inequality;
• expansion of superannuation coverage arrangements; and
• inexorable expansion in the numbers and share of service sector jobs. The above has been accompanied by a parallel shift in government attitude and approach to labour market regulation. Key developments include:
• decentralisation of bargaining over wage and employment conditions (Campbell et al.2001);
• growth in bargaining arrangements that do not involve trade union partici-pation or imprimatur (Bray et al.2001);
• establishment of the privatised jobs network (Biddle & Burgess 2002); and • introduction of US workfare arrangements associated with unemployment
benefit support (Burgess et al.2000).
While there is considerable debate surrounding the consequences of the above developments, recent (and current) reviews in this journal and elsewhere suggest that identified outcomes include the following:
• polarisation of earnings (Borland 1999);
• shifting functional distribution of income towards profits (Carlson et al.2003); • decline in industrial action (ABS Cat. no. 6321.0);
• long-term decline and stabilisation of the full-time gender wage gap while the part-time gender wage gap widens (Whitehouse 2001; Preston 2002); • emergence of working poverty through either insufficient working hours or
very low hourly wage rates (ACIRRT 1999);
• emergence of workers who are employed under ambiguous employment arrangements (for example, see the temp industry; Hall 2000); and
• increasing tensions in the balancing of work and family responsibilities (Bittman & Rice 2002).
It is apparent from the above that there are many indicators one might apply in reviewing developments in the Australian labour market. This review will examine jobs, unemployment, working hours, home-work, job creation/ destruction and developments concerning women. A decade of jobs growth and an accompanying neo-liberal policy regime has delivered in some areas, such as employment growth (especially part-time jobs) but has been equivocal or even regressive in other areas such as working hours, and unemployment. While acknowledging that wage determination is a critical component of any labour market, such a discussion is not included within this article. Interested readers are referred to the wage review reported elsewhere in this journal.
ECONOMIC CONTEXT
In 2002, the Australian economy seemed to largely withstand the international slowdown. Over the 1990s, the economic recovery in Australia has been touted as a sign that the economy is robust and more able to withstand world economic fluctuations. Treasurer Costello (2000), said ‘The benefits of labour and product market reforms are evident in Australia’s economic performance through the global economic downturn of 2001’. In 2002, a new word entered the economic commentators’ lexicon. Prime Minister Howard said in April that ‘. . . the economy is going gangbusters . . . I think the economy is per for ming beautifully . . . The hum of the machine of the Australian economy is a delight to the ear’ (quoted in Sydney Morning Herald, 12 April 2002). The terminology caught on, with an Access Economics economist saying that the ‘Australian economy [is] going absolutely gangbusters . . .’ (ABC AM transcript, 9 May 2002).
The reality is that growth in the Gross Domestic Product (GDP) over the 1990s was driven largely by private spending, particularly after 1995. Strong growth in credit-financed household consumption expenditure has replaced the decline of net government spending since 1996. There is an ugly story yet to be told about this growth strategy. The balance sheets of households are now very fragile and the spending growth cannot be sustained (Mitchell & Reedman 2002).
to the government abandoning its pursuit of surpluses in 2001 for electoral reasons. Two major (temporary) policy shifts revitalised private spending which was waning in the June quarter:
(a) six interest cuts after February 2001; and
(b) the Federal Government, facing electoral defeat, injected over $2 billion into an ailing construction industry, principally through the first home buyers scheme, after recognising the GST had devastated home building; and increased defence spending after East Timor and September 11.
Put together, the economy received an old-fashioned Keynesian boost to say the least! Yet there is little recognition of the central role that the return to public deficit (2001–2002) has played in promoting Australia’s quick return to growth.
However, the labour market is hardly going ‘gangbusters’. Despite one of the stronger growth rates in the 1990s among Organisation for Economic Cooperation and Development (OECD) economies, the Australian economy did not remotely approach full employment and the unemployment trend remains positive. The low point unemployment has steadily ratcheted upwards over successive cycles—4.6 per cent in June 1976; 5.5 per cent in June 1981; 5.6 per cent in November 1989 and 6 percent in September 2000 (see Mitchell 2001b). Mitchell and Carlson (2002) show that while the official unemployment rate averaged 8.2 per cent between December 1991 and November 2002, the average total labour wastage is around 15.4 per cent once hidden unemployment and underemployment estimates are included. Economic growth has not been strong enough to produce enough jobs and hours of work to meet the preferences of the labour force over a sustained period. One might argue that labour market flows are such that few workers remain unemployed for very long. However, available statistics suggest other wise. In 1966, the average duration of unemployment was three weeks, by 2002 it had risen to 52 weeks (Mitchell & Muysken 2002a).
LABOUR MARKET2002
In 2002, following the slowdown in 2001, the labour market showed improve-ment in the major aggregates (see Table 1). Full-time employimprove-ment largely recovered the losses made in the previous year and the total increase in employ-ment was some 39 000 in excess of the increase in the labour force, with the result that the unemployment rate fell by 0.5 percentage points.
However, by year’s end the picture was looking decidedly shaky. The Department of Employment and Workplace Relations job vacancies series dipped sharply (by 22 per cent) in December 2002 although its Skilled Vacancy survey showed a more modest decline of 0.1 per cent in its index (DEWR 2002). The monthly survey of job advertisements published by the ANZ (2003) also revealed that a slowdown in employment growth was occurring with its advertised vacancies series falling by around a half in December (13.7 per cent in seasonally adjusted terms). The ANZ (2003: 2–3) conclude that:
T
HE
J
OURNAL
OF
I
NDUSTRIAL
R
ELA
TIONS
June
2003
Changes EFT EPT E U LF CIVPOP UR LFPR
(000’s) (000’s) (000’s) (000’s) (000’s) (000’s) (% pts) (% pts)
Since 1993 797.7 833.8 1631.5 -309.6 1321.9 1855.8 -4.6 1.0 2000–2001 -25.7 131.7 106.0 30.3 136.3 201.3 0.2 0.0 2001–2002 30.1 131.6 161.7 -39.1 122.7 209.8 -0.5 -0.1
Source: ABS AusStats, Supercube C1. Changes are based on the average year to year value. The 2002 average is computed up until November.
CIVPOP, civilian population; E, total employment; EFT, full-time employment; EPT, part-time employment; LF, labour force; LFPR, labour force participation rate. U, total unemployment; UR, national unemployment rate.
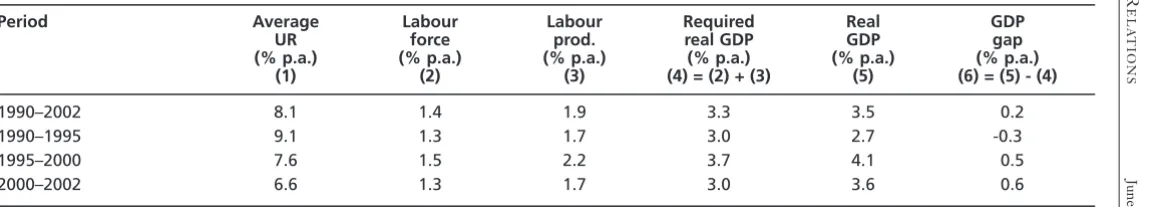
Table 2 Average unemployment rate and average annual growth rates in output, productivity and labour force
Period Average Labour Labour Required Real GDP
UR force prod. real GDP GDP gap
(% p.a.) (% p.a.) (% p.a.) (% p.a.) (% p.a.) (% p.a.)
(1) (2) (3) (4) = (2) + (3) (5) (6) = (5) - (4)
1990–2002 8.1 1.4 1.9 3.3 3.5 0.2
1990–1995 9.1 1.3 1.7 3.0 2.7 -0.3
1995–2000 7.6 1.5 2.2 3.7 4.1 0.5
2000–2002 6.6 1.3 1.7 3.0 3.6 0.6
. . . to a significant slowing in employment growth during the first few months of 2003 . . .
Given the high (inverse) correspondence between movements in the ANZ vacancy series and the unemployment rate, we expect an upward movement in unemployment over the first six months of 2003. This is also suggested if we examine the Okun arithmetic for Australia.
In Table 2, growth rates in real output, labour productivity (GDP divided by total employment) and the labour force are shown for various periods since 1990. Okun’s Law is a useful rule-of-thumb which helps us understand changes in unem-ployment rates and project future trends. It is based on a relation between the major output and labour-force aggregates expressed as growth rates (see Mitchell 2001a). The rule of thumb that emerges says that for the unemployment rate to remain constant, real output (GDP) growth must equal the rate of growth in the labour-force plus the growth rate in labour productivity (GDP/total employment). The Okun calculations are shown in the last two columns in Table 2. Column (4) is the ‘required rate of GDP growth’ (for the unemployment rate to remain constant). At this rate, employment growth is just enough to absorb the new labour force entrants and those displaced by productivity growth. Column (6) calculates the extent to which the real GDP growth rate has been sufficient to reduce the unemployment rate (with rounding errors). A positive sign indicates that growth is above the required rate and eating into the unemployment pool.
Over the first half of the 1990s, unemployment rose because GDP growth fell short of the required rate by approximately 0.3 per cent per annum. The latter half of the 1990s reversed this situation and inroads into the unemployment rate were made with labour productivity bonuses also evident in the rising tide. In the last two years there has been a slowdown in real output growth but the potential for rising unemployment has been avoided, up until now, by the slower labour force and labour productivity growth.
This analysis reinforces the suggestion that the unemployment outlook for 2003 is not bright given that the Commonwealth Treasury has in the 2002–2003 mid-year economic and Fiscal Outlook revised its forecast for output growth down to 3 per cent over 2002–2003 (Costello 2002). They also predict employment to grow at 1.25 per cent that means that with the labour force growing at 1.3 per cent a slight rise in the unemployment rate is to be expected in 2003.
LABOUR UNDER-UTILISATION
reasons or part-time workers who prefer to work longer hours but are constrained by the demand-side. Sub-optimal employment can also arise from ‘inadequate employment situations’ (ABS 2001a: 55) where skills are wasted, income opportunities denied and/or where workers are forced to work longer than they desire (see Mitchell & Carlson 2002 for a detailed discussion of these categories).
The official unemployment rate fell by around 0.5 percentage points (season-ally adjusted) in the year to November 2002, which signalled continuing growth in the Australian economy. But is the official unemployment rate an accurate measure of the extent to which labour under-utilisation exists? Underlying the month-to-month movements in the official rate is the observation that the low point unemployment rate in Australia has ratcheted upwards over successive cycles in Australia since 1975. Mitchell and Carlson (2001) argue that the labour wastage evident in the upward trending unemployment rate is even worse when broader measures of labour under-utilisation are considered. In terms of measuring the extent of the problem, Mitchell and Carlson (2001: 60) claim that using hours instead of persons provides ‘an even more sophisticated and, arguably more precise, measure of labour under-utilisation’. The two hours-based measures, which are part of the CofFEE Labour Market Indicators (CLMI), published by the Centre of Full Employment and Equity (CofFEE), explicitly
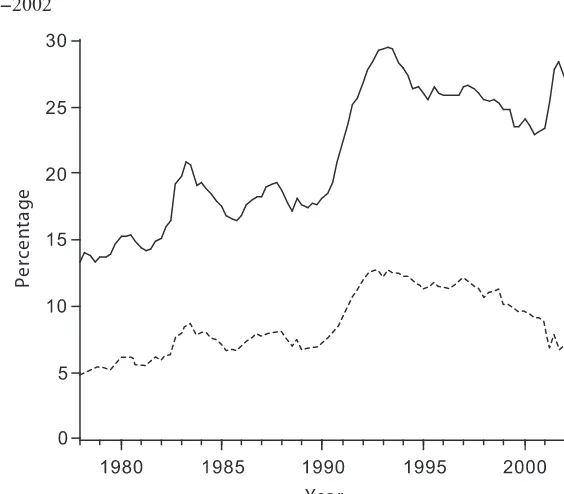
Source: ABS AusStats, E2 Supercube.
Notes:(—) More hours, percentage total part-time; (- - -) full time hours, percentage total part-time.
Percentage
Year
Figure 1. Preferences of part-time workers for more hours of work, Australia,
estimate the degree of under-utilisation among the unemployed, hidden unemployed and part-time workers who desire more hours of work. They also provide a measure of underemployment (these were also explained in Burgess & Mitchell 2000).
While the labour market continues to produce strong growth in part-time employment there is also an increasing proportion of part-time workers who desire more hours of work. In Figure 1., two series are plotted reflecting the preferences for more hours of work expressed by part-time employees to May 2002. The solid line (More Hours % Total PT) is the number of workers who want more hours of work as a percentage of total part-time employees whereas the dotted line (FT Hours % Total PT) decomposes this group into those who want full-time work only as a percentage of total part-time employees. Other data (not shown) reveal that the distribution of preferences for more work among the hours-bands (1–15, 16–29, 30–34) published by the ABS has been relatively constant.
So, while the proportion of part-time workers who want full-time work has declined in recent years (but is still above the levels existing at the end of the last strong employment growth phase in 1989), there is an increasing overall trend in part-time workers who are being forced into working less hours than they desire. This data is used by the CofFEE to construct its hours-based measures of underemployment. It is interesting that the ABS has signalled that it will publish more detailed underemployment measures in 2003 as part of their revamping of labour statistics (ABS Catalogue no. 6297.0).
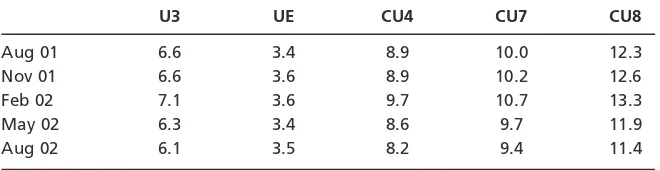
In Table 3, the CofFEE measures are compared to the official unemployment rate (U3) from August 2001 to August 2002. The CofFEE indicators are labelled CU4, CU7 and CU8. CU4 adds an estimate of working hours lost due to hidden unemployment to U3. CU7 adds and estimate of working hours lost due to underemployment to U3. It is the ratio of unutilised hours of work available to the total available (fully-utilised) labour force in hours. CU8 extends CU7 by
Table 3 Official unemployment rate and CofFEE Labour Market Indicators (CLMI)
hours-based indicators
U3 UE CU4 CU7 CU8
Aug 01 6.6 3.4 8.9 10.0 12.3 Nov 01 6.6 3.6 8.9 10.2 12.6 Feb 02 7.1 3.6 9.7 10.7 13.3 May 02 6.3 3.4 8.6 9.7 11.9 Aug 02 6.1 3.5 8.2 9.4 11.4
including the hours aspirations of the hidden unemployed (for full details and derivation for CU7 see Mitchell & Carlson 2001; for CU8 see Mitchell, 2001; http://e1.newcastle.edu.au/coffee/indicators/indicators.cfm). It is thus UE + CU7 (note rounding errors), CU7 and CU8 distinguish between full-time and part-time employment, and take into account the fact that a substantial number of part-time workers (and in CU8 the hidden unemployed) are frustrated by their failure to gain full-time work or more part-time hours. CU8, the hours-based measure augmented by estimates of hidden unemployment is the most comprehensive measure of under-utilisation and underemployment. UE is the measure of underemployment derived from CU7.
Both of the hours-adjusted under-utilisation rates (CU7 and CU8) are substantially higher than the official rate indicating that the extent of under-utilisation (and underemployment) is large. While there have been small reductions in the unemployment rate since August 2001, underemployment remains static.
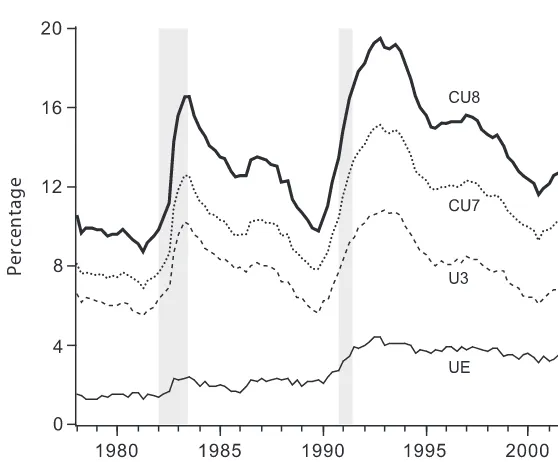
A longer view of the movement in the indicators against the official unemploy-ment rate can be obtained from Figure 2. There is evidence of an increasing overall trend in under-utilisation. The low point unemployment rate has risen over the cycles shown. The gap between U3 and CU7 has also risen since 1980,
Sources: ABS The Labour Force, Australia, Cat. no. 6203.0; CofFEE estimates. The 2002 estimate is the average for January to August 2002. The shading shows the peak to trough in the 1980s and 1990s recessions.
Percentage
Year
Figure 2. Official unemployment rate and CofFEE under-utilisation measures,
which indicates that a proportion of jobs created have been part-time but with less than desired hours on offer. The frustration of workers with less than desired hours of work available is latent in the hidden unemployed as well. The gap between CU7 and CU8 reflects the magnitude of hidden unemployment and the hours-aspirations of the hidden unemployed. The under-utilisation arising from cyclical sensitive participation effects is pronounced with the gap between the measures at its maximum during recession (3.6 percentage points in 1982 and 4.4 percentage points in 1992). The gap narrows as the economy achieves higher levels of activity (2.1 percentage points at the 1989 cycle peak and 2.3 percentage points in 2000). In the August quarter 2002, the inclusion of hidden unemployment (counted in hours) adds 2.0 percentage points to U3. It has narrowed marginally since the recession in the early 1990s, which suggests that there are fewer persons classified as being not in the labour force that desire and are willing to work.
UNEMPLOYMENT DURATION
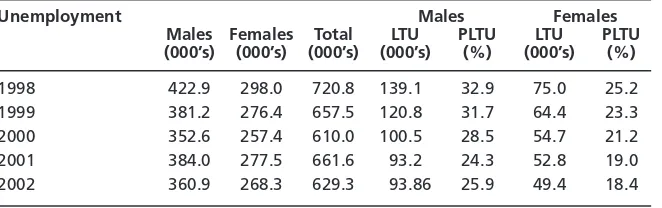
Over 2002, unemployment fell by around 50 000, with males dominating this decline. The proportion of workers that were long-term unemployed (spells above 52 weeks remained relatively constant edging up slightly for males (see Table 4). The average duration of unemployment overall, which was three weeks in 1966, is now 52 weeks and is inversely related to the vacancy rate (see Mitchell & Carlson 2001). It is not often noted that duration for short-term unemployed workers is around 14 weeks (and steady over 2002), while for the long-term unemployment averaged 169 weeks through 2002 (see AUSSTAS Supercube U)!
JOB CREATION AND DESTRUCTION
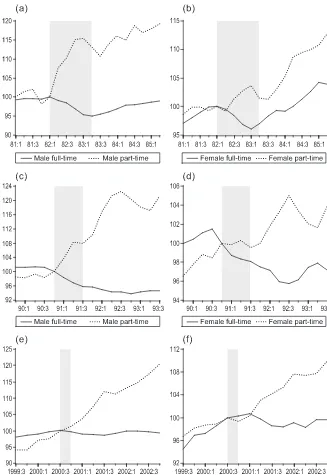
In Figure 3, the response of full-time and part-time employment for males and females is shown for each of the last three business cycle peaks. The plots begin four-quarters before the peaks in GDP activity (see Mitchell 2001a for a discussion of the timing) then trace the behaviour from peak to trough and then eight-quarters following the trough. The GDP peaks are identified as 1982: 3, 1991: 4 and 2000: 3 and the shaded areas indicate the period between peak and
Table 4 Unemployment and duration by gender in Australia
Unemployment Males Females
Males Females Total LTU PLTU LTU PLTU
(000’s) (000’s) (000’s) (000’s) (%) (000’s) (%)
1998 422.9 298.0 720.8 139.10 32.9 75.0 25.2 1999 381.2 276.4 657.5 120.80 31.7 64.4 23.3 2000 352.6 257.4 610.0 100.50 28.5 54.7 21.2 2001 384.0 277.5 661.6 93.20 24.3 52.8 19.0 2002 360.9 268.3 629.3 93.86 25.9 49.4 18.4
Source:ABS AusStats, Labour Force Cat. no. 6203.0, Table 22.
Source: AusStats.
Figure 3. Full-time and part-time employment creation and destruction.
trough in each of the cycles. The employment series are converted into index numbers with the base = 100 coinciding with the peak GDP quarter. The charts thus allow us to examine the behaviour of each series on a comparable basis over the downturn and subsequent early recovery.
Several points are relevant which reflect on the way in which the Australian labour market operates. First, during recessions there is a switch from full-time work to part-time work for both males and females resulting in a greater propor-tion of workers in short-durapropor-tion jobs. This is especially the case for males. In the period immediately prior to each of the three peaks the ratio is relatively stable for males and females. During the recession and subsequent recovery period the ratio rises rapidly before stabilising at the higher level with the underlying trend towards increased part-time work then reasserting itself.
Second, full-time employment declines almost lockstep with the turn in GDP and many quarters elapse before a weak recovery begins. Part-time work, how-ever, continues to increase as GDP moves from the peak and trough, eventually also succumbing to the demand deficiency. In the recovery phase after the trough, the economy initially generates strong growth in part-time work.
Third, some economists argue that recessions are associated with ‘cleaning up’ or in other terminology as ‘taking a pitstop’ (see Perry 1990). The ‘pitstop’ model of recession suggests that managers take time during recessions to streamline their processes. However, Perry (1990) notes that declining productivity during a recession is contrary to this view. Employment also recovers very slowly following the trough as noted in our discussion of persistence and asymmetry. Perry (1990: 153) says that:
If the amount of job creation and destruction is relatively constant in the temporary jobs, then the destruction is taking place in the long-duration jobs. This view provides a harsher picture of what happens during a recession than one would get if the change in job composition were ignored.
What this suggests is that for 2003, further part-time job growth is expected but with a weakness and even decline in full-time jobs along with an increase in the unemployment rate.
POLARISED AND UNREGULATED WORKING HOURS
award simplification have seen the erosion of penalty rates for long and unsociable hours while unpaid overtime hours are on the increase (Campbell 2002). The bargaining system has also seen the emergence of 12-hour working shifts in some industries (Nelson & Holland 2001).
Cully and Ngo (2001) suggest that there is probably more adjustment in the labour market occurring through hours adjustment rather than through person adjustments. That is, employers respond to changes in the demand for labour through some variation in working hours and working arrangements—shift patterns, spread of hours, casuals, part-timers, and extended and reduced hours. The long-term evidence suggests that there is more going on in hours than there is with employment. For 2000–2001 Cully and Ngo (2001) suggested that the weakness in labour demand was being translated into more part-time workers and shorter average hours, rather than fewer workers overall. What has happened with the spread of hours over the past year?
There has been no major shift in the distribution of hours or in aggregate and average hours worked over the past year. Around 17 per cent of workers have less than 15 hours per week while around 30 per cent of workers have more than
Table 5 Distribution of weekly hours worked between November 2001 and
November 2002
Hours Male Female Total
2001 2002 2001 2002 2001 2002
0 4.5 4.4 5.7 5.6 5.0 5.0 1–15 6.9 6.9 18.3 18.7 12.3 12.2 16–29 9.0 9.6 21.2 21.5 14.4 14.9 30–34 7.4 7.1 10.5 10.8 8.8 8.8 35–39 13.7 13.6 14.6 15.0 14.1 14.3 40 15.6 16.2 11.1 10.8 13.6 13.8 41–44 5.2 5.4 4.1 3.9 4.7 4.7 45–48 10.3 9.8 5.1 4.9 8.0 7.6 49+ 27.2 26.8 8.6 8.7 19.0 18.8
Source: ABS, The Labour Force, Cat. no. 6203.0.
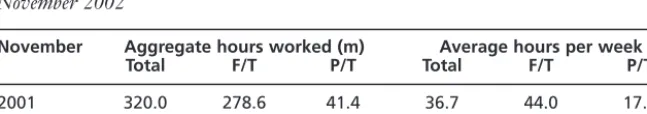
Table 6 Average and aggregate hours worked between November 2001 and
November 2002
November Aggregate hours worked (m) Average hours per week
Total F/T P/T Total F/T P/T
2001 320.0 278.6 41.4 36.7 44.0 17.3 2002 327.7 283.4 44.3 36.6 44.1 17.6
40 hours per week. For male workers, there are 40 per cent who work more than 40 hours per week. Around one quarter of women workers have less than 15 hours per week. The increase in aggregate hours worked tracked the increase in employment. It is interesting to observe that part-time hours account for around 13 per cent of all hours worked but about 26 per cent of total employ-ment. On average, part-time hours are about 40 per cent of full-time hours.
There still remains around one-quarter of all part-time workers who require additional hours of employment. Overall, job growth has neither been associ-ated with changes in the distribution of working hours, nor has it resulted in a growing share of part-time workers being able to obtain preferred hours of employment. This last finding is interesting and indicates that job expansion is not being translated into under-employed part-time workers acquiring additional hours of employment. In addition, there are reports (Crichton & Delaney 2002) that around one-half of full-time workers are performing unpaid over-time hours. It seems that many workers at either end of the hours distribution cannot match desired and actual working hours.
The transformation in working hours raises three issues. First, it highlights that Australia has no or few regulations over working hours, and indeed the experi-ence of the last decade is what you would expect with ‘unregulated’ working hours. In this context, it is not surprising that the ACTU has moved towards activating codes for the regulation of long working hours (ACTU 2002). Second, the extent of intertemporal flexibility in working hours arrangements is one component of enhanced labour use flexibility for employers that also includes greater use of part-time workers, casual workers, temporary agency and contract workers. It is not only that standard employment arrangements are disappearing it is also a story of the disappearing ‘standard’ working day and the standard working week (Bittman & Rice 2002). From Table 5, it can be observed that less than 30 per cent of workers have ‘standard’ working hours of between 35 and 40 hours. Third, these developments have to be placed alongside the rhetoric associated with family friendly employment arrangements where intertemporal flexibility is equated with being responsive to the family caring needs of workers (mainly women). As Bittman and Rice (2002) clearly demonstrate, there is greater pressure on working families and working women, not less pressure.
SPATIAL EMPLOYMENT FLEXIBILITY: HOME-WORKING AND TELECOMMUTING
distinction being a matter of convention. The ambiguity of home-work, and indeed of the production boundaries differentiating formal and informal work, has been emphasised by the shift of production from the home to market sector: take-away food; restaurants; childcare; gardening; and professional cleaning. Indeed, there have been very large shifts in activity across the sectors through the privatisation of public sector activities and through the contractualisation of the not-for-profit sector to undertake activities in health, education, aged care and employment services from both the private and public sectors. Since many small business operations are based at home, there is often ambiguity surrounding the participation of family members in home based businesses.
What is the home? This, in itself, is ambiguous. Is there a separation between the home and work in the case of a family-run farm? Is there a separation between home and work where the business and the home share the same premises, e.g. retailing downstairs and living accommodation upstairs. These issues are compounded by IT and communications developments where the home can become a business base for production and business away from the home. Developments in IT have opened the possibilities for extending the range of activities and occupations that can engage in home based employment. These range from clerical services through to professional services such as architecture and the law. This has given rise to the phenomenon of telecommuting—maintaining electronic contact with an external workplace but locating employment within the home.
Since the mid-1980s, the Australian Bureau of Statistics (ABS) has conducted an irregular supplementary home-working survey to the monthly labour force survey. Home-working surveys were conducted by the ABS (Catalogue no. 6275.0) for 1989, 1992, and 1995. The ABS published a survey for 2000. This is now entitled Locations of Workand differs from earlier surveys in that it includes farmers, multiple job holders and those who worked at another person’s home.
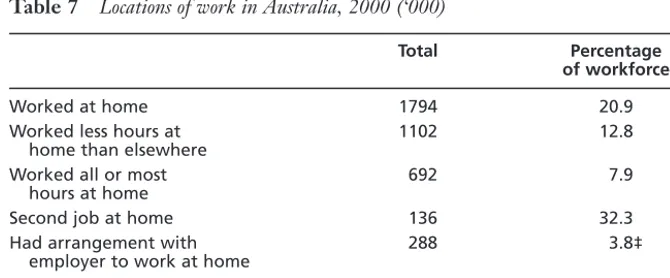
Table 7 Locations of work in Australia, 2000 (‘000)
Total Percentage
of workforce
Worked at home 1794 20.9 Worked less hours at 1102 12.8
home than elsewhere
Worked all or most 692 7.9 hours at home
Second job at home 136 32.3 Had arrangement with 288 3.8‡
employer to work at home
Employed at home§ 980 11.4
Percentage of second jobs; ‡ percentage of employees; § worked all or most hours plus had arrange-ments with employer to work at home.
This later survey is not comparable with the earlier survey. Previous surveys defined home-workers as those who performed most of their work from home. The more recent survey defines home-work as those who worked all or most hours at home, plus those who had an arrangement with their employer to work at home. The broad results of the 2000 survey are summarised in Table 7.
Around one-fifth of all workers perform some work at home. Of these workers, approximately two-thirds worked fewer hours at home than elsewhere. Those classified as home-workers make up slightly more than 10 per cent of the workforce. In the case of second jobs, nearly one third of second jobs are home based.
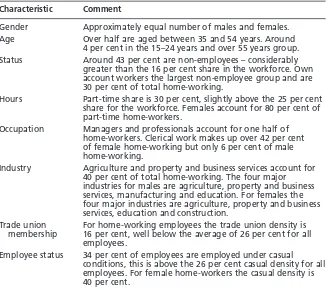
Home-workers are concentrated in a few industries with agriculture and property and business services dominating (see Table 8). They have a high employee status. Employees working at home are more likely to be non-unionised and employed under casual conditions than employees located in an official workplace.
While the gender mix is approximately equal, women are more likely to work part-time and to a different occupational mix (especially the high clerical
Table 8 Home-working characteristics in Australia, 2000
Characteristic Comment
Gender Approximately equal number of males and females. Age Over half are aged between 35 and 54 years. Around
4 per cent in the 15–24 years and over 55 years group. Status Around 43 per cent are non-employees – considerably
greater than the 16 per cent share in the workforce. Own account workers the largest non-employee group and are 30 per cent of total home-working.
Hours Part-time share is 30 per cent, slightly above the 25 per cent share for the workforce. Females account for 80 per cent of part-time home-workers.
Occupation Managers and professionals account for one half of home-workers. Clerical work makes up over 42 per cent of female home-working but only 6 per cent of male home-working.
Industry Agriculture and property and business services account for 40 per cent of total home-working. The four major industries for males are agriculture, property and business services, manufacturing and education. For females the four major industries are agriculture, property and business services, education and construction.
Trade union For home-working employees the trade union density is membership 16 per cent, well below the average of 26 per cent for all
employees.
Employee status 34 per cent of employees are employed under casual conditions, this is above the 26 per cent casual density for all employees. For female home-workers the casual density is 40 per cent.
representation) and a slightly different industry mix. Home-based work is dominated by micro business activity. The dominant status of own account arrangements means that much home-working is outside of trade unions and collective agreements together with regulations governing employees. Those who are employees also have relatively a low union density and a high casual intensity. Overall, the status of home-workers and the fluidity of their status con-tributes to the problems of enforcing labour regulations and to their generally poor employment conditions.
As with home-work, telework is very ambiguous and diverse. Not all telework takes place in the home, it can be conducted at organised work places, it can take place across a number of workplaces or between workplaces. Telework relies on the existence of an electronic communications network to link workplaces, to link the worker and the workplace and to link the home and the workplace. As with home-work, telework is diverse and takes place in a range of contextual situations (Diamond and Lafferty 2000, p. 119). Telework allows the employee to substitute home based for external workplace based work, substitute paid work for unpaid work, or extend the hours of paid and unpaid work. The avail-able evidence suggests that telework fits into the employment arrangements of those home based workers who do not exclusively work at home. Once again, there is limited official data on telework provided by the ABS through its survey ofUse of the Internet by Households(Catalogue no. 8147.0). There have been very few surveys of telework in Australia with the latest indicating that its take-up is very limited (Lafferty and Whitehouse 2000).
Software and hardware developments together with improving communications networks now mean that:
• more work tasks can be performed externally to the workplace; • more home based businesses can be established;
• the nature and configuration of the workplace can be restructured; and • workers can be easily monitored away from the workplace.
These new possibilities mean that it is possible to work anywhere and at any time. The business can operate continuously through space and across time. The location of the workforces can be more fragmented and geographically diverse, while work can be performed continuously—24 hours per day, seven days per week. External work offers extensive flexibility possibilities, the means to substantially reduce overhead costs associated with traditional employment arrangements and the opportunity to evade employment regulations. The dark side to the potential benefits of telecommuting and the extension of home based work is the loss of choice, the loss of entitlement and the extension of working hours.
GENDER ASPECTS OF LABOUR MARKET DEVELOPMENTS AND LABOUR POLICY
Labour force participation
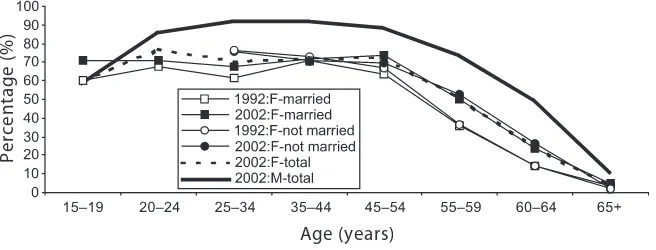
10 years earlier. Over the same period, the female participation rate increased by four percentage points; from 51.7 per cent in November 1992 to 55.7 per cent by November 2002. When the data are disaggregated by marital status, it is apparent that the pattern of long-term decline (males) and long-term rise (females) is most evident amongst persons who are married. In the decade to November 2002 the participation rate of married men declined by 1.6 per cent to 74.7 per cent, whilst the participation rate of married women increased by 5.7 per cent to 58.7 per cent (Table 9).
Over the decade, the strongest growth in female participation rates could be observed amongst older women (women aged 45 and over). In 1992, for example, the participation rate of married women aged 45–54 was 63.3 per cent; by 2002 it had increased to 73.5 per cent. Women aged 55–59 years have similarly experienced large increases in their participation rates: in the decade to 2002 participation rates amongst married and unmarried women in this age band increased by 14 and 16.1 percentage points, respectively. That said, the data
Source:AusStats Cat. no. 6291.0.40.001, Tables 9a and 9b.
Age (years)
Percentage (%)
Figure 4. Participation rate by gender, age, marital status and year (average annual
participation rate, original series)
Table 9 Participation rate by gender and marital status
Participation rate Males Females
Nov. 02 % Point change Nov. 02 % Point change
(%) 92–02 01–02 (%) 92–02 01–02
Original
Married 74.7 -1.6 0.0 58.7 5.7 1.0 Not married 66.8 -1.1 -0.8 51.9 2.8 0.3 Total 71.6 -1.4 -0.3 55.8 4.4 0.7
Total
Seasonally adjusted 72.0 -1.7 -0.3 55.9 4.4 0.7 Trend estimate 71.8 -2.0 -0.6 55.7 4.0 0.4
displayed in Figure 4. shows that a large number of women continue to retire from the labour market at a relatively young age. In 2002, the average female participation rate amongst women aged 45–54 was 72.5 per cent, falling to 50.5 per cent among women aged 55–59 and to 24.3 per cent among women aged 60–64.
Reasons for retirement are numerous and gender related. For example, around 10 per cent of women retiring from full-time work between the age of 55 to 64 did so ‘to look after the family, house or someone else’—the corresponding share of males retiring for this reason was 1.5 per cent (Figure 5). Other ‘family reasons’ cited by this female retirement age cohort included ‘to coincide with partners retirement’ (4.6 per cent) and ‘to have holiday/move house/spouse transferred’ (5.0 per cent). In contrast, 30 per cent of males who were aged 55–64 years at the time of retiring from full-time employment, cited their own ill health or injury as the main reason—the comparable rate for women was 13.4 per cent.
Superannuation and gender segregation
Clearly, early retirement from the workforce will have a significant impact on the final ‘nest-egg’ or total superannuation accumulations over the work-life. The issue takes on even greater significance when set within the broader debate concerning pension adequacy and the ability of current levels of superannuation to provide for a reasonable living standard in retirement. (Senate Select
Source:AusStats Retirement and Intentions survey 1997, Cat. no. 6238.0, Table 6. Notes: (䊏) Females; (䊐) males
Figure 5. Reasons for ceasing last full-time job (persons aged 55—64 at time of
Committee on Inquiry into Superannuation and Standards of Living in Retirement, 2002).
The Australian retirement income system has three main strands: the age pension (a means-tested, flat rate, non-contributory payment funded from government general revenue); occupational superannuation (funded from com-pulsory and voluntary contributions) and other private savings (e.g. property investments). While occupational superannuation is the government’s preferred system for the delivery of retirement income, it will be some years before the majority of retirees will derive their main retirement income from superannuation. In 1999–2000, only eight per cent of people aged 65 or more relied on super-annuation in their retirement; the majority (78 per cent) received their main income from the Age Pension (ABS Cat. no. 4102.0, 2002, p. 175). A recent survey of income sources of those who left full-time employment aged 45 years or more, similarly found that very few (11 per cent) derived their main income from superannuation. The most common income source for males was an Age or Service Pension (23 per cent), while the majority (38 per cent) of women were dependent on someone else’s income (ABS 6238.0, 1997).
While the introduction of compulsory employer superannuation contributions in 1992 has resulted in a marked expansion in superannuation coverage, the balances within many of these accounts remains low, suggesting that even under a fully mature SGC (Superannuation Guarantee Charge) system many will retire with inadequate levels of superannuation (Preston and Jefferson 2002). In 2000, for example, 65.6 per cent of casual employees with superannuation (and a known account balance) had less than $5000 in their account. Given that many women are employed on a casual basis, it comes as no surprise to learn that women were over-represented at the lower end of the distribution of superannuation funds; 44 per cent of women with superannuation and a known account balance held less than $5000 in 2000 (ABS Cat. no. 6361.0, 2000) The corresponding share for men was 29.2 per cent.
Overall, the weight of evidence in the retirement incomes literature suggests that the majority of women will not benefit from a retirement incomes system centred on superannuation (Ginn et al.2001; Olsberg 2001; Preston & Austen 2001). Constraining factors, as indicated above, include their patterns of labour market attachment as well as the nature and forms of the jobs they hold. Women are, for example, typically clustered into a narrow range of jobs—jobs which are, in turn, often low-paid in relative terms (see Nowak & Preston 2001). For example, while women accounted for 46.2 per cent of total employees in November 2002, they were most commonly found in clerical positions (86.7 per cent of all advanced clerical and service employees) and were under-represented in the managerial and administrative ranks (accounting for 22.6 per cent of all employees in these jobs; see Figure 3).
In recent years, however, there has been strong employment growth (see Fig. 6) , a rise in female enrolment in higher education and a movement of women in to more male-dominated occupations. For example, between November 1996 and November 2002, the total employment (of employees) increased by 13.2 per cent, with growth most pronounced amongst associate professionals
Source:AusStats Cat. no. 6291.0.40.001.
Notes: (䊐) Women’s share (%) of total employment in November 2002; ( ) percentage point change in women’s share of total employment from November 1996 to November 2002; (䊏) percentage change of total employment from November 1996 to November 2002
Figure 6. Change in total employment and women s share of total employment,
(34.2 per cent), professionals (20.4 per cent) and intermediate clerical, sales and service workers (18 per cent). Outcomes in the year to November 2002 were reflective of this general trend with employment growth equal to 2.2 per cent, spurred by above-average growth within elementary clerical, sales and service workers (5.9 per cent) and associate professionals (4 per cent), but held back by a decline (8.8 per cent) in managerial and administrative employment. Over the same period, women’s representation in these occupational groups also changed the most, rising by 4.2 percentage points among associate professionals and 2.2 percentage points among managers and administrators. Their share of professional jobs was slower to adjust with their representation improving by only 0.6 percentage points, although women and men are most equally represented within this professional grouping (51.5 per cent of professional employees are women, most of whom are in nursing and teaching).
While the above trends are encouraging, it is also apparent that in the absence of some dramatic labour market event, occupational segregation is likely to remain a persistent feature of the Australian labour market for sometime to come. The benefits to be derived from occupational superannuation will, therefore, continue to remain unevenly distributed.
Paid maternity leave
There are a number of ways improving the economic wellbeing and financial position of women in later life. One such measure is paid maternity leave, with identified advantages including skills retention, improved labour market attach-ment and the developattach-ment of equitable workplaces/work-practices (HREOC, 2002a). However, notwithstanding identified benefits of paid maternity leave (PML), the debate in Australia over the course of 2002 took on some curious dimensions. Issues such as declining fertility, population ageing, who should pay, basic worker entitlements and work–life balance were central elements in the discussions underscoring the complexity of the PML debate. Indeed, it might be argued that debate was hampered by the absence of clear community agreement on the question at the centre of the debate. While some were debating ‘how’ to introduce PML in Australia (e.g. whether it should be government funded or employer funded, the dollar amount and the eligibility rules), others were debating a more fundamental question of ‘whether’; i.e. whether or not Australia should have a national PML arrangement.
working for more than one employer and the self-employed (ibid.). Available statistics suggest that around 38 per cent of female employees (excluding owner–managers) are currently entitled to some form of paid maternity leave (57 per cent of whom are in the private sector) (Table 10)—which means that that 62 per cent of female employees are without such income protection. Many of this latter group are casual workers (Table 11). While 38 per cent of female employees are entitled to some of paid maternity leave, it should be borne in mind that arrangements across schemes differ markedly both in level of payments and duration. For further information see Baird (2002).
The arrangements proposed by HREOC fall short of a number the provisions as set out in the ILO Maternity Protection Convention (183) and supplementary recommendations (ILO Recommendation 101); e.g. that cash benefits be no less
Table 10 Female employees (excluding owner-manager) entitled to PML
Sector Total Total female
Public Private Not employees
determined (%)
Labour force status
Employed full time 42.4 56.7 1.0 100 50.90
Employed part time 40.7 58.6 0.7 100 20.80 Occupation
Managers and 52.8 47.0 – 100 64.60
administrators
Professionals 63.5 35.0 1.5 100 54.20
Associate professionals 40.2 59.3 0.4 100 46.00
Tradespersons and 17.4 83.2 – 100 24.30
related workers
Advanced clerical 25.0 74.6 0.4 100 44.10
and service workers
Intermediate clerical, 34.1 65.1 0.8 100 37.40
sales and service workers
Intermediate production 3.0 97.4 – 100 25.60
and transport workers
Elementary clerical, sales 22.3 76.6 1.0 100 17.90
and service workers
Labourers and 27.9 71.4 0.6 100 20.50
related workers
Time worked in job
Less than 1 year 22.9 76.0 1.2 100 23.70 1 year to less than 5 years 32.6 66.4 1.0 100 34.20 5 years to less than 10 years 44.2 54.6 1.2 100 48.40 10 years and over 61.5 38.1 0.4 100 55.20
Total 42.0 57.1 0.9 100 38.00
than two-thirds of the woman’s previous earnings. Australia is, however, not a signatory to this convention (although it has signed the United Nations Convention on the Elimination of all forms of Discrimination Against Women). Moreover, the minimalist model as proposed undoubtedly reflects HREOC’s assessment of the political climate and its expectations of what might realistically be acceptable to the current conservative government.
While the government has yet to endorse the HREOC recommendation, there is ground for believing that the proposal may be funded. The government has indicated that it will give the proposal serious consideration at the next budget— a position that contrasts markedly with the Prime Minster’s outright opposition to PML at the commencement of the debate in early 2002.
In the meantime, the ACTU is preparing to build on the current PML proposals via a Work and Family Test Case to be heard in the Australian Industrial Relations Commission later this year. The case will focus on issues such as job security, job quality, part-time opportunities and other arrangements to help workers balance work and family demands. As with many other benefits, it is also clear that women workers cannot rely on the enterprise bargaining system to access benefits, or even protect what they already have (Sullivan et al.2003).
CONCLUSION
The current cycle of growth appears to be coming to an end. On top of a problematic international economy, Australia is confronted by a drought, a cyclical decline in the building sector and a weakening of the current account. This suggests continued weakness in the labour market throughout 2003, with an expected increase in the unemployment rate. A decade of strong growth has not been translated into full-time jobs; labour under-utilisation continues to
Table 11 Employee (excluding owner-manager) paid maternity/paternity leave
entitlements
Entitled to paid Not Do not Total
maternity/ entitled know (%)
paternity leave (%) (%) (%)
Females 38.0 43.9 18.1 100 Casuals 0.4 93.4 6.3 100 Other employees 53.6 23.4 23.0 100 Males 33.7 37.4 29.0 100 Casuals 0.6 90.9 8.5 100 Other employees 40.9 25.7 33.4 100 All employees 35.7 40.5 23.8 100 Casuals 0.4 92.4 7.2 100 Other employees 46.4 24.7 28.9 100
remain high; working hours have been deregulated; and women are still confronted with forms of exclusion and segregation within the labour market. In terms of policy, we can expect no progress on working hours, systemic labour under-utilisation, and paid maternity leave. Already, the policy agenda is being set with the Australian Chamber of Commerce and Industry calling for further industrial relations reforms (ACCI 2002), the IPA calling for measures to improve management’s capacity to manage (IPA 2002) and the Federal Workplace Relations Minister urging business to ‘take on unions’ (Abbott 2002). In short, expect more of the same on the policy front and no progress in 2003 in address-ing the deep-seated weaknesses present in the labour market.
ACKNOWLEDGEMENTS
Editorial assistance for this article was provided by Jana Lindstrom-Dube.
REFERENCES
Abbott, Honourable A (2002) Abbott Encourage Managers to Fight Unions. Transcript ABC Radio, AM, 17 December.
ACCI (2002) Modern Workplace, Modern Future: A Blueprint for the Australian Workplace Relations System 2002–2010. Melbourne: Australian Chamber of Commerce and Industry.
ACTU (2002) Submission in the Reasonable Hours Test Case. Melbourne, ACTU.
ANZ (2003) Newspaper Job Advertisements Down 13.7 per cent in December.ANZ Media Release [Online]. Available: http://www.anz.com [Accessed 6 January 2003].
Australian Bureau of Statistics (ABS) (various years) AusStats, Spreadsheets and Super Cubes. Cat. no. 6291.0.40.001, Canberra: ABS.
ABS (1997) Retirement and Retirement Intentions, Australia. Cat. no. 6238.0, Canberra. ABS (2000) Locations of Work, Australia, Cat. no. 6275.0, Canberra: ABS.
ABS (2000) Survey of Employment Arrangements and Superannuation. Cat. no. 6361.0, Canberra: ABS.
ABS (2000) Use of the Internet by Householders. Cat. no. 8147.0, Canberra: ABS.
ABS (2001a) Labour Statistics: Concepts, Sources and Methods. Cat. no. 6102.0, Canberra: ABS. ABS (2002) Australian Social Trends, Cat. no. 4102.0, Canberra: ABS.
ABS (2002) Changes to Labour Force Survey Product Set. Cat. no. 6297.0, Canberra: ABS. ABS (2002) Employee Earnings and Hours Australia,Preliminary.Cat. no. 6305.0, Canberra: ABS. ABS (2002) Industrial Disputes, Australia. Cat. no. 6321.0, Canberra: ABS.
ABS (2002) The Labour Force, Australia. Cat. no. 6203.0, Canberra: ABS.
Australian Centre for Industrial Relations Research and Teaching (ACIRRT) (1999) Australia at Work. Sydney: Prentice Hall.
Baird, M (2002) Paid Maternity Leave in Australia: Good, Bad and Ugly Outcomes. 16th AIRAANZ Conference Proceedings, Queenstown, vol ll, pp 1–10.
Biddle D, Burgess J (2002) The Australian job network revolution: Rationale, implementation and evolution. In: Carlson E, Mitchell W (eds). The Urgency of Employment. Sydney, Centre for Applied Economic Research, pp. 225–44.
Bittman M, Rice J (2002) The spectre of overwork: An analysis of trends between 1974 and 1997 using Australian time-use diaries. Labour & Industry12(3), 5–26.
Borland J (1999) Earnings inequality in Australia: Changes, causes and consequences. Economic Record75, 177–202.
Bray M, Waring P, Macdonald D, Le Queux S (2001) The representation gap in Australia. Labour & Industry12(2), 1–32.
Burgess J, Mitchell WF (2000) The Australian labour market in 2000.
Australian Journal of Industrial Relations43(2), 123–48.
Campbell I (2002) Extended working hours in Australia. Labour & Industry, 13(1) 91–10. Campbell I, Macdonald D, Burgess J (2001) Ten years of enterprise bargaining in Australia: An
introduction. Labour & Industry12(1), 1–26.
Carlson E, Mitchell W, Watts M (2003) The impact of new forms of wage setting on wage outcomes in Australia. In: Burgess J, D. Macdonald (eds) Developments in Enterprise Bargaining, Melbourne: Tertiary Press, pp. 118–40.
Costello P (2002) 2002–03 Mid-year Economic and Fiscal Outlook.Press Release No. 074 [Online] http://www.treasurer.gov.au/tsr/content/pressreleases/2002/074.asp [Access Date: 9 March 2003]
Crichton S, Delaney, B (2002) All work, no pay for overtime brigade. Sydney Morning Herald. 16 December 2002.
Cully M, Ngo P (2001) Year of the flip flop: The Australian labour market in 2001. Australian Bulletin of Labour28(1), 1–19.
Department of Employment and Workplace Relations (DEWR) (2002) Vacancy Report, various editions [Online]. http://www.workplace.gov.au [Access date: 9 March 2003]
Diamond C, Lafferty G (2000) Telework: Issues for research, policy and regulation. Labour and Industry11(1), 115–28.
Ginn J, Street DS, Arber (eds) (2001) Women, Work and Pensions: International Issues and Prospects. Buckingham: Open University Press.
Hall, R (2000) Outsourcing, contracting out and labour hire: Implications for human resource development in Australia. Asia Pacific Journal of Human Resources38(2), 23–41.
Human Rights and Equal Opportunity Commission (HREOC) (2002a) Valuing Parenthood.
[Online]. http://www.hreoc.gov.au/sex_discrimination/pml/index.html [Accessed 20 January 2003].
HREOC (2002b) A Time to Value. [Online]. Available: http://www.hreoc.gov.au [Accessed 20 January 2003].
Institute of Public Affairs (IPA) (2002) The Capacity to Manage Index. Sydney: IPA.
Lafferty G, Whitehouse G (2000) Telework in Australia: Findings from a national survey in selected industries. Australian Bulletin of Labour26(3), 236–52.
Mitchell WF (2001) Hidden Unemployment in Australia. In: Mitchell WF, Carlson E (eds)
Unemployment: The Tip of the Iceberg, Sydney: CAER-UNSW Press, pp. 33–46
Mitchell WF (2001a) The unemployed cannot find jobs that are not there! In: Mitchell WF, Carlson E (eds) Unemployment: The tip of the Iceberg, Sydney, CAER-UNSW Press.
Mitchell WF (2001b) Measuring persistence in unemployment rates. Working Paper 01-04, Centre of Full Employment and Equity, The University of Newcastle, April.
Mitchell WF, Carlson E (2001) Unemployment: The Tip of the Iceberg, Sydney: CAER-UNSW Press. Mitchell WF, Carlson E (2001) Labour under-utilisation in Australia and the USA. In: Mitchell WF, Carlson E (eds) Unemployment: The Tip of the Iceberg, Sydney: CAER-UNSW Press, pp. 47–69.
Mitchell WF, Carlson E (2002) Measures, Labour Under-utilisation and their Implications for the Inflation Process, Working Paper 02-10. Centre of Full Employment and Equity: The University of Newcastle.
Mitchell WF, Muysken J (2002a) The Phillips Curve, the NAIRU, and Unemployment Asymmetries,
Working Paper 02-05. Centre of Full Employment and Equity: The University of Newcastle.
Mitchell WF, Reedman, L (2002) Fiscal Policy and Financial Fragility: Why Macroeconomic Policy is Failing, Working Paper 02-11. Centre of Full Employment and Equity: The University of Newcastle, November.
Nelson L, Holland P (2001) Assessing the impact of 12 hour shifts: An evaluation by 10 com-panies and union officials. Labour & Industry12(2), 97–114.
Nowak M, Preston AC (2001) can human capital explain why nurses are so poorly paid? Australian Economic Papers 40(2), 232–45.
Olsberg D (2001) Women and Retirement Savings – Ways Forward? Lessons from Overseas Initiatives and Proposed Australian Strategies. Published paper presented to the Economic Policy Summit, University of New South Wales, 7 September. [Online] http://www.arts.unsw.edu.au/ ageing/wsdownloads.htm [Accessed 8 January 03].
Preston A (2002) Gender Earnings and Part-time Pay in Australia: 1990–1998. Paper presented at BUIRA Conference, University of Sterling.
Preston A, Austen S (2001) Women, superannuation and the SGC. Australian Bulletin of Labour
27(4), pp. 272–95.
Preston A, Jefferson T (2002) The Economics of Labour Markets and Retirement Provision: Baby Boomers and Gender Differences in Australia. Paper presented at IFA 6th Global Conference on Ageing-Maturity Matters, Burswood International Resort Convention Centre, Perth, 27–30 October.
Select Committee on Superannuation (SCS) (2002) Superannuation and Standards of Living in Retirement: Report on the Adequacy of the Tax Arrangements for Superannuation and Related Policy. Senate Report, Canberra: Senate Printing Unit, Parliament House, December. Sullivan A, Strachan G, Burgess J (2003) Women and enterprise bargaining. In: Burgess J,
Macdonald D (eds) Developments in Enterprise Bargaining. Melbourne: Tertiary Press, pp. 158–75. Whitehouse, G (2001) Recent trends in pay equity: Beyond the aggregate statistics. Journal of