KINETICS STUDY ON NITRATION OF METHYL RICINOLEATE
Abdullah
1,2*, Triyono
2, Wega Trisunaryanti
2, and Winarto Haryadi
2 1Department of Chemistry, Faculty of Mathematics and Natural Sciences, Lambung Mangkurat University, Jl. A. Yani Km. 35,8 Banjarbaru, South Kalimantan, Indonesia, 70714
2
Department of Chemistry, Faculty of Mathematics and Natural Sciences, Universitas Gadjah Mada, Sekip Utara, Yogyakarta, Indonesia, 55281
Received November 7, 2011; Accepted February 7, 2012
ABSTRACT
Kinetics parameter values of methyl ricinoleate nitration (rate constant, reaction order and the rate of reaction) have been determined. Nitration was carried out with both concentrations of HNO3and acetic anhydride in excess to
the concentration of methyl ricinoleate. Thus, the kinetics parameter value was only affected by the concentration of methyl ricinoleate. Based on kinetic study conducted, it could be concluded that the nitration follows pseudo first-order, and the reaction rate for methyl ricinoleate with initial concentration of 0.375, 0.325 and 0.250 M were 3.736 x 10⁻⁵, 2.471 x 10⁻⁵, and 1.724 x 10⁻⁵M/s respectively, with the rate constant at 29 °C was 6.667 x 10⁻⁴(s-1). Based on evaluation of FTIR spectra could be estimated that the nitration produces compounds containing functional groups of -NO3and -NO2.
Keywords:nitration; methyl ricinoleate; kinetics
ABSTRAK
Telah ditentukan nilai parameter kinetika dari reaksi nitrasi metil risinolat (konstanta laju, orde dan laju reaksi). Reaksi nitrasi dilakukan dengan HNO3 maupun asam asetat anhidrit dalam konsentrasi berlebih terhadap metil
risinolat. Dengan demikian, nilai parameter kinetika dari reaksi nitrasi ini hanya dipengaruhi oleh konsentrasi metil risinolat. Berdasarkan pada hasil pengamatan maka dapat disimpulkan bahwa reaksi nitrasi metil risinolat merupakan reaksi orde 1 semu, konstanta laju reaksi untuk konsentrasi awal sebesar 0,375; 0,325; dan 0,250 M masing-adalah sebesar 3,736 x 10-5; 2,471 x 10-5dan 1,724 x 10-5M/detik. Berdasarkan hasil pengamatan spektra FTIR dapat diperkirakan bahwa senyawa hasil nitrasi metil risinolat mengandung gugus fungsi -NO3dan -NO2.
Kata Kunci:nitrasi; metil risinolat; kinetika
INTRODUCTION
Nitration is an important reaction in the industrial world. Products of nitration are widely used in industrial paint, explosives and fuel additives [1]. On nitration raw material is reacted with HNO3 and H2SO4 or acetic
anhydride generally [2-3].
Lately, the nitration processes to obtain the additive as a cetane improver on diesel oil are increasingly receiving attention. This is due to the declining quality of crude oil and this impact on the quality of diesel oil which is resulted. One of the nitration compounds that are widely used as an additive is 2-ethylhexyl nitrate (EHN) [4]. This compound is resulted from nitration of propene derivatives at which it was produced from cracking of petroleum and flammable [5]. Therefore, some researchers [5-9] attempt to find another alternative by
using triglycerides or fatty acids as raw material. However, although studies on the nitration process of triglycerides or fatty acids and their derivatives have been widely performed, but the study of the kinetics aspect is still very limited.
were the three neck distillation flask (Pyrex), the cooler of ball type (Pyrex), magnetic stirrer (Stuart SB 163), water bath, separating funnel (Pyrex), and gas chromatography (GC Hawlett Pacard 5890 seri II).
Procedure
Mol ratio of HNO3 to methyl ricinoleate (MR)
determination
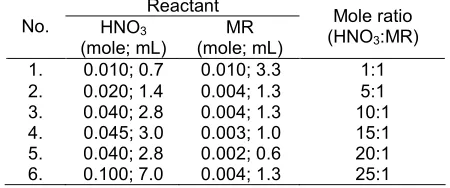
The experiment was intended to determine the optimum mole ratio of HNO3 on methyl ricinoleate. The
optimum mole ratio can be determined from the concentration of residual of MR which was observed in the reaction mixture by gas chromatography (GC). The nitration was carried out at room temperature with reaction time of 25 min. Here the number of moles of each reactant and the mole ratio of HNO3and MR were
used in this experiment.
Methyl ricinoleate nitration
In the nitration process, initially HNO3was added in
the flask, and then followed by addition of acetic anhydride. Furthermore, a magnetic stirrer was operated slowly (200 rpm), until the temperature in the distillation flask becomes constant. After the temperature constant, then methyl ricinoleate was added into a flask quickly. After the reaction run for t min, the sample was taken for purification process.
Purification was carried out by adding the sample in 200 mL of ice water, and then the mixture was put in a separating funnel (500 mL), and followed by addition of diethyl ether (20 mL). Furthermore, the upper layer was washed using 50 mL of distilled water several times until the washing water become neutral. The upper layer was dried with anhydrous Na2SO4, and then allowed to stand
for 24 h. The mixture was filtered and the diethyl ether layer was evaporated by heating at a temperature of 80 °C for about 30 min. Evaporation was stopped after a constant weight was obtained, then analyzed by GC and FTIR.
HNO3(mole; mL) AA (mole; mL) MR (mole; mL) 0.270; 18 0.270; 24 0.018; 6 0.270; 18 0.270; 24 0.015; 5 0.270; 18 0.270; 24 0.012; 4
Note: Total volume of reactant was 48 mL. Control of total volume was carried out with H2O addition.
Determination of kinetics parameter values of methyl ricinoleate nitration
Determination of kinetics parameter values was performed by varying the number of moles of methyl ricinoleate (MR), while the number of moles both HNO3
and acetic anhydride (AA) were not varied. The nitration was conducted at room temperature with the variation of reaction time (5, 11, 17, 23 and 29 min).
RESULT AND DISCUSSION
The optimum mole ratio of HNO3to MR
HNO3is a polar compound, and methyl ricinoleate
(MR) has a relatively low polarity. Therefore HNO3and
methyl ricinoleate can not mix well in any ratio. While this reaction required a high homogeneity of mixture, so the reaction can be run optimally. Therefore, it was necessary to vary the ratio of moles of HNO3 to the
acetic anhydride. The optimum mole ratio was observed from the low concentration of the residual MR determined by GC. Fig. 1 showed the relationship of concentration of residual MR to different mole ratio.
Fig 1.Plot of percentage of residual concentration of MR
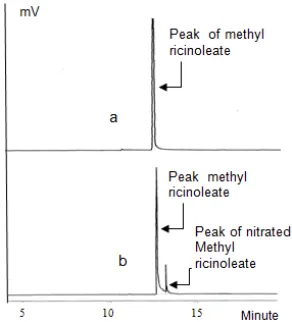
versus mole ratio of HNO3to MR Fig 2. Chromatogram of methyl ricinoleate before
nitration (a) and after nitration (b)
Fig 3.FTIR spectra of methyl ricinoleate before nitration (a) and after nitration for 29 min (b)
Table 3.Interpretation of bonds and functional groups of the methyl ricinoleate
No. Wavenumber (1/cm) Bond (kind of vibration) Functional group 1. 3421.78
1246.04
O-H (stretching)
C-O (stretching) Alcohol 2. 3009.00
856.41
C-H (stretching)
C-H (bending) Alkene 3. 2927.99
2854.70 1462.07; 1438.92 and
1361.77 725.25
C-H (stretching, antisymetric) C-H (stretching, symmetric)
C-CH2(stretching) -CH3(stretching)
C-H (stretching
Alkyl Alkyl Methylene
Methyl Long chain alkyl
4. 1739.82 C=O (stretching) Ester
5. 1199.74 and 1172.74 C-O (stretching) Ether
Nitration of methyl ricinoleate and the results of GC and FTIR analysis
Firstly, nitration was performed by mixing of HNO3
with acetic anhydride. The mixing was intended to get the nitronium ion (NO2
+
) that act as electrophiles. Nitronium ion was formed as a result of interaction between HNO3 with acetic anhydride through the
following mechanisms.
3
2 2 33 3 3 2
CH CO O H O 2 CH COOH
2 CH COOH 2 HNO 2CH COO 2H O
2NO2
Seri 3 ([MR]0= 0.250 M])
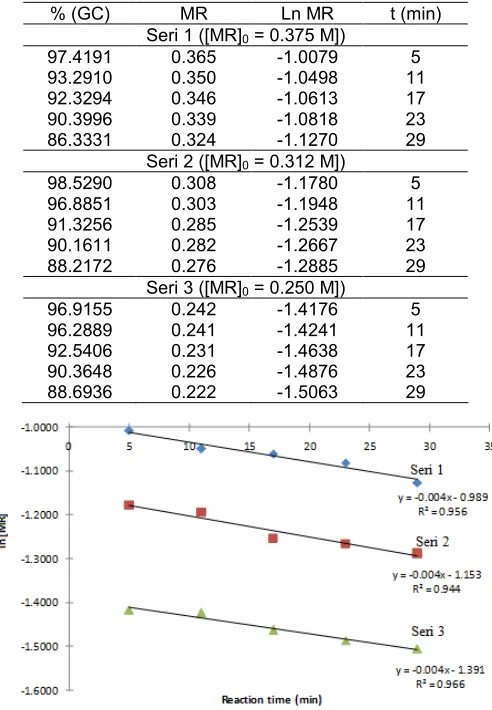
96.9155 0.242 -1.4176 5 96.2889 0.241 -1.4241 11 92.5406 0.231 -1.4638 17 90.3648 0.226 -1.4876 23 88.6936 0.222 -1.5063 29
Fig 4.Plot of ln MR versus reaction time
Fig. 2a showed that peak of methyl ricinoleate appeared at a retention time of about 12.6 min, while the peak of nitrated methyl ricinoleate appeared at 13.0 min. The concentration of nitrated methyl ricinoleate was 11.42 (%, GC) for nitration 29 min (Fig. 2b). Analysis of the products of nitration also be performed with FTIR and compared to the original compound (methyl ricinoleate).
Interpretation of the spectra of methyl ricinoleate (Fig. 3a) in determining the type of bonding and functional groups was listed in Table 3.
Fig. 3b showed two new spectrums that appeared at the wavenumber of 1627.92 and 1543.05 cm-1. The existence of -NO3 group was marked by a sharp
absorption spectrum in the region 1650-1500 cm-1 [14], while the -NO2group was marked by a sharp spectrum
at region of 1550-1372 cm-1 and a spectrum with moderate intensity in the region of 1390-1300 cm-1. According to Suppes at al. [5], the formation of nitrate compound (-NO3 group) was marked by spectrum at
1650, 1282 and 854 (cm-1), meanwhile for nitro
change of [MR] to the initial concentration ([MR]0) could
be expressed as:
v w
q3 o
dx
r k HNO AA MR –
dt x
(1)
Because the concentration of HNO3 and AA can
be considered constant, then equation 1 turns into equation 2 and 3.
q
v w3 0
r k’ MR –x wherein k’ k HNO AA (2)
Later in the determination of the reaction order (q), if the reaction order equal to 1, then through the relationship d [MR] / [MR] = - k dt, by integrating the equation would be obtained:
0ln MR ln MR – kt (3)
From equation 3, then by plotting ln [MR] versus t would be obtained a straight line, at which slop equal to -k for each series of experiment.
Table 4 showed the concentration of residual methyl ricinoleate ([MR]) in the mixture after reacted for t min, where the concentration of MR data was obtained by GC. Percentage values in the GC data was multiplied by [MR]0, so that [MR] after the reaction
could be determined. Furthermore, the data [MR] was converted into ln [MR], then used in the plotting of the graph in Fig. 4.
Fig. 4 showed that the resulting line had a high linearity. This was evidenced by the value of R2almost close to 1. Thus the initial assumption by assigning values to the MR order reaction equal to 1 was correct. In this case the reaction order of MR was said to be pseudo first order. Then from the equation of the line in Fig. 4 could be seen that the slope was also the value of –k (average) was equal 4 x 10⁻³, so that the rate constant value (k) was equal to 4 x 10⁻³(min-1) or equal to 6.667 x 10⁻⁴(s-1).
Fig 5. Plot of residual concentration of MR versus time of reaction
Based on Fig. 5, and then carried out the calculation as follows:
Thus the reaction rate for each series of experiments was 3.736 x 10⁻⁵M/s, 2.471 x 10⁻⁵M/s, and 1.724 x 10⁻⁵M/s.
CONCLUSION
Based on kinetic studies conducted, it could be concluded that nitration of methyl ricinoleate follows pseudo first-order reaction, the reaction rate for each initial methyl ricinoleate concentration of 0.375, 0.325 and 0.250 M was 3.736 x 10⁻⁵, 2.471 x 10⁻⁵ and 1.724 x 10⁻⁵ M/s, meanwhile reaction rate constant at 29 °C of 6.667 x 10⁻⁴ (s-1). Identification with FTIR, it could be estimated that the results of nitration was a compound containing -NO3and -NO2groups.
ACKNOWLEDGEMENT
Acknowledgements to Staff of Physical Chemistry who prepared the instruments and chemicals for this research.
REFERENCES
1. Ali, M.F., Ali, B.M.E., and Speight, J.G., 2005,
Handbook of Industrial Chemistry, McGraw-Hill
Companies, New York.
2. Olah, G.A., Narang, S.C., and Olah, J.A., 1981,
Proc. Natl. Acad. Sci. USA, 78, 6, 3298–3300. 3. Odle, R.R., 1990, Nitration Reaction with Acid
Anhydride Promoters,US Paten, 4, 921, 970. 4. Solano-Serena, F., Nicolau, E., Favreau, G.,
Jouanneau, Y., and Marchal, R., 2007,
Biodegradation, 20, 1, 85–95.
5. Suppes, G.J., Heppert, J.A., and Mason, M.H.JR., 2001, Process for Producing Cetane Improvers from Triglycerides,US Patent, 2001/0037598 A1. 6. Poirier, M-A., Steere, D.E., and Krogh, J.A., 1995,
Cetane Improver Compositions Comprising Nitrated Fatty Acid Derivatives,US Patent, 5, 454, 842.
7. Adnan, R., 2002, Synthesis of Cetane Improver Additive from Palm Oil by Method of Nitration through Initial Reaction Using a Grignard Reagent,
Thesis, Faculty of Chemical Engineering UI,
Jakarta.
8. Canoira, L., Alcantara, L., Torcal, S., Tsiouvaras, N., Lois, E., and Korres, D.M., 2007,Fuel, 86, 7-8, 965–971.
9. Rabello, C.R, Siqueira, B.G., and Demenezez, R.B., 2009, Method for Production of Cetane-Index Improvement Additive for Diesel Oil, US Patent,
2009/0100749 A1.
10. Houle, C.R., and Malins, D.C., 1967, Nitrated Fatty Acid Esters,US Patent, 3, 305, 567.
11. Lewis, R.J. and Modie, R.B., 1997, The Nitration of Styrenes by Nitric Acid in Dichlorometane, J. Chem. Soc. Perkin Trans, 2, 3, 563–567.
12. Iraci, L.T, Riffel, B.G., Robinson, C.B., Michelsen, R.R., and Stephenson, R.M., 2007, J. Atmos.
Chem., 58, 253–266.
13. Sreedhar, I., Reddy, K.S.K., and Raghavan, K.V., 2009,Int. J. Chem. Eng. Res., 1, 2, 89–102. 14. Wade, Jr. L.G., 2006, Organic Chemistry, 6th ed.,
Pearson Education Inc., USA.
15. Pavia, D.L., Lampman, G.M., Kriz, G.S., and Vyvyan, J.R., 2009, Introduction to Spectroscopy, 4thed., Brooks/Cole Cencage Learning, Australia. 16. House, J.E., 2007, Priciples of Chemical Kinetics,