AUTOMATIC DETECTION OF STORM DAMAGES USING HIGH-ALTITUDE
PHOTOGRAMMETRIC IMAGING
P. Litkey a, , K. Nurminen a, E. Honkavaara a, *
a
Finnish Geodetic Institute, Department of remote sensing and photogrammetry, Geodeetinrinne 2, P.O. Box 15, FI-02431 Masala, Finland – (paula.litkey, kimmo.nurminen, eija.honkavaara)@fgi.fi
Commission VI, WG VI/4
KEY WORDS: Change Detection, Hazards, DSM, Image Matching, Forestry, Photogrammetry
ABSTRACT:
The risks of storms that cause damage in forests are increasing due to climate change. Quickly detecting fallen trees, assessing the amount of fallen trees and efficiently collecting them are of great importance for economic and environmental reasons. Visually detecting and delineating storm damage is a laborious and error-prone process; thus, it is important to develop cost-efficient and highly automated methods. Objective of our research project is to investigate and develop a reliable and efficient method for automatic storm damage detection, which is based on airborne imagery that is collected after a storm. The requirements for the method are the before-storm and after-storm surface models. A difference surface is calculated using two DSMs and the locations where significant changes have appeared are automatically detected.
In our previous research we used four-year old airborne laser scanning surface model as the before-storm surface. The after-storm DSM was provided from the photogrammetric images using the Next Generation Automatic Terrain Extraction (NGATE) algorithm of Socet Set software. We obtained 100% accuracy in detection of major storm damages. In this investigation we will further evaluate the sensitivity of the storm-damage detection process. We will investigate the potential of national airborne photography, that is collected at no-leaf season, to automatically produce a before-storm DSM using image matching. We will also compare impact of the terrain extraction algorithm to the results. Our results will also promote the potential of national open source data sets in the management of natural disasters.
* Corresponding author.
1. INTRODUCTION
The photogrammetric imaging is a cost-efficient method for collecting data for mapping purposes. Recent developments in digital surface model (DSM) generation from stereoscopic imaging by image matching techniques have made the method serious competitor for laser scanning in applications which utilize the object surface information (Leberl et al 2010). The imagery also provides visual, stereoscopic support for various forest storm damage management tasks.
Airborne laser scanning (ALS) provides accurate information about the canopy height, structure and the underlying terrain (Hyyppä et al, 2012a,2012b) and is widely considered to be the most promising method for various forest inventory and management tasks. ALS data was used for damage detection in forest (Rahman 2011, Vastaranta et al 2011), both studies used the height difference between the ALS measurements. The availability of ALS data that is recorded right after storm is unlikely, because the data is costly and therefore the flights are well planned.
Storm damage detection process is characterized by the fact that storms can occur at any season, which also influences the properties and quality of the data used in remote sensing tasks. The most challenging conditions for matching forest surfaces occur during the seasons when the deciduous trees do not have leaves, which can lead to a decrease in the matching quality (Baltsavias et al 2008). Low solar altitudes during autumn and winter seasons can be challenging, especially due to shadows,
which can deteriorate the quality of image matching (Honkavaara et al 2012). We expect that the methods that are the least sensitive to these natural variations have the highest automation potential. Methods that are based on comparisons of DSMs collected at two points in time (bi-temporal) could be efficient for automating storm damage detection. Other promising methods for automatic DSM generation include laser scanning (Hyyppä et al, 2012a, 2012b), radargrammetry using SAR images (Karjalainen et al 2012), and the automatic matching of images (Leberl et al 2010, Baltsavias et al 2008, Hirshmüller 2011, Järnstedt et al 2012).
In our previous research (Honkavaara et al 2013) we used four-year old airborne laser scanning surface model as the before-storm surface. The after-before-storm DSM was provided from the photogrammetric images using the Next Generation Automatic Terrain Extraction (NGATE) algorithm of Socet Set software. We obtained 100% accuracy in detection of major storm damages. We identified several topics to be considered in our future investigations. The before-storm DSM is a critical requirement in the method. One of the most interesting sources for before-storm DSM is to produce the model with image matching from national high-altitude photogrammetric imagery. These data sets are available much more widely and with higher temporal resolution than airborne laser scanning based surface models. Another important issue was the influence of the terrain extraction algorithm in the results. We used area based approach, but very interesting new developments are methods, that are based on pixel wise cost functions, such as the the semi-global matching (sgm) (Hirschmüller, 2011), which are International Archives of the Photogrammetry, Remote Sensing and Spatial Information Sciences,
expected to provide even denser DSMs. We will study these two topics in this investigation. We will describe the data and methods in Section 2, we give the results in Section 3 and conclusions are given in Section 4.
2. DATA AND METHODS
In this study, an area of size 21 km by 5 km was used. The area under study has a flat topography with maximum of 50 m height differences. The main land cover consists of coniferous forests; mixed forests and transitional woodland are also present.
2.1 Data
We used as the pre-storm data the national ALS data and the national photogrammetric imagery. As the after-storm data we used imagery collected after the storm. We have used in our studies a clipping of size 21 km by 5 km from one image strip of the after-storm flight
2.1.1 After-storm imagery
To collect after-storm imagery, airborne photogrammetric image flights were carried out using a Microsoft UltraCamXp large-format mapping camera on January 8th, 2012, right after the Total area covered during one day flight was 1620 km2.
2.1.2 Pre-storm ALS data
The ALS data were from the Finnish national land survey (NLS). The minimum point density of the NLS ALS data is half a point per square meter, and the elevation accuracy of the points in well-defined surfaces is 15 cm; the horizontal accuracy is 60 cm. The point cloud has automatic ground classification. The ALS data used in this study was collected in 2008 during the spring. LasTools software (Isenburg 2013) was used to merge the map sheets of NLS laser data that covered the area and to make a DSM of the point cloud with 1 m grid spacing. The first and only pulses were used for DSM.
2.1.3 Pre-storm image data
Pre-storm photogrammetric imaging was done in 2010 at 28th of April, when deciduous trees are gaining leaves. The flying height was approximately 7485 m above mean sea level giving a GSD of 45 cm. The camera used was a Vexcel Imaging UltraCam Xp, and pansharpened level 3 images were used. The forward overlap was 60% and the side overlap was 32%.
2.2 Photogrammetric processing
The data was processed using a Bae Systems Socet Set photogrammetric software (Version 5.5.0.201101 ).
In the case of after-storm data, the orientations were calculated for a sub-block with five image strips. 26 ground control points were taken from the ALS point cloud and the ALS intensity image. Automatic tie points were then extracted and the orientations were determined using a bundle block adjustment. The registration quality of the ALS and photogrammetric data was estimated to be approximately 1 m. Details of the processing are given by Honkavaara et al.,(2013).
Orientations of the before-storm images were determined for a small block with three image strips and 9-13 images per strip. For this image block we used altogether 11 ALS XYZ GCPs with a priori standard deviations of 1 m in all coordinates. We extracted 145 tie points per image by automatic image matching. We did not have a priori orientation information for this image block. The standard error of unit weight was 0.202 pixels and the root-mean-square residuals were 0.440, 0.678 and 0.768 m for X, Y and Z, respectively.
SOCET SET Next Generation Automatic Terrain Extraction software (NGATE) (DeVenecia et al 2007, Socet Set 2009) was used to generate DSMs. The matching strategy employs the edge and correlation matching methods and applies image pyramids and back matching. Different predefined and self-tuned strategies were tested. Finally, one of the default NGATE
strategies, “ngate_urban_canyon.strategy,” was selected as the
method to be used in this investigation, because it appeared to provide the highest success rates in matching in forest areas. DSMs were generated in an irregular point-network (TIN) format of the NGATE software, with a point interval of 1 m and with a no-thinning option. The process is explained in more detail in (Honkavaara et al. 2013). This methodology was used to process after-storm and before-storm imagery into surfaces that are referred to as NGATE surfaces in the following parts of the study. UltraMap point cloud has point spacing of 32 cm according to the imagery GSD. To be able to compare the surfaces from the two photogrammetric point clouds, we have thinned the points with LasTools using the thin_with_grid filter with grid size of 1m before computing the surface grid for the point cloud. The surfaces generated with this method are referred to as UMD (UltraMap dense) surfaces in the following parts of the study.
2.3 Computation of the surface grids
The LasTools blast2dem (Isenburg, 2013) function was used to make a grid DSM of the point cloud with a 1 m grid spacing. All of the point clouds from different sources were processed with the same function and the same size, grid cell size, and limiting lower left coordinates of the resulting DSM were given. Further registration was not performed.
3. DIFFERENCE SURFACES IN DAMAGE DETECTION
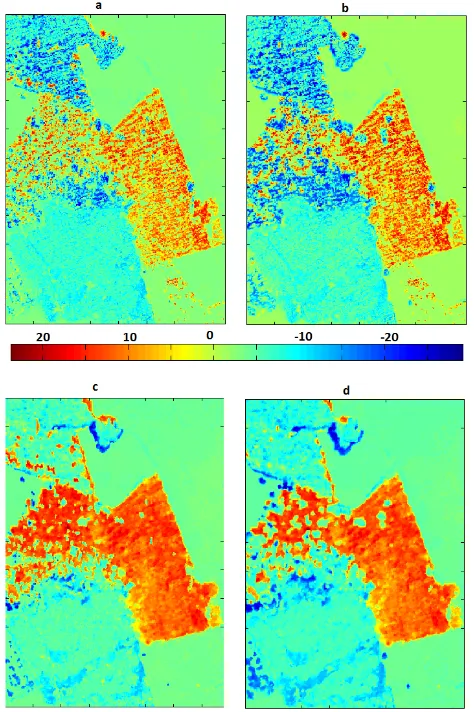
Four different difference surfaces were computed. They were:
a) ALS (2008) – photogrammetric UMD (2011) b) ALS (2008) – photogrammetric NGATE (2011) c) Photogrammetric NGATE (2010) – photogrammetric
UMD (2011)
d) Photogrammetric NGATE (2010) – photogrammetric NGATE (2011)
These surfaces are shown in Figure 1 for the total area under study.
Figure 1. Difference surfaces from left: a)ALS – after-storm UMD, b) ALS – after-storm NGATE, c) pre-storm NGATE – after- storm UMD, d) pre-storm NGATE – after-storm NGATE. The colour bar at the bottom shows the height colour coding.
Different nature of ALS and photogrammetric surfaces is useful in the interpretation of the difference surfaces of Figure 1. In Figure 1 a) and b), the forested areas are visible, and this makes the difference surface usable without map. In Figure 1 c) and d), both of the surfaces are photogrammetric, and only the forest edges are visible – the division between field and forest patches is not as clear as in the Figure 1 a) and b).
Figure 2. Left: after-storm imagery. Right: pre-storm imagery (Copyright for after-storm aerial images: Blom Kartta Oy©, Copyright for
before-storm images: National Land Survey©).
Figure 2 illustrates a small area with a variety of different items: fallen trees, logging, field, and forest are shown in the after-storm and pre-after-storm images. In Figure 2, the poor imaging conditions in the after-storm image are visible. The shadows are very long due to the extremely low solar elevations (5-7o) and the ground is covered with snow. The images show a logged area on the right side of the picture.
Figure 3. Difference surfaces from the area of Figure 2. a) ALS
– after-storm UMD b) ALS – after-storm NGATE c) pre-storm NGATE – after-storm UMD d) pre-storm NGATE – after-storm
NGATE. The colour bar in the middle shows the height colour coding.
The essential information on the height change from damage view-point is the same in all of the comparisons between pre-storm and after-pre-storm surfaces in Figure 3. There are changes in the detail and especially in the visibility of small changes. Surfaces in Figures 3c) and 3d) that show comparison between photogrammetric models show the edges of the forest areas visible as lines in both UMD and NGATE surfaces. This is probably a sum of multiple factors including different viewing angles and heights, registration errors in the imagery and different lighting conditions.
The ALS and the photogrammetric surfaces are different in the penetration to the forest ground. In ALS data, there are more hits from the forest floor inside the forest than in photogrammetric data. When the NGATE and UMD surfaces are compared, the UMD surface is closer to the ALS – it shows sharper tree and forest edges than the NGATE surface. International Archives of the Photogrammetry, Remote Sensing and Spatial Information Sciences,
Figure 4. Example of surface height profiles in the area of Figures 2 and 3. An intact area in forest is marked with 1. In the
area marked with 2, the pre-storm NGATE surface is high and the others low, this could be a place where windfall has occurred. In the area marked with 3, thinning has probably taken place between the ALS and the pre-storm NGATE, and
the storm has finished most of the trees that were left after thinning. The area marked with 4 shows how the UMD surface
forms steeper edges than the NGATE surface.
In Figure 4, a profile of the example area in Figures 2 and 3 is shown. The profile goes from bottom to top in the forested area to the left in Figure 2. In Figure 4, the ALS data has the largest variability in height. The UMD surface has more height variability than the NGATE surfaces, which tend to keep to the top part of the canopy.
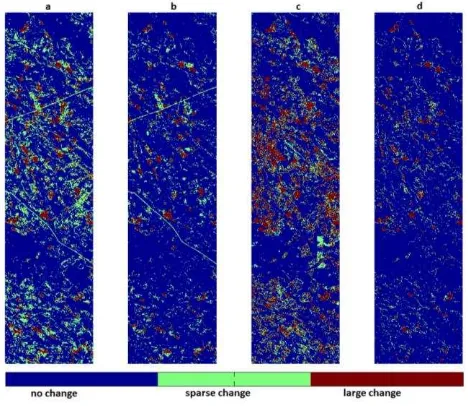
3.1 Classification
We have developed a classification method for the difference surface between ALS and NGATE surfaces in (Honkavaara et al 2013). Using this method, we computed pixel wise classifications for each of the difference surfaces in Figure 1. The method classifies the surface into three classes: ‘no change’,’ sparse change’ and ‘large change’.
Figure 5. Classification of the surfaces: blue –‘no change’, green –‘sparse change’, dark red –‘large change’. Surfaces from left: a) ALS-after-storm UMD, b) ALS – after-storm NGATE, c) pre-storm NGATE – after-storm UMD, d)
pre-storm NGATE – after-storm NGATE
The main steps of the classification are enhancement of pixels with height change (large in earlier data and small in later data), averaging and thresholding. Two different sets of classifications with different parameters are made and then combined to find both sparse- and large changes. The classified surfaces are
shown in Figure 5. The classification method was developed with the ALS – after- storm NGATE data, so naturally it works well with that data (Figure 5 b).
We studied the difference surfaces together with classified surfaces in 70 squares of 100 x 100 m that are located in forested areas in the ALS data. We had a visual classification of the squares from the after-storm images.
3.2 Performance assessment
The classifications of Figure 5 were used in Table 1 so, that
both ‘sparse change’ and ‘large change’ were combined into ‘change’ and the classification of a test square was ‘change’ if
over 10% of the pixels inside were classified to ‘change’. The upper figures in Table 1 are for class ‘change’, and the lower ones for ‘large change’ with the same 10% of the square criterion as for the change class.
Table 1. Percentage of test squares classified as changed with different surface combinations. a) ALS – after-storm UMD, b) ALS – after-storm NGATE, c) pre-storm NGATE – after-storm UMD, d) pre-storm NGATE – after-storm NGATE. The upper figures are results for classification into any change class, lower bold figures apply for classifications to the class ‘large change’.
fallen trees test areas a % b % c % d %
In Table 1 and Figure 5, it can be seen, that the performance of the classification method is far from optimal for the UMD surfaces a) and c). The number of changed pixels is too large for usability. The differences in the logged areas in Table 1 are caused by the fact that three of the eight areas marked as logged using the after-storm imagery had been logged before the pre-storm imagery was taken, thus there is no change in the height between the pre- and after-storm surfaces c) and d) in these areas, and the 63% result in the Table 1 is the best that can be achieved.
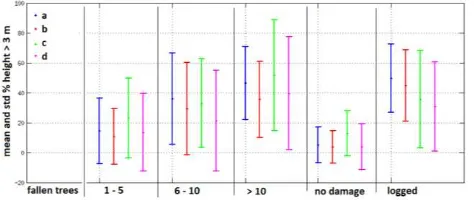
3.3 Height distribution
The height distribution in the four different difference surfaces was compared by computing the percentage of points above height 3 m in the difference surface in the test squares. The test squares were grouped to five different groups according to the
Figure 6. Mean percentage of height values above 3m in test squares of different damage groups. The test squares are
coloured with different colour for each surface.
It is evident from Figure 6, that with large number of fallen trees, the number of high height values in the difference surface increases and this is the base for the automatic storm damage photogrammetric surface generation methods Socet Set NGATE and Ultra Map dense matching (UMD) was that the UMD surface made steeper height changes than the NGATE. This was visible in the forest areas. The difference in the surfaces did not affect the visibility of the ‘large change’ areas (>10 fallen trees in ha) in the difference surfaces. The UMD appeared to provide slightly better results in cases where there were less changes in the forests (less than 10 fallen trees in ha).
The used classification method was designed with a difference surface ALS – NGATE. The method performed surprisingly well with the tested materials, but we expect that better results could be obtained by selecting the parameters based on the data set. Automating the parameter selection process will be of importance. Our future study in this topic will further develop the classification method. So far, a simple approach which mainly demonstrates the usability of the surface difference has been used. With a more sophisticated method, we expect better results.
Important further evaluations include the impact of DSM generation method to the result as well as further tuning of parameters of the change detection method. However, the data was with 44 - 45 cm GSD and collected from a flight altitude of 7400 m above the terrain level so this is very extreme data to be used. Furthermore, the forward overlaps of the data were 60%, which is not ideal for dense surface model generation.
As the final conclusion we would like to emphasize that the high-altitude photogrammetric imagery and automated digital surface model generation are promising and cost-efficient tool for operational, automatic storm damage detection process. The further advantage of the imagery is that it can be used for
training the automatic damage detection method and for quality control purposes.
4.1 Acknowledgements
We thank Blom Kartta Oy for the after-storm imagery and for providing the UltraMap dense DSM of the study area, and the National Land Survey for the laser scanning data and the before-storm photogrammetric image data. The research carried out in this study was funded by the Finnish Ministry of to Generating and Processing High Resolution Elevation Data
with Imagery. In Photogrammetric Week’07; Fritch, D., Ed.;
Wichmann Verlag: Heidelberg, Germany, pp. 297–308.
Hirshmüller, H., 2011 Semi-Global Matching: Motivation, Development and Applications. In Photogrammetric Week; Fritsch, D., Ed.; Wichmann Verlag: Heidelberg, Germany, pp. 173–184.
Honkavaara, E., Markelin, L., Rosnell, T., Nurminen, K., 2012. Influence of solar elevation in radiometric and geometric performance of multispectral photogrammetry. ISPRS J.
Photogramm., 67, pp. 13–26.
Honkavaara E., Litkey P., Nurminen K., 2013. Automatic Storm Damage Detection in Forests Using High‑ Altitude Photogrammetric Imagery. Remote Sensing. 5(3), pp. 1405-1424. airborne laser scanning. Remote Sens. 4, pp. 1190–1207.
Isenburg, M., 2013. LAStools—Efficient Tools for LiDAR Processing; Version 130126. Available online: http://lastools.org (10 April 2013).
Järnstedt, J., Pekkarinen, A., Tuominen, S., Ginzler, C., Holopainen, M., Viitala, R. 2012. Forest variable estimation using a high-resolution digital surface model. ISPRS J.
Photogramm. 74, pp. 78–84.
Karjalainen, M.; Kankare, V.; Vastaranta, M.; Holopainen, M.; Hyyppä, J. 2012. Prediction of plot-level forest variables using TerraSAR-X stereo SAR data. Remote Sens. Environ. 117, pp. 338–347.
Leberl, F.; Irschara, A.; Pock, T.; Meixner, P.; Gruber, M.; Scholz, S.; Wiechert, A. 2010. Point clouds: Lidar versus 3D vision. Photogramm. Eng. Remote Sensing, 76, pp. 1123–1134.
Microsoft UltraCAM. Available online: http://www.microsoft.com/ultracam/en-us/default.aspx
(accessed on 5 March 2013).
Rahman, M. 2011. Integration of Remote Sensing and GIS for Tree Damage Estimation from Natural Disasters. In Proceedings of 34th International Symposium on Remote Sensing of Environment, The GEOSS Era: Towards Operational Environmental Monitoring, Sydney, NSW, Australia, 10–15 April 2011.
Vastaranta, M., Korpela, I., Uotila, A., Hovi, A., Holopainen, M., 2011. Area-Based Snow Damage Classification of Forest Canopies Using Bi-Temporal Lidar Data. In Proceedings of the ISPRS Workshop on Laser Scanning, Calgary, AB, Canada, 29–31 August 2011.