ON THE ACCURACY OF INDIVIDUALS’ ORIENTATION AND COGNITIVE MAPS
V. Rautenbach a ,*, A. Çöltekin b, S. Coetzee a a
Centre for Geoinformation Science, Department of Geography, Geoinformatics and Metereology, University of Pretoria, Pretoria, 0002, South Africa – [email protected], [email protected] b
GIScience Center, Department of Geography, University of Zurich, CH-8057, Zurich, Switzerland – [email protected]
Commission II, WG II/6
KEY WORDS: visual complexity, 3D city model, level of detail, cognitive map
ABSTRACT:
In this paper we report results from a qualitative user experiment (n=107) designed to contribute to understanding the impact of various levels of complexity (mainly based on levels of detail, i.e., LoD) in 3D city models, specifically on the participants’ orientation and cognitive (mental) maps. The experiment consisted of a number of tasks motivated by spatial cognition theory where participants (among other things) were given orientation tasks, and in one case also produced sketches of a path they ‘travelled’ in a virtual environment. The experiments were conducted in groups, where individuals provided responses on an answer sheet. The preliminary results based on descriptive statistics and qualitative sketch analyses suggest that very little information (i.e., a low LoD model of a smaller area) might have a negative impact on the accuracy of cognitive maps constructed based on a virtual experience. Building an accurate cognitive map is an inherently desired effect of the visualizations in planning tasks, thus the findings are important for understanding how to develop better-suited 3D visualizations such as 3D city models. In this study, we specifically discuss the suitability of different levels of visual complexity for development planning (urban planning), one of the domains where 3D city models are most relevant.
1. INTRODUCTION
Developing countries are affected by numerous socioeconomic problems, such as poverty, poor social services, lack of infrastructure for human development, and serious resource depletion, often as a consequence of inadequate planning. Development planning (i.e., urban planning) is globally very important for sustainable progress in all these areas, and this is especially true in developing countries. Geographic visualizations are an essential component of such planning processes. For example, in our case study area (South Africa), two-dimensional (2D) maps are frequently used for development planning. However, in a recent study, Clarke (2007) documented that development planning professionals in South Africa have a low level of functional map literacy. This indicates that the planners were not able to effectively read these abstract 2D maps, which, in turn, negatively impacted critical planning processes. Therefore, Clarke (2007) suggested that alternative new visualizations (which may suffer less from this lack of map literacy) should be investigated for development planning.
The Internet and other related technologies brought about many new methods of geovisualization and data exploration, such as virtual globes (e.g., Google Earth, NASA World Wind), interactive online maps (e.g., Google Maps and OpenStreetMap), 3D virtual city models (Morton et al., 2012) and many others. Similarly, cities have been represented in various formats, e.g., 2D maps, 3D physical scale models, and various 3D digital representations (Morton et al., 2012). The popularity of 3D city models and their applications is rapidly increasing (van Lammeren et al., 2005; Wen et al., 2010; Gröger and Plümer, 2012; Semmo et al., 2012; Glander et al., 2009). These 3D city models have been reported to be successful for development planning by various experts (Wu et
al., 2013; Chen, 2011; Isikdag and Zlatanova, 2010; Wu et al., 2010).
knowledge in memory that can be mentally inspected (Tversky, 1993). These cognitive maps serve as a survival mechanism that allows us to navigate in unfamiliar territory (Lynch, 1960; Henry, 1992).
This paper presents results from a qualitative/observational user experiment to evaluate the influence of the visual complexity of 3D models on an individual's orientation and cognitive map after being exposed to unfamiliar virtual environments in a walkthrough. The results contribute to hypothesis building for future experiments. The remainder of the paper is structured as follows: in section 2, a brief background on measuring the accuracy of orientation and cognitive maps, levels of detail (LoD) and related work is provided; in section 3 the methodology is described; in section 4 the results are presented and discussed; and section 6 offers conclusions.
2. BACKGROUND
2.1 Measuring the orientation ability and cognitive maps Spatial cognition deals with the acquisition, organization, utilization, and application of knowledge about phenomena in the physical world (Bodine, 2006); thus it is intertwined with processes of thinking, reasoning, memory, abstraction, problem solving, perception, sensation, belief, and language (Burgess, 2008). With this in mind, Tversky (1993) argued that the cognitive map is rather a cognitive collage. The knowledge we collect about unfamiliar environments is unquestionably rich and complex. This so-called cognitive collage contains spatial memories, e.g., routes previously taken, things we have seen, heard or read about, and information about the weather, to name a few. Many of these spatial memories have a 3D component as we experience the world in a “first person view”. Therefore, 3D spatial memory is important in our everyday life. For example, the ability to navigate from one point to another within a shopping centre requires 3D processing in the brain (Vidal and Berthoz, 2005). Due to the richness of spatial memories, Lynch (1960) found that it is almost impossible to be truly lost within a city. However, even if we are never “truly lost”, a moment of disorientation can lead to severe anxiety, depending on the personality traits, or induced by the contextual circumstances (Cubukcu, 2011). A better understanding of our spatial experiences, e.g., through a study of how we form cognitive maps, might be a key approach in (eventually) addressing some of these anxieties. Canter (1977) suggested obtaining people’s cognitive maps by asking them to sketch a plan. This is an information rich method, since it includes the sizes of the individual spaces, their relative location to each other, and specific details or landmarks. However, sketching can be challenging for some: the participant is required to convert a 3D cognitive map into a 2D plan. This 3D-to-2D conversion (perspective transformation) may be difficult for some individuals. In other words, even though they might have a perfect 3D cognitive map, transforming it into a 2D plan on paper could be challenging.
To address the shortcomings about 2D-3D perspective transformation, Okabe et al., (1986) utilised an indirect method for measuring the accuracy of cognitive maps and eliminating errors present in sketches. This method is known as the “point in the direction” technique. With this method, participants move within an environment and at an explicit point they are asked to point in the direction of a specific object or place that was previously passed. The object or place (target) would no longer be in sight, and the participants would need to rely on their
cognitive map for the location of the target. To add another level of complexity, the participants can also be asked to estimate the straight line distance (as the crow flies) from their current location to a specified target (Okabe et al., 1986; Henry, 1992). While both point-in-the-direction and distance estimation allow collecting information related to cognitive maps, overall these methods allow less information to be derived in common approach to manage the LoD of a 3D model (which is the foundation of all virtual environments) is controlling the number of polygons that construct an object. For example, “distance to the viewer” is among the most established spatial criteria, i.e., a 3D object’s complexity (number of polygons) is intentionally decreased as it moves further away from the camera or viewer. In city models, LoD is a standardized concept for defining levels of complexity when representing geographic objects (Biljecki et al., 2013). These standardized LoD definitions are used in 3D modelling as a mechanism for describing product specifications (and to facilitate the acquisition process) and as a step for generalization.
In the experiment described in this paper, the Open Geospatial Consortium (OGC) CityGML definition of LoD is used. The CityGML standard differentiates five consecutive LoDs for urban models with increasing complexity and granularity regarding both their geometric representation and their thematic differentiation (OGC, 2008). The LoDs are defined ranging from level 0 to 4:
•LoD0 – regional, landscape: This is the coarsest level. It is essentially a two and a half dimensional (2.5D) digital terrain model that can be draped with aerial imagery to create a more realistic view
•LoD1 – city, region: Level one consists of well-known block models comprising prismatic buildings with no (or flat) roofs
•LoD2 – city districts, projects: This level adds differentiated roof structures and thematically discrete surfaces.
•LoD3 – architectural models (outside), landmarks: Level three denotes architectural models with detailed wall and roof structures, balconies, and bays to name a few. At this level, the outside architecture of the buildings should be consistent with the real world object. In addition, detailed vegetation and transportation objects are components of a LoD3 model
•LoD4 – architectural models (interior): Level four adds interior detail to the model, such as number of rooms, interior doors, stairs and furniture to the building.
The CityGML LoD definition has been criticised (Fan and Meng, 2012; Biljecki et al., 2013), however this definition is currently the only one that is standardised by either the International Organization for Standardization (ISO) or the Open Geospatial Consortium (OGC) and will be used as the main differentiator between the various levels of visual complexities used in this experiment.
2.3 Related work
accuracy and speed of participants. 54 undergraduate students were taught an urban route either while watching a moving dot on a map (survey perspective, i.e., aerial or top view), or following an avatar through a virtual navigation (route perspective, i.e., first-person or street view). Results suggest that the route perspective is “more functional to navigation” while survey perspective provides a more complete environmental representation (Pazzaglia and Taylor, 2007). In a similar study, Hund and Minarik (2006) asked participants to navigate through a city model using landmarks (e.g., turn towards the church on Stead Ave) or cardinal (e.g., go north on Stead Ave) directions. They concluded that participants who were given cardinal directions completed the tasks faster and more precisely than the landmark directions group, though these results should be interpreted carefully as there may be cultural differences in utilizing cardinal directions.
In another study conceptually similar to ours, Cubukcu (2011) reports the effect of visual detail in virtual environments on participants’ spatial performance when they estimate direction and distance (straight-line and walking distances), and produce a sketch. In the experiment, 49 participants were exposed to a small virtual environment generated with low (portrayed with four colours) and high (using textures) visual detail. The authors did not observe a significant effect on spatial performance based on the tested high or low visual detailed environments, suggesting that for certain tasks and user groups, a low-detail visualization may suffice (Cubukcu, 2011). While Cubukcu (2011) did not observe a difference between the two levels of detail for the tasks she tested, some studies suggest that visualizing too much detail can impair memory in some tasks (Borkin et al., 2011). Conversely, this memory related finding does not seem to apply in all cases. For example, Cockburn (2004) investigated the effect that 2D and 3D have on spatial memory where letters and flags were presented to the participants in 2D and in 3D. This study demonstrated that letters were recalled easier than flags because the participants can rely on mnemonics, but 3D made did not impair or improve the effectiveness of spatial memory for this task.
3. METHODOLOGY
A qualitative user experiment was conducted in this study where tasks were delivered in a classroom, supported by answer sheets. The goal was to observe the impact of various visual complexity levels and the training effect on the accuracy of a participant’s orientation and cognitive map.
3.1 Participants
107 undergraduate students (51 males, 56 females) participated in the study. The majority of the students were from the Science Faculty. Other students were from the Education, Engineering, Built Environment and Information Technology Faculties. Refer to Figure 3 for a detailed breakdown of degree programs. The participant age varied from 18 to 25 years, with an average age of 20 years. This student population was targeted purposefully as we consider them future professionals (and community members) in the domain of interest (development planning). The experiment was repeated with three groups of students (44, 25 and 38) on three different days.
3.2 Study design and materials
The study was designed to observe the impact of different levels of visual complexities and the effect of training on the accuracy of the participants’ orientation and cognitive maps. The visual
complexity can be defined based on various computational and human factors (Schnur et al., 2010). In this study it was defined with reference to different CityGML-related LoDs (LoD1, LoD2, and LoD3), the extent of the area covered, the number, structure and density of objects, number and type of landmarks and the camera angle in the virtual environments. For simplicity, we will refer to different levels as Visual Complexity 1 (VC1), VC2 and VC3.
The number, structure and density of objects as well as the extent of the area of interest, varied over the three models (see Table 1). The structure of the VC1 model was simplistic (consisting of basic geometric objects) and covered a small area (Figure 1). The VC2 was a model of Alexanderplatz, spread over a larger area with prominent landmarks of different heights and form, such as the Berliner Fernsehturm and the Berliner Dom (Figure 2). The VC2 model covered the largest area, 1,403 km2. The VC3 was a model of Ettenheim, a compact town with unobtrusive landmarks but more detailed building representations and street furniture (Figure 4). The VC3 model covered an area of 0.795 km2.
VC1 (abstract)
VC2 (Berlin)
VC3 (Ettenheim)
Level of detail (LoD)
LoD1 LoD2 LoD3
Number of objects 6 Around 100 Around 100 Extent of area of
interest
-- 1,403 km2 0,795 km2
Density of objects Low Medium High (smaller area) Structure of
objects (variation and landmarks)
Limited variation
Moderate variation
Some variation (less than VC2)
Table 1. Visual complexity levels in this experiment.
Figure 1. Top-view of the VC1 model.
Figure 3. Degree programs participants are enrolled in.
Figure 4. The VC3 model: Oblique view of Ettenheim, Germany (Source: CityGML).
The VC1 model was an artificial model created in Trimble SketchUp (http://www.sketchup.com/), consisting of six basic geometric objects that represent buildings in LoD1. Five of the objects in the model had the same height, while the sixth object was a composite building and had two distinctly different heights (on the right in Figure 1). The VC2 and VC3 models were obtained from the CityGML project website (http://www.citygml.org/).
Note that while Figures 1, 2 and 4 show screenshots, during the experiment, the visualizations were dynamic, i.e., pre-recorded videos of about one minute of each model were shown to participants. The first two videos were presented from a pedestrian perspective and the third from a 45 degree bird’s eye view to observe participant behaviour under various conditions.
3.3 Procedure and tasks
The experiment consisted of three interactive question and answer sessions (similar to focus groups), including the video presentation of the three visualizations, and the sketch production. Each participant received an answer sheet. The instructor presented questions one-by-one and asked the participants to write down their answers on the sheet before proceeding with the next question. The experiment consisted of six parts. For simplicity, we refer to them as Task1 to Task6. Task1 and Task2 gathered basic demographic data (e.g., age, gender, expertise, experience with computer games and similar) and the participants’ self-assessment of their spatial abilities. Responses were provided by participants on printed answer sheets. The remainder of the session was structured as follows:
•In Task3, the participants were asked to indicate the direction of two well-known buildings on campus while sitting in a lecture hall. The main campus was their home
campus, thus it was a familiar environment. They were all facing the same direction and were asked to indicate the direction of two buildings (e.g., to the left when facing the front of the lecture hall) from their memory on the provided diagram (illustrated in Figure 5).
Front
Left Right
Behind
Figure 5. The diagram for marking the directions for Tasks 3, 5 and 6. Each zone corresponds to an area of approximately 45o.
•In Task4, the participants were shown a short video clip where the camera traversed through a virtual environment consisting of six basic geometric objects or buildings in the VC1 model (refer to Figure 1). Afterwards, the participants were requested to draw a 2D sketch map of the environment depicted in the video. This task was based on Canter’s (1977) method to evaluate a person’s cognitive map, and their ability to convert a 3D cognitive map into a 2D map. •For Tasks 5 and 6, two videos were used; one for VC2 and
another for VC3. Before the video was started, the moderator indicated and verbally described three landmarks (prominent features) visible in the overview of each virtual environment. A short walkthrough of the environment from a pedestrian perspective for Task5 and a flythrough from a 45 degree bird’s eye view (approximately 5m above the surface) for Task6 followed. At two predefined points in the video, the video was stopped and the participants were requested to indicate the direction of one of the landmarks from the current (virtual) location, using the diagram (Figure 5). This task was prepared on the basis of the Okabe et al., (1986) “point in a direction” method.
4. RESULTS AND DISCUSSION
Results of Task1 (demographic information) are reported in Section 3.1. Participants. Responses to Task2 indicate that the majority of participants do not interact daily with video games or computer simulations (less than 30% of the participants reported daily interaction with video games or computer simulations). Additionally, in Task2 (self-reported spatial ability), participants were asked to rate their sense of direction between 1 (extremely poor) and 5 (excellent). 42% of the participants rated themselves at a 4; that is, just below excellent (refer to Figure 6). They were also asked to rate the frequency of their disorientation. 39% of the participants rated themselves at a 3 which is the equivalent of being disorientated often (refer to Figure 6). When these results are compared, it can be seen that most participants feel that they have a good sense of direction, but paradoxically, they also feel disorientated frequently.
Figure 6. Graph depicting the participants’ sense of direction and their frequency of disorientation.
Table 2 provides an overview of the different factors and visual complexities in Tasks 3 to 6. Task3 is included for reference, even though it is not a 3D model but the ‘real world’. We believe it provides a more reliable indication of participants’ sense of direction than the self-reported measure.
Tasks Perspective Pedestrian Pedestrian Pedestrian Oblique (45o) Tasks Orientation Sketch Orientation Orientation Training* None None Medium Most * Training refers training received prior to the experiment and also during, considering the learning effect for example.
Table 2. Overview of the study.
As detailed in Section 3.3. Procedure and Tasks, for Tasks 3, 5 and 6 participants were asked an orientation question, where they marked the direction of an object that was not visible in the scene (for Task3, two campus buildings in relation to their current position, for Tasks 5 and 6, virtual landmarks in relation to their current virtual position). Only one of the blocks would apply (i.e., there was only one correct answer) and the 45 degree zone provided a large buffer. Note that this type of task is
considered easier than the 3D to 2D transformation used in Task4 (Okabe et al., 1986; Henry, 1992). Slightly less than half of the participants identified the direction accurately (47%) in Task3 where they had to rely on their cognitive map of the university campus (familiar to all participants) when asked to point to a building with its name. This can most likely be attributed to the participants having overall poor spatial orientation ability (despite their optimistic self-assessment, see Figure 6), especially since the majority were also not able to perform the other tasks successfully. Two individuals were identified who performed poorly in Task3, but performed all subsequent tasks correctly. These individuals may not pay attention to their daily surroundings in the ‘real world’, but when instructed, they appear to perform well (refer to Figure 7). The group setting of the experiment was another factor that could have contributed to the low performance, as the participants might not have given their full attention during the experiment. Kirasic et al., (1984) also suggested that if the participants frequently visits or walk by a specific landmark, they might not be able to recall the landmarks location or direction to the landmark. 75% of participants that correctly performed Task3 were also able to perform Task6 accurately.
Figure 7. Percentage of accurate responses for Tasks 3, 5 and 6.
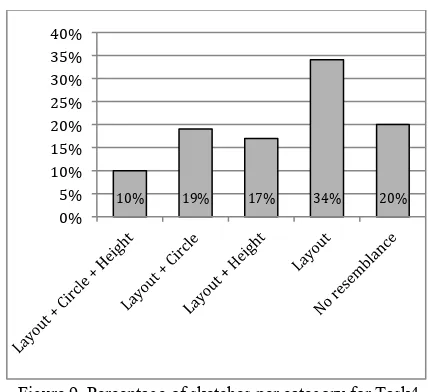
In Task4, the participants were asked to draw a 2D map (sketch) of the environment (plan view) that they viewed in the video. Based on an analysis of three elements (layout, circle and height) on the sketches, responses were divided into the five sketch categories listed below (refer to Figure 8). A sketch that includes the layout, the circle and the height difference is regarded as correct. We categorized the sketches that participants produced based on the following criteria:
Figure 8. Examples of the different categories for the sketch (Task4).
Figure 9. Percentage of sketches per category for Task4 (sketching VC1).
The participants were expected to have relatively good spatial abilities, as they are studying in fields that would require good spatial skills. However, in this study, it appears that, overall, the orientation tasks were challenging for the participants, even in a familiar ‘real world’ environment (with a success rate of only 47%). Orientation capability deteriorated in the subsequent task in an unfamiliar virtual environment with VC2 (34%). An overall improvement in the next task (42%) despite increasing complexity (VC3) suggests that training may be helpful. Nonetheless, the latter did not equal the success rate of the ‘real world’ task with the familiar campus buildings. In this study we did not observe any correlation between the participants’ performance and their frequency of interaction with video games and computer simulations. However, an interesting observation was that the participants significantly overestimated their own spatial abilities: 64% of the participants rated their sense of direction as above average (refer to Figure 6). However, at most only 47% of participants were capable of completing a task successfully (refer to Figures 7 and 9). These results are further demonstrated with the low success rates in the sketch task, where the majority of the participants were unable to reproduce an accurate sketch of the virtual environment showing the essential elements of the layout, circle and height.
To reiterate the interpretation of our analysis a little more in depth; Task3 tested the participants’ general spatial orientation using their spatial knowledge of the university campus. Only 47% of participants were capable of correctly indicating the direction of a well-known building on campus. When exposed to the VC2 model (Task5, Alexanderplatz) and VC3 model (Task6, Ettenheim), the percentage of correct responses dropped to 34% and 42% respectively. A likely reason for the lower number of correct responses is the familiarity, or rather lack thereof, as mentioned earlier. Another reason could be that the verbal descriptions of landmarks were not as unambiguous as the buildings names (which participants already knew) used in Task3. A third reason could be that participants were distracted or not paying attention when the verbal descriptions were provided. While controlled studies are needed to pin down the precise cause of the observed effect, based on this qualitative study, we can report that inappropriately designed 3D models do affect the performance when using or interpreting the model for orientation (pointing task) and recall (sketch task).
5. CONCLUSION
To summarize, the aim of the qualitative experiment presented in this article was performed to better understand the effect of visual complexity levels in 3D city models on orientation and cognitive maps of individuals. Ultimately, the results will contribute to the hypotheses development for a series of controlled experiments to study the effect of visual complexity. The results of these experiments will contribute to the development of recommendations on the design and use of 3D models for development planning, building on the work of other researchers, such as Haeberling (2005; 2008), Döllner (2006; 2014) and Pasewaldt (2012). By understanding the effect of visual complexity in 3D urban models, we can better design and employ these models to ensure that all stakeholders (includes individuals with various levels of map literacy) are able to extract the required information for effective decision-making.
Our primary goal was to observe the effect that three different visualizations with varying levels of complexities have on the accuracy of the cognitive map when individuals are exposed to unfamiliar environments. The effect we observe is clear, however, the qualitative nature of this experiment does not allow us to determine the precise causes. All varied factors may have contributed to the observed effect to some degree, including a lower LoD and other design choices, such as the
10% 19% 17% 34% 20%
extent of the model (scale), scene complexity (number, structure and density of objects), the camera angle (perspective), familiarity, as well as training and the clarity of verbal instructions (building name in campus vs. a description of a building in the virtual representation). With the increasing popularity of 3D city models, it is important to understand the effect of design choices on people’s cognitive maps. When creating 3D city models for development planning, it is important to understand how to design these models. Literature suggests that inappropriately designed 3D models can cause anxiety, disorientation, frustration and stress that would affect the performance when using or interpreting the model (Cubukcu, 2011).
The methods used in this study are qualitative (it should be viewed similarly as focus groups) where we collected indications from the participants under conditions that were not strictly controlled. On the other hand, from the perspective of controlled studies, the methodology used in this study introduces various limitations. Primarily, it is important to note that between the compared visualizations, multiple factors were varied. Additionally, the increased complexity and size of the areas with each visual complexity level might have been too large. It is difficult to find a single area that would be appropriate for different visual complexity levels unless we use entirely artificial environments. Such approaches exist, and we will follow them also in the future for the sake of experimental control, however, we clearly lose some ecological validity as we move away from visualizations of real environments in which multiple things vary at the same time. This is a known trade-off in experimental science. Furthermore, the sample population (participants) was restricted to university students, most of them studying in geography-related domains. Despite the staggeringly low success rates over all conditions we tested; this group’s success may be “better” than the general population. In other words, they may be a self-selected group with higher-than-average spatial abilities and some of them had some exposure to video games and computer simulations. Additionally the two measurements (orientation task and sketch task) were not used in all tasks due to time restrictions; results could be enhanced if they had been measured for all conditions.
Further research should investigate the user experience with 3D city models from various aspects, such as colour schemes, light sources and different traversal techniques. In the next steps, we aim to test for individual factors (i.e., we will vary one factor at a time) to better identify the causes of the observed effect, which will complement this experiment and address the limitations otherwise identified in this paper.
REFERENCES
Biljecki, F., Zhao, J., Stoter, J., Ledoux, H., 2013. Revisiting the concept of Level of Detail in 3D City Modelling. ISPRS Annals of Photogrammetry, Remote Sensing and Spatial Information Sciences, II-2/W1, pp. 63–74.
Bodine, C., 2006. Assistive technologies in spatial environments. Cognitive Processing, 7(1), pp. 167–167.
Boér, A., Çöltekin, A., Clarke, K.C., 2013. An Evaluation of Web-based Geovisualizations for Different Levels of Abstraction and Realism – What do users predict?. In: Proc. of the 26th International Cartographic Conference, Dresden, Germany.
Borkin, M.A., Gajos, K.Z., Peters, A., Mitsouras, D., Melchionna, S., Rybicki, F.J., Feldman, C.L., Pfister, H., 2011. Evaluation of Artery Visualizations for Heart Disease Diagnosis. IEEE transactions on visualization and computer graphics, 17(12), pp. 2479–2488.
Burgess, N., 2008. Spatial cognition and the brain. Annals of the New York Academy of Sciences 1124, pp. 77–97.
Canter, D., 1977. The Psychology of Place, 1st Edition. Palgrave Macmillan.
Chen, R. 2011. The development of 3D city model and its applications in urban planning. In: 19th International Conference on Geoinformatics, IEEE, Shanghai, China, pp. 1– 5.
Clarke, D., 2007. Impact of map literacy on development planning in South Africa. University of Stellenbosch, South Africa.
Cockburn, A., 2004. Revisiting 2D vs 3D Implications on Spatial Memory. In: Proc. of the Fifth Conference on Australasian User Interface, Darlinghurst, Australia, pp. 25–31.
Coltekin, A., 2009. Space-variant image coding for stereoscopic media. In: 2009 Picture Coding Symposium, IEEE, Chicago, United States of America, pp. 1–4.
Coltekin, A., Reichenbacher, T., 2011. High Quality Geographic Services and Bandwidth Limitations. Future Internet, 3, pp. 379–396.
Courage, C., Baxter, K., 2004. Understanding Your Users: A Practical Guide to User Requirements Methods, Tools, and Techniques. Morgan Kaufmann Publishers, San Francisco, United States of America.
Cubukcu, E., 2011. Does the level of visual detail in virtual environments affect the user’s spatial knowledge?. Environment and Planning B: Planning and Design, 38, pp. 41–752.
Döllner, J., 2014. Service-Oriented Geovisualization for Geodesign. In: Proc. of Digital Landscape Architecture 2014. Berlin, Germany, pp. 43–45.
Döllner, J., Kolbe, T., Liecke, F., Sgouros, T., Teichmann, K., 2006. The Virtual 3D City Model of Berlin - Managing, Integrating and Communicating Complex Urban Information. In: Proc. of the 25th International Symposium on Urban Data Management UDMS, Aalborg, Denmark.
Fan, H., Meng, L., 2012. A three-step approach of simplifying 3D buildings modeled by CityGML. IJGIS, 26(6), pp. 1091-1107.
Glander, T., Peters, D., Trapp, M., Döllner, J. 2009. 3D wayfinding choremes: A cognitively motivated representation of route junctions in virtual environments. In: Lecture Notes in Geoinformation and Cartography, pp. 407–427.
Henry, D., 1992. Spatial Perception in Virtual Environments: Evaluating an Architectural Application. University of Washington, United States of America.
Haeberling, C., Bär, H. and Hurni, L., 2008. Proposed Cartographic Design Principles for 3D Maps: A Contribution to an Extended Cartographic Theory. Cartographica: The International Journal for Geographic Information and Geovisualization, 43(3), pp. 175–188.
Haeberling, C., 2005. Cartographic design principles for 3D maps – A contribution to cartographic theory. In: Proc. of the 22nd International Cartographic Conference, A Coruña, Spain.
Hildebrandt, D., Döllner, J., 2009. Implementing 3D Geovisualization in Spatial Data Infrastructures: The Pros and Cons of 3D Portrayal Services. Geoinformatik, 35, pp. 1–9.
Hund, A.M., Minarik, J.L., 2006. Getting From Here to There: Spatial Anxiety, Wayfinding Strategies, Direction Type, and Wayfinding Efficiency. Spatial Cognition and Computation, 6, pp. 179–201.
Isikdag, U., Zlatanova, S., 2010. Interactive modelling of buildings in Google Earth: A 3D tool for Urban Planning. In: Developments in 3D Geo-Information Sciences, Springer, pp. 52–70.
Kirasic, K.C., Allen, G.L., Siegel, A.W., 1984. Expression of Configurational Knowledge of Large-Scale Environments: Students' Performance of Cognitive Tasks. Environment and Behavior, 16(6), pp. 687-712.
Luebke, D., 2002. Level of Detail for 3D Graphics. 1st Edition. Morgan Kaufmann.
Lynch, K., 1960. The Image of the City. MIT Press.
Matatko, A., Bollmann, J., Müller, A., 2011. Depth Perception in Virtual Reality. In: Advances in 3D Geo-Information Sciences. Springer, pp. 115–129.
Morton, P.J., Horne, M., Dalton, R.C., Thompson, E.M., 2012. Virtual City Models : Avoidance of Obsolescence. In: Digital Physicality – Proc. of the 30th eCAADe Conference, Czech Technical University, Prague, pp. 213–224.
OGC, 2008. City Geography Markup Language (CityGML) Encoding Standard 1.0.0.
Okabe, A., Aoki, K., Hamamoto, W., 1986. Distance and Direction Judgment in a Large-Scale Natural Environment: Effects of a Slope and Winding Trail. Environment and Behavior, 18, pp. 755–772.
Ozawa, C.P., Seltzer, E.P., 1999. Taking Our Bearings: Mapping a Relationship Among Planning Practice, Theory, and Education. Journal of Planning Education and Research, 18, pp. 257–266.
Pasewaldt, S., Semmo, A., Trapp, M., Döllner, J., 2012. Towards comprehensible digital 3D maps. In: Service-Oriented
Mapping 2012. Jobstmedia Management Verlag, Vienna, Austria, pp. 261–276.
Pazzaglia, F., De Beni, R., 2006. Are people with high and low mental rotation abilities differently susceptible to the alignment effect?. Perception, 35, pp. 369–383.
Pazzaglia, F., Taylor, H., 2007. Perspective, Instruction, and Cognitive Style in Spatial Representation of a Virtual Environment. Spatial Cognition and Computation, 7, pp. 349– 364.
Rautenbach, V., Coetzee, S., Schiewe, J., Coltekin, A., 2015. An Assessment of Visual Variables for the Cartographic Design of 3D Informal Settlement Models. Accepted for 27th International Cartographic Conference, Rio de Janeiro, Brazil.
Rautenbach, V., Coetzee, S. and Coltekin, A., 2014. Towards evaluating the map literacy of planners in 2D maps and 3D models in South Africa. In: AfricaGEO 2014 Conference Proc., Cape Town, South Africa.
Schnur, S., Bektas, K., Salahi, M., Coltekin, A., 2010. A Comparison of Measured and Perceived Visual Complexity for Dynamic Web Maps. In: GIScience 2010, Zurich, Switzerland.
Schobesberger, D., Patterson, T., 2008. Evaluating the Effectiveness of 2D vs. 3D Trailhead Maps: A Map User Study Conducted at Zion National Park, United States. In: 6th ICS Mountain Cartography Workshop, Lenk, Switzerland, pp. 201– 205.
Semmo, A., Trapp, M., Kyprianidis, J.E., Döllner, J., 2012. Interactive Visualization of Generalized Virtual 3D City Models using Level-of-Abstraction Transitions. Computer Graphics Forum, 31, pp. 885–894.
Tversky, B., 1993. Cognitive maps, cognitive collages, and spatial mental models. In: Spatial Information Theory A Theoretical Basis for GIS. Springer, pp. 14–24.
Van Lammeren, R., Momot, A., Olde Loohuis, R., Hoogerwerf, T., 2005. 3D Visualization of 2D Scenarios 3D Visualization. In: Trends in Real-Time Landscape Visualization and Participation. Heidelberg: Wichman Verlag, pp. 132–143.
Vidal, M., Berthoz, A., 2005. Navigating in a Virtual 3D Maze: Body and Gravity, Two Possible Reference Frames for Perceiving and Memorizing. Spatial Cognition and Computation, 5, pp. 139–161.
Wen, W., Kjems, E., Bodum, L., Kolar, J., 2010. Dynamic features in a 3D city model as an energy system. In: ISPRS Archives of Photogrammetry, Remote Sensing and Spatial Information Sciences, XXXVIII-4/W15, pp. 73–78.
Wu, H., He, Z., Gong, J., 2010. A virtual globe-based 3D visualization and interactive framework for public participation in urban planning processes. CEUS, 34, pp. 291–298.