77
ENHANCEMENT OF PIXEL-VALUE-ORDERING BASED DATA HIDING BY ROW BLOCK PARTITION
Hendro Eko Prabowo and Tohari Ahmad
Department of Informatics, Institut Teknologi Sepuluh Nopember, Jl. Raya ITS, Keputih, Sukolilo, Surabaya, East Java, 60111, Indonesia
E-mail: [email protected]
Abstract
The development of information and communication technology that supports digital data transmission such as text, image, audio and video gives several effects. One of them is data security that becomes the main priority during the transmission process. Pixel-Value-Ordering (PVO) which is one of data hiding methods can be implemented to meet that requirement. It embeds data on maximum pixel and minimum pixel in a block which is a part of the carrier image. However, PVO has limitation, that only 2 bits per block can be hidden. To handle this problem, we propose a new approach by dividing blocks dynamically based on its complexity. These blocks are grouped into 4: smooth block, semi-smooth block, normal block and rough block. Using this method, the stego capacity can be improved up to 2.6 times in average from the previous one by keeping the quality stego more than 65 dB for all testing images.
Keywords: Data Security, Data Hiding, Pixel-Value-Ordering (PVO), Information Security
Abstrak
Perkembangan teknologi informasi dan komunikasi yang mendukung pengiriman data berbentuk media digital seperti teks, gambar, audio dan video memberikan beberapa efek. Diantaranya adalah keamanan data menjadi prioritas utama selama proses pengiriman. Pixel-Value-Ordering (PVO) yang merupakan salah satu metode data hiding dapat diterapkan untuk mendapatkan kebutuhan tersebut. Metode ini akan menyisipkan data pada piksel terbesar dan terkecil dalam sebuah blok yang menjadi bagian dari citra carrier. Namun PVO memiliki masalah dalam hal kapasitas penyisipan yang terlalu kecil, yaitu maksimal 2 bit per blok. Untuk mengatasi masalah ini, kami mengusulkan pendekatan baru dengan membagi blok secara dinamis berdasarkan kompleksitas blok tersebut. Blok ini dibedakan menjadi 4, yaitu smooth block, semi-smooth block, normal block, dan rough block. Dengan menggunakan metode ini, kapasitas dari citra stego dapat ditingkatkan rata-rata 2,6 kali lebih besar dibandingkan metode sebelumnya dengan tetap menjaga kualitas stego lebih dari 65 dB untuk semua citra yang digunakan.
Kata Kunci: Data Security, Data Hiding, Pixel-Value-Ordering (PVO), Information Security
1. Introduction
Data security has become one of the most important requirements in the progress of information and communication technology to transfer various data, for example audio, image, text and video. To satisfy this requirement, cryptography, steganography or their combination can be implemented in every data transmission [1, 2]. Cryptography itself is a process that changes data from readable data into unreadable data using encryption key [3], while steganography is a technique to hide data in a medium without harming the media.
There are many steganography methods which are being developed, e.g. Reversible Data
Hiding (RDH). It is able to embed data into the media, and then retrieve them using extraction algorithm without any defect [4, 5, 6]. This advantage makes RDH be one of the most commonly used methods for copyright and sensitive data protection such as military and medical data [7].
uses difference value of adjacent pixels to embed data. The higher of the difference, the greater of distortion of embedding media (stego) [9, 10].
Another RDH method with DE framework is proposed by Thodi et al [11] called Prediction-Error-Expansion (PEE). Before embedding the data, PEE predicts the change of the pixel value that is used in the embedding process. This method is further developed by Li et al [12] in Pixel-Value-Ordering (PVO) by implementing a sorting concept to calculate the prediction value. Here, the second largest pixel value is used to predict the highest pixel value (maximum pixel value) and the second smallest pixel value is used to predict the smallest pixel value (minimum pixel value). However, this method only embeds data whose prediction value is 1, and ignores other values (they are not used for embedding data). This weakness is overcome by Peng et al [13] that propose a new predicting method which is able to embed the prediction value by 1 and 0, and perform 1-shifthing of other values.
In that method, before embedding data, the carrier is divided into non-overlapping blocks
whose size is same. These blocks are divided into 2 type: smooth and rough type. Here, only smooth block is used to embed data that a block can carry maximum of 2 bits of data which is embedded to the minimum and maximum pixel values, while the other pixels are ignored. The larger block size leads to the decreasing of the stego capacity. This problem is also explained by Wang et al [14] that the performance of PVO depends on the block size being used. So, it is necessary to find out a better concept of block division to maximize the embedding capacity.
Based on that problem, we propose a new approach to enhance embedding capacity at PVO. This can be summarized as follows: First, we will calculate the block’s complexity using the new algorithm to increase the performance. Second, based on the block’s complexity value, we divide the block into some types. In this case, the higher of the complexity value, the smaller of the blocks embedding capacity. Also, the smaller of the complexity value means the pixel value is more distributed and the embedding capacity is higher. The blocks are grouped into 4 types: smooth block, semi-smooth block, normal block, and rough block. In this case, the rough block is not used for embedding data. This is done to keep stego image quality still good.
The paper structure as follows. Section 2 explains the related works. Section 3 describes our proposed method. The experimental result of the proposed method is provided in Section 4. Finally, it is concluded in Section 5.
Pixel Value Ordering (PVO) based Data Embedding
Pixel-Value-Ordering is firstly proposed by Li et al [12] by utilizing the sorting process to calculate a prediction value (expanded prediction error). It is used to embed data, so the stego image distortion can be kept low. In the first step, it is required to divide the carrier into blocks, 𝐼 = {𝐵1, … , 𝐵𝑛}. Every pixel in blocks {𝑃1, … , 𝑃𝑛} is sorted in ascending mode to obtain {𝑃𝜎(1), … , 𝑃𝜎(𝑛)} with
𝜎: {1, … , 𝑛} → {1, … , 𝑛} is a one-to-one mapping
161 162 163 162 162
161 162 163 164 162
161 161 163 162 162
161 162 163 163 162
161 162 164 163 162
sorting
161 162 163 162 162
161 162 163 164 162
161 161 163 162 162
161 162 163 163 162
161 162 164 163 162
161 162 162 162 163
161 162 162 163 164
161 161 162 162 163
161 162 162 163 163
161 162 162 163 164
Figure 1. Block complexity calculation
(a) (b)
(c) (d)
(e)
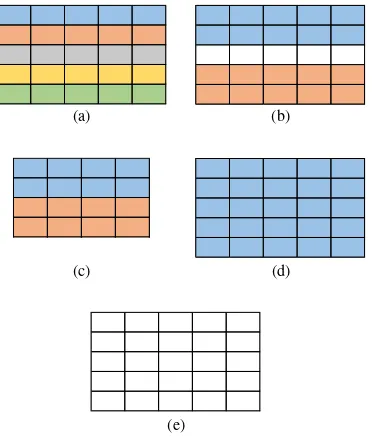
Figure 2. Block type (a) Smooth block (b) Semi-smooth block (odd) (c) Semi-smooth block (even) (d) Normal
function. Then, second largest pixel (𝑃𝜎(𝑛−1)) is used as a predictor for maximum pixel (𝑃𝜎(𝑛)). The prediction value is in equation (1).
𝒅 = 𝑷𝝈(𝒏)− 𝑷𝝈(𝒏−𝟏) (1)
After this value is obtained, data can be embedded with 𝑑 = 1. If 𝑑 > 1, then 𝑃𝜎(𝑛) is shifted 1 point and if 𝑑 = 0, then the pixel value does not change (𝑃′𝜎(𝑛)= 𝑃𝜎(𝑛)). This condition also applies to the smallest pixel value (minimum pixel). While for extraction process, the prediction value of 𝑃′𝜎(𝑛) can be taken using equation (1) whose predictor pixel is 𝑃′𝜎(𝑛−1). The data are extracted if only 𝑑′ ∈ {1,2} and the other 𝑑’ values are not data to be embedded. More detailed explanation of the extraction process is in [12].
Improve Pixel-Value-Ordering
This method is proposed by Peng et al [13] which is developed based on PVO, where it is processed by calculating the expanded prediction errorvalue. The development result on 𝑃𝜎(𝑛) is provided in equation (2).
𝒅 = 𝑷𝒖− 𝑷𝒗
Where
{𝒖 = 𝐦𝐢𝐧(𝝈𝒗 = 𝐦𝐚𝐱(𝝈(𝒏), 𝝈(𝒏 − 𝟏))(𝒏), 𝝈(𝒏 − 𝟏))
(2)
This development can utilize 𝑑 = 0 to embed data, so the embedding capacity increases. In this method, equation (2) is also implemented in minimum pixel (𝑃𝜎(1)) prediction. Similarly, in [12], the extraction process is also carried out by computing the predicted value of 𝑃′𝜎(𝑛) and 𝑃′𝜎(1) with the concept of equation (2). The data are only
extracted if 𝑑′∈ {1,2} for 𝑑′> 0 or 𝑑′∈ {0, −1}
for 𝑑′ ≤ 0 with 𝑑′ is expanded prediction error
from 𝑃′𝜎(𝑛) or 𝑃′𝜎(1). Further extraction process can be found in [13].
Dynamic Block Partition in PVO
This approach is proposed by Wang et al [14] which aims to enhance the performance of PVO. This is done by dividing blocks that used for data embedding according to block’s smooth level (NL). Its result determines the complexity of blocks which are then divided into 3 types.
Flat type is the smoothest block, which is able to carry more data. In this type, a block is divided into 2×2 sub-block which all are used to embed data. The maximum capacity of this type, whose size is 4×4, is 8 bits. The second type is normal block which is same as blocks in Peng et al [13] and Li et al [12] methods. The data embedding is carried out in maximum and minimum pixels whose capacity is 2 bits. The last type is rough block. It is not used for data embedding, so the pixel value before and after embedding are same.
2.
MethodsIn this research, we adopt Wang et al [14] concept that divides blocks into some sub-blocks. Different with that approach, we divide block into several groups based on its row. This is done because [14] causes uncertainty about the effect of block division, such as dividing blocks based on row-by-row in several block sizes (i.e. 𝒓 = 𝒄 ∈
{𝟒, 𝟓, 𝟔, 𝟕, 𝟖, 𝟗, 𝟏𝟎}, 𝒓 = row, 𝒄 = column). We
predict that if the image is divided based on column, the different value between one pixel and another pixel in the same column is high. It affects the stego image quality after embedding process. Carrier Divide Into Block
Embed Process
Complexity Calculation
Embedding Data
Create Location Map
Stego Image
Location Map
Data/Message
(a)
Stego Image
Divide Into Block
Extraction Process
Complexity Calculation
Extraction Data and Restoring Pixel Value
Stego Image
Data/Message Location Map
(b)
Calculating Block’s Complexity Value
In the first step, the proposed method divides carrier into non-overlapping blocks, 𝑰 =
{𝑩𝟏, … , 𝑩𝑵}. Every block is divided into several
sub-blocks based on its pixel complexity (∆) which can be calculated using equation (3).
∆=∑ | 𝐦𝐢𝐧(𝑷𝒓𝒊=𝟏 𝟐, … , 𝑷𝒌−𝟏𝒓) − 𝐦𝐚𝐱(𝑷𝟐, … , 𝑷𝒌−𝟏)| (3)
Here, 𝒊 is the rows index and 𝑷𝒌−𝟏 is the
second latest pixel from a row in a block. The example of block complexity is depicted in Figure 1 that shows a calculation process of block size of 5×5.
As shown in that figure, the first block is divided into 𝒓 blocks, in this case is 5 sub-blocks. Every sub-block is sorted in the ascending mode. The green pixel is one that is used for calculating the block complexity. In example, block complexity is 0.8.
Dividing Block Into Sub-Blocks
For dividing blocks, we differentiate them to several types using 𝑻 as the threshold of block complexity with following condition:
Smooth block
This type divides a block into 𝒓 sub-block if ∆≤𝑻𝟐. Every sub-block is used to embed data with
maximum capacity 𝟐𝒓 bits.
Semi-smooth block
Semi-smooth block is a block with condition 𝑻𝟐< ∆≤𝟑𝟒𝑻. Here, we divide a block into 2 sub-blocks equally. Every sub-block is used to embed 4 bits data.
Normal block
A normal block is not divided into sub-blocks. This block type is used in Peng et al method [13]. Normal block happens if 𝟑𝟒𝑻 < ∆≤ 𝑻 whose maximum capacity is 2 bits.
Rough block
A rough block occurs if 𝑻 < ∆ and this type is not used for data embedding. So, the block pixels do not change.
Those dividing schemes are used to achieve the high embedding capacity. More details of block partitioning process is presented in Figure 2. It is worth to note that semi-block is differentiated into 2: odd 𝒓 value and even 𝒓 value. Those semi-blocks can be seen in Figure 2(b) and 2(c) respectively.
Data Embedding, Extraction and Restoring Pixel Value
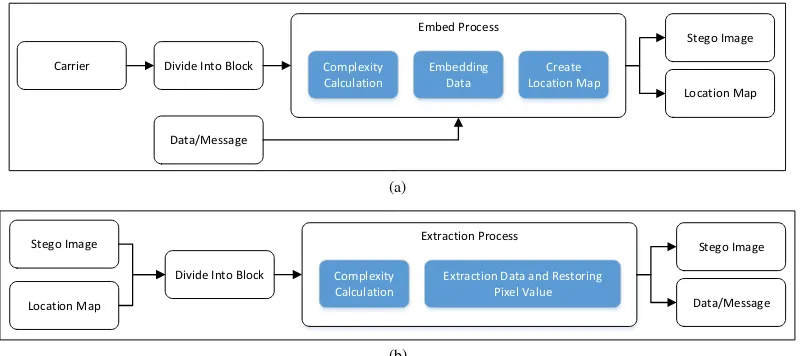
Data Embedding
This data embedding process uses the algorithm proposed by Peng et al [13]. Its process is briefly described in Figure 3(a), whose steps are as follows: (a) Partitioning carrier, this step dividing a carrier into non-overlapping blocks; (b) Building location map, location Map (LM) is used to mark blocks that cause overflow/underflow. LM value can be 1 for either overflow or underflow block, and 0 for others; (c) Calculating block complexity, sorting
161 162 163 162 162
161 162 163 164 162
161 161 163 162 162
161 162 163 163 162
161 162 164 163 162 sorting
160 162 164 162 162
160 162 163 165 162
161 161 163 162 162
160 162 163 164 162
160 162 165 163 162
stego block
161 162 162 162 163
161 162 162 163 164
161 161 162 162 163
161 162 162 163 163
161 162 162 163 164
original block
Figure 4. Example of embedding and extraction processes (a) Data embedding, (b) Data extraction
(a) (b) (c)
Figure 5. ‘Pepper’ Image. (a) Original image (b) Stego
the complexity of every block is calculated using equation (3). The calculation determines the block type and its capacity; (d) Embedding Data, this process is running based on the type of block that has been predetermined. The embedding process in every block is described as follows: LM = 0, smooth block. This block generated 𝒓 sub-block that every sub-block is processed for embedding data; LM = 0, semi-smooth block. This type has 2 sub-blocks and data embedding process is done in every sub-block; LM = 0, normal block. This block type has similar characteristics to that use in [13]; LM = 0. Rough Block. This type will not be used to embed data because it can increase distortion of stego image; and LM = 1. This block is not used in the embedding process because it contains pixel that causes either underflow or overflow; (e) Constructing stego image, in this step, stego image produces a new pixel value that is resulted in embedding process.
Data Extraction and Pixel Value Recovering
Similar to the embedding process, we also use the extraction process from Peng et al concept [13]. It requires stego image and location map as shown in Figure 3(b). The data extraction process has the following steps: (a) Partitioning stego image, it divides stego image into blocks that have the same size as the blocks in the embedding process; (b) Calculating blocks complexity, because pixel position does not change after the embedding process, we can confirm that the complexity value does not change, either; (c) Extracting data and restoring pixel value, this process depends on the number of sub-blocks that has been generated in the previous step. For LM = 1 and LM = 0 with rough block, it is not extracted because the pixel value before and after embedding does not change.
TABLE2
THE STEGO IMAGE QUALITY OF THE PROPOSED METHOD AND OTHER METHODS WITH 16569 BITS DATA
Image
PSNR (dB)
[17] [18] Proposed Method
Elaine 42.16 59.44 54.21
Lena 48.27 59.05 56.88
Pepper 34.55 59.1 55.1
Abdominal 44.62 59.43 60.38
Hand 43.46 58.32 62.58
Head 42.77 59.24 60.12
Leg 48.37 58.67 62.49
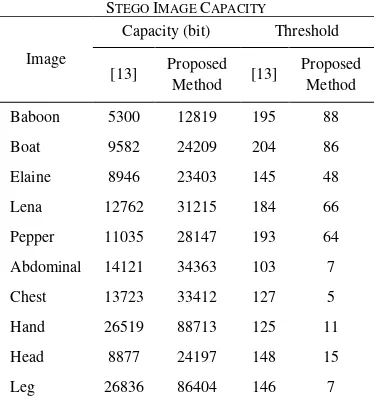
TABLE3 STEGO IMAGE CAPACITY
Image
Capacity (bit) Threshold
[13] Proposed Method [13]
Proposed Method
Baboon 5300 12819 195 88
Boat 9582 24209 204 86
Elaine 8946 23403 145 48
Lena 12762 31215 184 66
Pepper 11035 28147 193 64
Abdominal 14121 34363 103 7
Chest 13723 33412 127 5
Hand 26519 88713 125 11
Head 8877 24197 148 15
Leg 26836 86404 146 7
TABLE1
STEGO IMAGE QUALITY WITH 1KB DATA
Image
Peng et al [13] Proposed
PSNR (dB)
Shifted Pixel
Time (s)
PSNR (dB)
Shifted Pixel
Time (s)
Baboon 67.93 2255 36.80 66.79 3084 27.93
Boat 71.01 864 28.94 69.04 1636 20.00
Elaine 72.36 503 41.48 71.95 601 9.08
Lena 71.57 699 46.03 69.74 1323 8.47
Pepper 70.29 1107 43.76 68.58 1878 11.64
Abdominal 75.13 35 16.11 73.46 280 7.79
Chest 75.03 47 3.69 73.89 208 6.77
Hand 75.37 7 3.03 74.07 180 6.51
Head 74.76 82 37.89 73.95 198 7.19
Furthermore, this pixel does not carry data, either; (d) Constructing carrier image, the original pixel value in the extraction process is then used to construct the original image.
The example of embedding and extracting processes can be presented in Figure 4(a) and 4(b), sequentially. It uses smooth block with complexity value 0.8 which has 5 sub-blocks. In more details, there is a red and blue pixel in every sub-block. The red indicates minimum pixel value while the blue one is maximum pixel value. Only in these pixels the embedding process is performed. The 𝒅′𝒎𝒊𝒏
and 𝒅′𝒎𝒂𝒙 values that have been shown are
calculated from the first sub-block. Here, the embedding data is only done in the maximum pixel
with 𝒅𝒎𝒂𝒙 = 𝟏 and 𝒃𝟏 = 𝟏. Additionally, the
minimum pixel is not used for data embedding because it has 𝒅𝒎𝒊𝒏= −𝟏. According to the
algorithm in [13], the pixel is not shifted by 1 point
3. Results and Analysis
For evaluating the proposed method, we use image carriers from USC-SIPI [15] (i.e. Lena, Baboon, Boat, Elaine and Peppers) called non-medical image and System Partners Healthcare Inc. [16] (S.P.H. Inc.) (i.e. Abdominal, Chest, Hand, Head, Leg) called medical image. Data that used for
Abdomal Chest Hand Head Leg
(a)
Baboon Boat Elaine Lena Pepper
(b)
Figure 6. The quality of stego image based on the block size, (a) Non-medical image, (b) Medical image
(a) (b)
Baboon Boat Elaine Lena Pepper
57
Abdomal Chest Hand Head Leg
embedding is generated from the Matlab’s rand() function. The proposed method is developed and tested in the following environment: Windows 10 Professional 64-bit, Intel(R) Core(TM) i5-4200U CPU@ 1.60 GHz Processor, and 4096 MB of memory. The example of carrier, stego and extraction images can be seen in Figure 5.
Quality and Capacity of Stego Image
The quality of stego image is measured by calculating the PSNR. Higher PNSR means better stego image quality. The testing result is provided in Table 1 which shows the quality of the proposed and main reference method [13]. In this evaluation, we use block of 4×4 with 1Kb data.
It is shown that the quality of stego images of the proposed method is slightly lower than that of Peng et al [13]. On average, the PSNR value decreases by 1.256 dB. The highest decrease happens in the ‘Boat’ image, which is 1.97 dB. The decrease occurs in all image because the proposed method has more shifted pixel. As what has been described before, shifted pixel is a pixel that is not used as the carrier and the value is shifted by 1 point (𝒅𝒎𝒂𝒙∉ {𝟎, 𝟏}𝒐𝒓𝒅𝒎𝒊𝒏∉ {𝟎, 𝟏}).
The proposed algorithm is also compared
with other ones whose result is provided in Table 2. It shows that our method outperforms that of [17] in all test images. For method in [18], our method is better for medical images (i.e. Abdominal, Hand, Head, and Leg). This happens because in [17], there is no block selection before embedding the data; while in [18], pixel grouping is implemented for embedding the data. This method is suitable in non-medical images but does not give significant effect in the smoother carrier images, such as medical images. Different from those methods, our approach has relatively significant effect even in the smooth carrier images. Furthermore, smoother carrier image leads to increasing the quality of the respective stego images. Overall, PSNR value higher than 30 dB is assumed to be good.
The result of the capacity testing is presented in Table 3, which compare that of the proposed and reference methods. It shows that the proposed method is able to improve the stego capacity significantly. On average, the capacity of carrier increases 2.6 times that of the reference method. This achievement happens in smooth images (i.e. Abdominal, Chest, Hand, Head and Leg) because they have more distributed pixel value than the others. The biggest increase occurs in the ‘Hand’
TABLE6
VARIOUS BOUNDARIES FOR EVALUATING THE PERFORMANCE
Scenario ∆ of each block type
Smooth Semi-smooth Normal Rough
(dB) Average of Capacity (bit) Average of PSNR (dB) Average of Capacity (bit)
1 55.614 52241.8 55.984 15602.4
2 56.526 56087.5 57.974 12174.2
3 56.526 51128.4 57.758 12296.2
4 57.774 44276.4 58.738 10516.8
5 57.774 44276.4 58.738 10516.8
image, from 26519 bits to 88713 bits; while the ‘Baboon’ image gets the lowest increase. This condition can be achieved because the proposed method can utilize pixel block well by dividing it into sub-blocks. The effect of dividing blocks improves the capacity from 2 bits to 𝟐𝒓 bits based on the number of block’s row (𝒓).
For further evaluation, we also measure the effect of various ∆ with respect to 𝑻 = 𝟒, by implementing 6 scenarios as provided in Table 6. Here, the value of ∆ is varied for each block type. The experimental results of these scenarios are presented in Table 7, which shows the average of PSNR and capacity of each image group. It depicts that decreasing ∆ leads to increasing the PSNR; but, consequently, it reduces the capacity. However, further lowering ∆ will not affect both PSNR and capacity, as shown in scenarios 4, 5 and 6. This trend happens to both medical and non-medical image groups.
The Effect of Block Size Change and Threshold on Stego Image Quality
Further performance evaluation of the proposed method is carried out by measuring block sizes and threshold changes, depicted in Figure 6 and 7. Each of these factors is described in the following sub-sections.
The Effect of Block Size Change
The purpose of this testing scheme is to evaluate the stego image quality of proposed method, when the block size has become larger. In this experiment, we use 1Kb of data with threshold 10 for all carrier image. The experiment result is shown in Figure 6. Especially for the ‘Baboon’ image, we only display image quality up to 6×6. This is because from the block size of 7×7 to 10×10, the image is not able to embed all data.
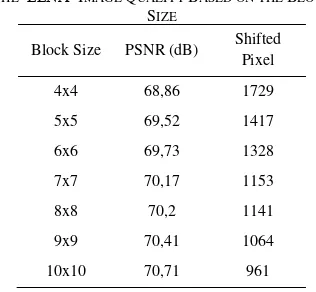
Overall, the stego image quality is getting better as the block size increases. The best improvement is shown by medical images with sharply upward trend line compared to non-medical images. On average, the quality of stego images increases 0.5 dB for each block size increment. This is achieved because the larger block size leads to smaller number of shifted pixels. This condition is shown in Table 4 that represents the effect of block changes on the quality and number of shifted pixels. When the block size is 4×4, the stego quality is 68.86 dB and shifted pixelis 1729. This value increases 1.34 dB to 70.2 in block of 8×8. This increase is followed by the decrease of the number of shifted pixels to 1141.
The Effect of Threshold Change
We also perform image quality testing based on threshold changes. This testing uses block of 4×4 with 10Kb of data. The result is provided in Figure 7, where the evaluated threshold values are between 1 and 20.
In the non-medical image group, the data cannot be inserted entirely when the threshold is 1. So, the quality on that threshold cannot be displayed. This also occurs in other images with various thresholds. For example, in the ‘Baboon’ image, we only show the PSNR value of threshold 14-20. Different with the medical image group, the data are successfully embedded at all threshold values.
Regarding the quality of stego images, greater the threshold values result to lower of the quality of stego images. This is because the threshold value and the number of generated shifted pixels is proportional, whose details can be found in Table 5. It shows the number of shifted pixel changes on the ‘Abdominal’ image based on threshold used.
Furthermore, we find that when the threshold is 1, the quality image is 63.63 dB and shifted pixel is 2329. The quality decreases to 61.32 dB and to 59.54 dB when the thresholds are 5 and 11, respectively. The number of shifted pixel in each thresholds increases to 7516 and 13883. This means that if we decrease the number of shifted pixels, then the PSNR value increases and the security level gets higher.
4. Conclusion
In this paper, we have proposed a new data hiding method. It has been able to increase the capacity of the payload that can be embedded to the cover, significantly. However, as a trade-off, the quality of the stego data reduces. Nevertheless, this decrease is not significant, as it shows by the generated PSNR value. It occurs because the stego quality is affected by the number of shifted pixels. The more shifted pixels, the more the decrease of the quality. This condition will be reduced in our future work.
References
[1] S. Marwan, A. Shawish and K. Nagaty, "DNA-based Cryptographic Methods for Data Hiding in DNA Media," Biosystems, vol. 150, pp. 110-118, 2016.
Journal of Information Processing System, vol. 12, no. 3, pp. 525-537, 2016.
[3] N. Kar, A. Majunder, A. Saha and S. Deb, "Data Security and Cryptography Based on DNA Sequencing," International Journal of Information Technology & Computer Science, vol. 10, no. 3, pp. 24-32, 2013.
[4] R. Caldelli, F. Filippini and R. Becarelli, "Reversible Watermarking Techniques: An Overview and A Classification," EURASIP Journal on Information Security, vol. 2010, pp. 1-19, 2010.
[5] A. Khan, A. Siddiqa, S. Munib and S. A. Malik, "A Recent Survey of Reversible Watermarking Technique," Information Sciences, vol. 279, pp. 251-272, 2014. [6] M. H. A. Al Huti, T. Ahmad and S. Djanali,
"Increasing the capacity of the secret data using DE pixels block and adjusted RDE-based on Grayscale Image," in International Conference on Information and Communication Technology and Systems (ICTS), Surabaya, 2015.
[7] R. M. Rad, K. Wong and J.-M. Guo, "Reversible data hiding by adaptive group modification on histogram of prediction errors," Signal Processing, vol. 125, pp. 315-328, 2016.
[8] W. He, G. Xiong, K. Zhou and J. Cai, "Reversible Data Hiding Based on Multilevel Histogram Modification and Pixel Value Grouping," Journal of Visual Communication and Image Representation, vol. 40, pp. 459-469, 2016.
[9] J. Tian, "Reversible Data Embedding Using A Difference Expansion," IEEE Transactions on Circuits and Systems for Video Technology, vol. 13, no. 8, pp. 890-896, 2003.
[10]B. Ou, X. Li, J. Wang and F. Pang, "High-fidelity Reversible Data Hiding Based on Geodesic Path and Pairwise Prediction-Error Expansion," Neurocomputing, vol. 226, pp. 23-34, 2017.
[11]D. M. Thodi and J. J. Rodriguez, "Expansion Embedding Technique for Reversible Watermarking," IEEE Transactions on Image Processing, vol. 16, no. 3, pp. 721-730, 2007. [12]X. Li, J. Li, B. Li and B. Yang, "High-Fidelity Reversible Data Hiding Scheme Based on Pixel-Value-Ordering and Prediction-Error-Expansion," Signal Processing, vol. 93, no. 1, pp. 198-205, 2013.
[13]F. Peng, X. Li and B. Yang, "Improved PVO-based Reversible Data Hiding," Digital Signal Processing, vol. 25, pp. 255-256, 2014. [14]X. Wang, J. Ding and Q. Pei, "A Novel
Reversible Image Data Hiding Scheme Based on Pixel Value Ordering and Dynamic Pixel Block Partition," Information Sciences, vol. 310, pp. 16-35, 2015.
[15]USC-SIPI, "The USC-SIPI Image Database,"
1977. [Online]. Available:
http://sipi.usc.edu/database. [Accessed 26 April 2017].
[16]System Partners Healthcare Inc., "Partners Infectious Disaese Images eMicrobes Digital Library," 2002. [Online]. Available: http://www.idimages.org/. [Accessed 1 November 2017].
[17]P. Maniriho and T. Ahmad, "Enhancing the Capability of Data Hiding," Engineering Letters, vol. 26, no. 1, pp. 45-55, 2018. [18]H. E. Prabowo and T. Ahmad, "Adaptive Pixel