53
CHAPTER III
RESEARCH METHOD
In this chapter the writer explains about the research methodology. It is purposes to answer the problem of the study. This consists of research design, population and sample, data collecting procedures, instruments try out, instruments of the study, instrumentation validity, instrumentation reliability and data analysis procedures.
A. Research Design
In this study, the writer used quantitative correlation method. Correlation research methods is used to assess relationships and patterns of relationship among variables in a single group of subject1. The design was used to know about the relationship between self-confidence on students‟ speaking ability at the fourth semester of English study program of IAIN Palangka Raya academic year 2013/2014.The writer used a quantitative approach because the problem of study may be answered through a quantitative approach.
The purpose of correlation studies is to understand relationship among characteristic of people or other entities.2 In addition DonalAry stated that correlational research produces indexes that show both the directionand the strength of relationship among variables.3 Correlation studies are traditionally classified as relationship studies or prediction studies. In relationship studies,
1
DonalAry, Lucy Chesar Jacob, Chris Sorensen, Asghar Razavieh.Introduction to Research in Education, (English Edition). (Canada: Wadsworth Cangage Learning.2010). p.129.
2
Donna M. Johnson. Approaches to Research in Second Language.(New York: Logman, 1992).pp.49.
3
Donal Ary, Lucy Chesar, Chris Sorensan, Asghar Razavieh.Introduction to Research in Education, p.350.
researcher study the relationship between measure of different variables obtained at approximately the same time. Second languageresearcher have made wide use of correlational techniques to explore a variety of relationships.4
In this study, there are two variables: the first variable was self-confidence, and second variable wasspeaking ability. The study wanted to know whether one variable correlational with other variables.
The writer took English students who learning speaking III subject of IAINPalangka Raya as the subject or informant of the research. Also, The writer took speaking III as the object of the research which has the objectives to enable the students to speak in English fluently and acceptably at upper-intermediate level by considering appropriate speaking strategies.
B. Population and Sample
1. Population
The larger group about which the generalization is made is called a population. A population is defined as all members of any well-defined class of people, events, or objects.5
The study was conducting at IAIN Palangka Raya. The population of the study was all the English students of fourth semester of IAIN Palangka Raya academic year 2013/2014. The number of the population was 76 students. Other scientist states that if the population is less thenone hundred,
4
Donna M. Johnson. Approaches to Research in Second Language.p.51.
5
it is better to take all of population as sample or it is called as population research.6
Table 3.1
The Number of Students Speaking III7
Class Total
A 22 (Try Out Group)
B 20 (The Real Sample)
C 16 (The Real Sample)
D 16 (The Real Sample)
Number of Sample 52
2. Sample
The small group that is observed is called a sample. A sample is a portion of a population.8Getting sample was very important in scientific research so in this study the writer took all population as the sample of the study. The writer chose class A as try out group to measure the validity of self-confidence questionnaire and speaking instructions. Than, class B, C and D as the sample of the study.
But, in process of study, the writer just took 40 students as participants of study because some of students are hindered to follow the test.
C. Data Collecting Procedures
The study was aim at investigation at the relationship between self-confidence on student‟s speaking self-confidence at the fourth semester of IAIN
6
SuharsimiArikunto, ProsedurPenelitian: SuatuPendekatanPraktek, Jakarta:2002. P.112.
7
From Presentlies of Speaking III Class (A,B,C,D)
8
Palangka Raya. To collect the data in this study, the writer used several procedures in collecting the data, as follows:
1. Observation
Observation is a technique in collecting data where the writer does the observation directly to the object of research to know nearly the activities done.9 They are included:
a. The English students‟ activities in Speaking III class. b. The English students‟ speaking ability.
c. The English students‟ confidence.
2. Test
Test are valuable measuring instruments for educational research. A test is a set of stimuli presented to an individual in order to elicit responses on the basis of which a numerical score can be assigned.10 The writer measured the students‟ confidence and their speaking ability. According to J.B. Heaton test is geared to the teacher taken place, whereas in the latter case the teaching in geared to the test, standardized test and public examination.11
Test is an instrument in collecting data that is a series of question or treatment that applied to measure the skill of knowledge, intelligence, the ability or talent that have by individual or group.12
9
Riduwan, MetodedanTeknikMenyusunTesis, Bandung: Alfabeta, 2008, p. 104.
10
Donal Ary, Lucy Cheser Jacob, Chris Sorensen, Asghar Razavieh. Introduction to Research in Education, (Eighth Edition).(Canada: Wadsworth Cangage Learning, 2010).p.201.
11
J.B. Heaton, Language Testing. (England:Logman, 1974).p.1.
12
The test included:
a. Talking about your planning in the future confidently ! b. Talking about your personal qualitiesconfidently !
3. Questionnaire
Questionnaire was common place instrument for observing data beyond the physical reach of the observer. The questionnaire may be sent to the human beings who are thousand of miles away and whom the researcher never seen.13 In addition DonalAry state that questionnaire is in which respondents provide written responses to questions or mark items that indicate their responses to question or mark items that indicate their responses.14
The writer usedZakiaDjebbari‟s questionnaire of self-confidence. It‟s about 48 question but the writer modifiers them which one suitable with the requirement that the writer needs and also develop them bases on self-confidence theory (in chapter II).
The questionnaire was 20 questions in the form ofLikert scale, it was mean that assess attitude toward a topic by presenting a set of statements about the topic and asking respondents to indicate for each whether they strongly agree, agree, undecided, disagree, or strongly disagree. The various agree-disagree responses were assigned a numeric value, and the total scale
13
Leedy Paul D, Practical Research Planning and Design (Third Edition). (New York: Macmillan, 1974).p.135.
14
score is found by summing the numeric responses given to each item.15 This total score assesses the individual‟s attitude toward the topic, so by the questionnaire the writer will measure the students‟ confidence and their speaking ability, after that correlated the result.
To score the scale, the response categories must be weight. For favorable or positively stated items, strongly agree is scored 5, agree is scored 4, undecided is score 3, disagree is scored 2, and strongly disagree is scored 1. For unfavorable or negatively stated items, the weighting is reversed because disagreement with an unfavorable statement is psychologically equivalent to agreement with a favorable statement. Thus, for unfavorable statements, strongly agree would receive a weight or score of 1 and strongly disagree a weight of 5.16
The questionnaire was divided into three sections (see Appendix „3‟),namely test confidence (global), classroom performance (situational) andspeaking confidence (task). The first section, test confidence contains five items: two positivestatements and three negative statements about the learners‟ overallconfidence. It attempts at gathering information on the way learners feelabout themselves and cope with unexpected situations. As for the secondsection, classroom performance, it had five positive statements and three negative statements about the learners‟ English level and how theyconsider their capacities. Finally, the third section was about speakingconfidence, enclosing two positive statements and five negative
15
DonalAry, Lucy Chesar Jacob, Chris Sorensen, AsgharRazavieh.Introduction to Research in Education, (Eighth Edition), Canada: Wadsworth Cangage Learning, 2010).p. 209.
16
statements.It attempts at collecting information on how learners see their speakinglevel and competence and how they conceive pronunciation andself-confidence. Then, higher score indicated higher confidence and lower score indicated lower confidence of the students which based on the criteria of score interpretation below17:
Score Interpretation
0%-20% Very Low
21%-40% Low
41%-60% Moderately
61%-80% Strong
81%-100% Very Strong
4. Documentation
Documentation is referred to get the data directly form the place of research, enveloped of relevant books, rules, report of the activity, photos, film of documenter and research data relevant.18
They are included: a. The number of class. b. The number of students.
c. The syllabus of speaking III subject.
d. The result of questionnaire of students confidence. e. The result of students‟ speaking test.
f. Photos
17
Riduwan, MetodedanTeknikMenyusunTesis, Bandung: Alfabeta, 2010, p. 88.
18
D. Instruments Try Out
The writer triedout the self-confidence questionnaire and speaking instrument before it was applied to the real sample in the study. The test type was Speaking test. It consists of some question. This test appears to offer a realistic means of assessing to total speaking skill in “natural” speech situation.19Moreover, the speaking test will produce a great deal of students‟ talking. The writer analyzed the students‟ questionnaire and speaking instrument to gain the information about the instrument quality that consists of instrument validity and instrument reliability. The procedures of the tried out were:
a. The writer tried out the instruments of try out test to students of class A of speaking III class.
b. The writer gavethe questionnaire of self-confidence to the students. c. The writer gave score to the students‟ speaking test and students‟ self
-confidence questionnaire, the writer analyzes the obtained to know the instruments validity and instruments reliability.
E. Instruments of the Study
1. Test Type
The test of type was used to collect the data is in the form of oral test. The students were assigned to choose one of twotopic that interest them. They were given 2-5 minutes to present the chosen topic.
19
2. The Test Construction
The test construction was based on the objectives of the study. To gain the appropriate speaking test for the aim of this study , the writer did some steps:
a. Planning the Speaking Test
To produce a good speaking test, the writer made plan on the test construction. In this sense, the objective of the test is determined. Then, the writer decidedthe appropriate type of test. The test type and test objectives are very close. The test objectives cannot be achieved without having appropriate test type. Then, the writer cared for the adequacy of the content.
b. Preparing the Speaking Test
The speaking test was used to elicit the data covering direction and instruction of what the subjects to do. To made the instruction clear and understood by the students, the instructions must be simple. The instruction was accompanied with several alternatives topic. The topics were familiar to the students and it can be developed.
F. Instrumentation Validity
Validity instrument it means the instrument that used to get the data (measure) is valid. Valid it means the instrument can be used to measure what are we want to measure.20
Based on Sugiyono, the result of study is called valid if there was a similarities between the data that have collected by the test and the true data that happened on the object of the study.21
Spolky stated that validity is the central problem in foreign language testing. Validity is concerned with whether a test measures what it is intended to measure. A test of speaking ability in a classroom setting is usually an achievement test. An achievement test should have content and face validities. Since content validity asks if the test content matches the content of the course of study, what teachers can do is to match the course objectives and syllabus designwith the test items.22 To find the validity of test, facevalidity, content validity, and construct validity are used.
The writer used three validities to know the instrument validity of the study; they are face validity, content validity and construct validity. According to Heaton, a good test should posses‟ validity: that is it should measure what it is intended to measure and nothing else. 23
20
Sugiyono, StatistikuntukPenelitian, Bandung: Alfabeta, 2004, p. 267.
21Ibid,
p. 267.
22
Kim, Hyun Sook, The Types of Speaking Assessment Tasks used by Korean Junior Secondary School English Teachers, http://www. Asian-efl-journal.com/dec_03_gl_kr.php, (Online on November 29th, 2014).
23
Validity is the extent to which a measure actually taps the underlying concept that it purports to measure.24 In this study, the validity is classified into face, content and construct.
1) Face Validity
Purposes of the study wanted to measure the students‟ scores in speaking skill. Of course, the test assign the students to produce the speaking/oral language. Face validity is an estimate of whether a test appears to measure a certain criterion; it does not guarantee that the test actually measures phenomena in that domain.
Richards et al state that this is a subjective judgment on the degree to which a test appears to measure the knowledge or abilities it claims to measure, based on the subjective judgment of an observer. Hughes states that as the real implications of tests are often different to those perceived by examines or administrative personnel, face validity is often disregarded in testing. However, face validity is very important in a classroomspeaking test, because the students are more motivated to speak if a test has goodface validity.25
Based on Heaton, a test is called has face validity is if the test items lookright to other testers, teachers, moderators, and taste.26
24
DonalAry, Lucy Chesar Jacob, Chris Sorensen, AsgharRazavieh.Introduction to Research in Education, (Eighth Edition), Canada: Wadsworth Cangage Learning, 2010).p. 196.
25
Mark Brierley et al., Assessing Speaking in a University General English Course,
http://soar-ir.shinshu-u.ac.jp/dspace/bitstream/10091/3342/1/Humanities_Social03-07.pdf, (Online on November 29th, 2014).
26
The face validity of the test items as follows.
a) Type of test used oral test. In this case, the students were assigned to speak.
b) The kinds of the test items of speaking as talking about your planning in the future, talking about your personal qualities confidently ! c) Language that used is English.
d) The test was suitable to fourth semester of English study program at IAIN Palangka Raya.
2) Content Validity
According to Donald Ary states :“Content validity is essentially and of necessity based on the judgment, and such judgment must be made separately for each situation. The question of an instrument‟s validity is always specific to the particular situation and to the particular purpose for which it is being used. A test that has validity in one situation may not be valid in a different situation”.27
In this study, the writer measuredThe students‟ confidence score. The writer used questionnaire in the form of some questions about the students‟ confidence, the questions was about 30 questions. (See appendix 3)
27
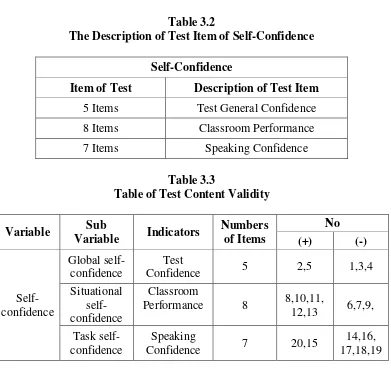
Table 3.2
The Description of Test Item of Self-Confidence
Self-Confidence
Item of Test Description of Test Item
5 Items Test General Confidence
8 Items Classroom Performance
7 Items Speaking Confidence
Table 3.3
Table of Test Content Validity
Variable Sub
Variable Indicators
Numbers of Items
No
(+) (-)
Self-confidence
Global self-confidence
Test
Confidence 5 2,5 1,3,4
Situational self-confidence
Classroom
Performance 8 8,10,11,
12,13 6,7,9, Task
self-confidence
Speaking
Confidence 7 20,15
14,16, 17,18,19
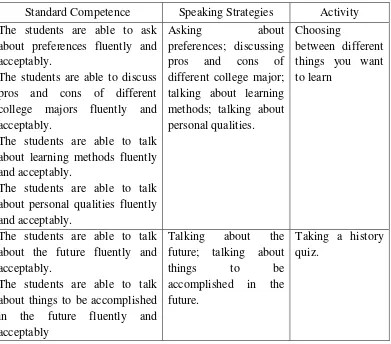
Table 3.4 The course Objective of Speaking III
Standard Competence Speaking Strategies Activity The students are able to ask
about preferences fluently and acceptably.
The students are able to discuss pros and cons of different college majors fluently and acceptably.
The students are able to talk about learning methods fluently and acceptably.
The students are able to talk about personal qualities fluently and acceptably.
Asking about
preferences; discussing pros and cons of different college major; talking about learning methods; talking about personal qualities.
Choosing
between different things you want to learn
The students are able to talk about the future fluently and acceptably.
The students are able to talk about things to be accomplished in the future fluently and acceptably
Talking about the future; talking about
things to be
accomplished in the future.
Taking a history quiz.
3) Construct Validity
Ary Donald states that construct validity (measurement) is the extent to which a test or other instrument what the researcher claims it does; the degree to which evidence and theory support the interpretations of test score entailed by the proposed use of the test.28
To measure the validity of the questionnaire, the writer used the formulations of Product Moment by Pearson as follow.29
28
DonalAry, Lucy Chesar Jacob, Chris Sorensen, AsgharRazavieh.Introduction to Research in Education, (Eighth Edition), Canada: Wadsworth Cangage Learning, 2010).p. 638.
29
rxy=
𝑁 𝑥𝑦 −( 𝑥) ( 𝑌)
(N 𝑋2 − 𝑋)2 (N 𝑌2 −( 𝑌)2]
Where :
rxy : Table coefficient of correlation 𝑋 : Total value of score X
𝑌 : Total value of score Y
𝑋𝑌 : Multiplication Result between Score X and Y N : Number of studentsof the study.
After that, the data was calculated by using Test-observed calculation with the formulation belows :
𝑡𝑜𝑏𝑠𝑒𝑟𝑣𝑒𝑑 = 𝑟 𝑛 −
2
1− 𝑟2
Where :
t = The value of tobserverd
r = The coefficient of correlation of the result of robserved
n = Number of students
The distribution of ttablefor α = 0,05 and the degree of freedom (n-2) with
the measurements of validity using these criteria below :30
30
Interpretation :
The criteria of interpretation the validity :31 0.800 – 1.000 = Very High Validity 0.600 – 0.799 = High Validity 0.400 – 0.599 = Fair Validity 0.200 – 0.399 = Poor Validity
0.00 – 0.199 = Very Poor Validity (invalid)
And also the writer measured the students‟ confidence and using SPSS 16.0 Program.From the measurement of validity there are 20 valid items and there was 0 invalid items. For the detail explanation can be seen at appendix 2.
G. Instrumentation Reliability
The reliability of a measuring instrument is the degree of consistency with which it measures what ever its measuring. This quality is essential in any kind of measurement.32 It is used to prove that the instrument approximately believe is used as the tool of collecting the data because it is regard well. The reliable instrument is the constant.
Reliability correlate with the instrument can give the same result to the object that is measure repeatedly in the same time, Heaton states :
31
Riduwan, MetodedanTeknikMenyusun Thesis, Bandung : Alfabeta, 2004, p. 120
32
Donal Ary, Lucy Chesar Jacob, Chris Sorensen, Asghar Razavieh.Introduction to Research in Education, (Eighth Edition), Canada: Wadsworth Cangage Learning, 2010).p. 236
t0bserved >ttable = Valid
“Reliability is necessary characteristic of any good test: for it to be valid data all, a test must first be reliable as a measuring instrument. If the test is administrated to the same candidates on different occasion (with no language practice work taking place these occasion) then, to the extent that is procedures differing result, it not reliable”33
To know the reliability of the instrument test, the writer is used the Alpha‟s frame. The formula was as follow.34
r11 = 𝐾𝐾 1
-st 𝑠𝑡
Where :
R11 : Coefficient of test reliability K : Number of item
St : Total Variants
𝑠𝑡 : Recult of total variants score each item The steps in determining the reliability of the test are :
a. Measuring the variants score each item with the formula : 𝑆𝑋12- (SXi)2
𝑆𝑖 = N
N
b. Then sum the all item variants with the formula:
𝑆𝑆𝑖 = S1 + S2 + S3 + . . . SN
c. Measuring the total variants with the formula: ( Xt)) 2
𝑋12 N St =
N
33
J.B. Heaton, Writing English Language, (England: Longman, 1974).p.155.
34
Where :
𝑆𝑡 = the total variant
𝑡
2 = the square of table X ( t)2 = the sum of x table square
N = the number of testes
d. Calculating the instrument reliability using Alpha. e. The last decision is comparing the value of 𝑟11 𝑎𝑛𝑑 𝑟𝑡
𝑟11 > 𝑟𝑡𝑎𝑏𝑙𝑒= 𝑅𝑒𝑙𝑖𝑎𝑏𝑙𝑒
𝑟11 <𝑟𝑡𝑎𝑏𝑙𝑒 =𝑁𝑜𝑡𝑅𝑒𝑙𝑖𝑎𝑏𝑙𝑒
f. To know the level of reliability of instrument, the value of is interpreted based on the qualification of reliability as follows:35
0.800 – 1.000 : Very High Reliability 0.600 – 0.799 : High Reliability 0.400 – 0.599 : Fair Reliability 0.200 – 0.399 : Poor Reliability 0.00 – 0.199 : Very Poor Reliability
And also the writer measured the reliability of students‟ questionnaire used SPSS 16.0 Program.From the measurement of instrument reliability it is know that the whole numbers of test items are reliable and can be use as the instrument of the study.(See appendix 2)
35
H. Data Analysis Procedures
The writer did some ways in the data analysis procedures, they are as follows:
1. Testing the students‟ speaking ability by using instrument of speaking test.
2. Scoring students‟ speaking ability by using speaking scoring rubric by first and second rater.
3. Giving the self-confidence questionnaire to the all English students of the fourth semester of State Islamic Institute, academic year 2013/2014. 4. Giving score to the students‟ confidence questionnaire by using scale of
Likert.
5. Testing the normality, homogeneity and linearity.
6. Calculating the data by using correlation “r” product moment to the test the hypotheses of the study.Whether there is correlation significant between the students‟ confidence and their speaking ability or not.
Two know the hypothesis is accepted or rejected using the criterion:
- If rxy≥ rtable it means Ha is accepted and Ho is rejected.
- If rxy< rtable it means Ha is rejected and Ho is accepted.
7. In addition, the writer uses SPSS 16.0 program to compare the data. 8. Interpreting the result.
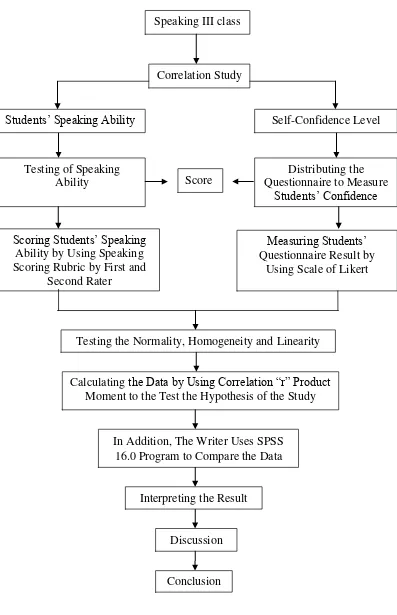
11. Summary
Figure 3.1 Steps of collecting, data analysis procedure and testing hypothesis
Correlation Study
Students‟ Speaking Ability Self-Confidence Level
Testing of Speaking Ability
Distributing the Questionnaire to Measure
Students‟ Confidence
Scoring Students‟ Speaking Ability by Using Speaking Scoring Rubric by First and
Second Rater
Measuring Students‟ Questionnaire Result by
Using Scale of Likert
Calculating the Data by Using Correlation “r” Product Moment to the Test the Hypothesis of the Study
Conclusion
In Addition, The Writer Uses SPSS 16.0 Program to Compare the Data
Discussion
Testing the Normality, Homogeneity and Linearity
Interpreting the Result Speaking III class