Volume 9 Number 2 2010
Analysis on Indonesia Strategic
Framework to Face ASEAN 5 in
ASEAN Free Trade Area (AFTA) 2015
Deddy P. Koesrindartoto
School of Business and Management Institut Teknologi Bandung
Barli Suryanta
Master of Science in Management, School of Business and Management Institut Teknologi Bandung
Abstract
This paper has purpose to assess Indonesia readiness of sectors to face ASEAN 5, those are Brunei, Malaysia, Philippines, Singapore, and Thailand in near AFTA 2015. And also this paper want to construct the compatible Indonesia's strategic framework that it will be useful for Indonesia itself in order to be key player in AFTA 2015. Furthermore, the econometric approach by using gravity equation model will be applied to assess Indonesia readiness to face AFTA 2015 which using mechanism of free flows of goods.
Keywords: AFTA 2015, Indonesia Strategic Framework, Gravity Equation Model
1. Introduction
1.1. ASEAN Free Trade Area (AFTA) Initiative and Common Effective Preferential Tariff (CEPT)-AFTA
According to information from site of ASEAN (asean.org) that the ASEAN Heads of State and Government decided to establish an ASEAN Free Trade Area or AFTA in January 1992 by signing the Singapore Declaration. The objective of AFTA is to increase the ASEAN region's competitive advantage as a production base geared for the world market. A vital step in this direction is the liberalization of trade through the elimination of tariffs and non-tariff barriers among the ASEAN members. The Common Effective Preferential Tariff Scheme, or CEPT, is a cooperative arrangement among ASEAN Member States that will reduce intra-regional tariffs and remove non-tariff barriers over a 10-year period commencing January 1, 1993 (asean.org).
1.2. Indonesia and AFTA 2015
Table 1. Indonesia preliminary integration framework to face AFTA 2015
Source: Modification from AEC Blueprint 2008 and AEC chart-book 2009
2. Literature Review
2.1. Economic Integration Definition
Venables (2000) said that economic integration called as a regional economic integration which occurs when countries come together to form free trade areas or customs unions, offering members preferential trade access to each other' market. He also emphasize regional integration into 'deeper integration in term of international trade' that it can be pursued by going beyond abolition of import tariffs and quotas, to further measures to remove market segmentation and promote integration.
2.2. Types of Economic Integration
Proposed by El-Agraa (1997), there are different forms of integration but the essence of the integration arrangement is the discriminatory removal of all trade obstacles between at least two participating nations and the promotion of some form of cooperation and coordination between the participating countries. The main types of integration schemes and their essential features are as follows and are summarized like following:
#Free trade areas
In free trade areas the member countries remove all trade impediments among themselves but each country retains the right to determine their policies in relation to non-participating countries. The agreement usually includes the elimination of tariffs and quantitative restrictions on trade. The ”rules of origin, are the basis of the agreement. The rules of origin imply that only those commodities that originate from a member state are granted from tariff. The examples of free trade areas include the European Free Trade Association (EFTA), comprising of the UK, Austria, Denmark, Norway, Portugal, Sweden, Switzerland and Finland and the North American Free Trade Area (NAFTA) formed in 1993 by the United States, Canada and Mexico.
#Customs unions
In customs unions, member countries, as in free trade areas, remove all trade impediments among the participating countries. In addition, the member countries harmonize their trade policies and, in particular, have common external tariffs on imports from non-participating countries. The most well known customs union is the European Common Market formed in 1957 by West Germany, France, Italy, Belgium, the Netherlands and Luxembourg.
Strategic approach
Specific sectors for integration
A1.Free Flows of Goods
#Common markets
Common markets are customs unions with the added feature that there is free mobility of factors of production i.e. labor, capital, enterprises and technology, across the participating countries. In 1992 the European Union (EU) achieved the status of a common market.
#Economic unions
Economic unions are common markets where there is unification of monetary and fiscal polices. Monetary policy is managed by a central bank. The union will have a single currency, in the case of the European Union, the euro. There is a central authority to exercise control over these matters. This is considered to be the most advanced form of economic integration. The EU is moving this way now.
#Total political unions
In a political union the participating countries become one nation. The central economic authority is supplemented by a common parliament and other institutions.
Dennis and Yusof (2003) in their article divided types of economic integration in two ideas: first, Positive integration refers to the modifications of existing institutions and instruments and to the introduction of new ones to advance and facilitate the functioning of the integrated market. An appreciation of the idea of integration is enhanced when the objectives of integration are given some attention. Economic growth is expected to be enhanced with the opportunities that are promised by a larger market size and increasing trade and investment brought about by integration. Growth is anticipated to be enhanced through trade creation, increased competition and efficiency in resource allocation and specialization. Trade creation is achieved when trade expands between countries who have joined in an integration arrangement.
This is achieved when production is shifted from higher-cost non-member countries to lower-cost member countries and trade between participating countries increases. Second, Negative integration
has been used to refer to the removal of trade impediments between participating countries or to the removal of restrictions on the process of the liberalization of trade. In considering integration and integration indicators it is helpful to make a distinction between the types of integration.
2.3. Distinguish Between Free Trade Area (FTA) and Custom Union (CU)
Emphasizing about free-trade areas (FTA) and custom unions (CU), Husted and Melvin (2010) explain that basic difference between FTA and CU is how the member countries treat non-member countries. By definition of them, FTA is an agreement among several countries to eliminate internal barriers to trade but to maintain existing barriers against non-member countries and CU is an agreement among several countries to eliminate internal barriers to trade and to erect common barriers against nonmember countries. Tariffs are linked to eliminate internal barriers named it as preferential trade arrangements (PTAs). The terminology of PTAs is preferential (or discriminatory) trade arrangements that various countries have agreed to reduce even further barriers to trade among themselves (Husted and Melvin, 2010).
PTAs in another side are surely involving and affecting three agents of economics in the FTA or CU countries (Husted and Melvin, 2010):
1. Consumer, that would be consumer surplus or loss depend on export side or import side. Consumer surplus is the difference between the amount consumers are willing to pay to purchase a given quantity of goods and the amount they have to pay to purchase those goods or vice versa if consumer loss;
2. Producer, that would be producer surplus or loss depend on as export side or import side. Producer surplus is the difference between the price paid in the market for a good and the minimum price required by an industry to produce and market that good or vice versa if producer loss;
3. Government, that would be tariff revenue falls.
Husted and Melvin (2010) in expressively said that PTAs have two primary economic implications:
1. Trade diversion: A shift in the pattern of trade from low cost world producers (natural comparative advantage) to higher cost CU or FTA members. The consequences of trade diversion are in the process, the resources are directed away from merchandise or commodity in the low cost (natural comparative advantage) world producers and directed toward merchandise or commodity production in the higher cost partner country (FTA or CU members) that effect to consumer loss, producer surplus, and the tariff revenue of government absolutely will fall.
2. Trade creation: An expansion in world trade that results from the formation of PTAs. The consequence is the replacement of higher cost domestic production of import goods by lower cost imports (Pelksman, 2006) that effect to consumer surplus, producer loss, and tariff revenue falls.
The optimum strategy related those two economic implications of PTAs is maximize trade creation and minimize trade diversion will give beneficial to FTA or CU welfare effect. Besides affecting agents and have economic implication, PTAs in free trade (FTA or CU) have gains from point of view import side and from point of view export side (Husted and Melvin, 2010) :
1. From point of view import side, PTAs in free trade (FTA or CU) will gain for consumers and domestic producers are worse; because of consumers are able to purchase this product at a lower price and the lower price leads some producers to reduce the quantity supplied and others to drop out of the market;
2. From point of view export side, PTAs in free trade (FTA or CU) will gain for producers and consumer loss; because of domestic producers would expand output in response to the higher price from partner FTA or CU members and the higher price leads some consumers demand will fall.
2.4. The Arguments for Market Integration
International trade in goods and services takes place because countries have different resource endowments and labor skills and because consumer tastes vary from country to country. David Ricardo,
th
3. Methodology
The Hypothetical Construct in this study would be:
H1:If Indonesia has performs well of trading on seven priority sectors to be integrated based on commitment of AFTA 2015 with other members, then the seven sectors of Indonesia is solid and ready to participate in free flows of goods.
The data of gravity equation for bilateral ASEAN free trade will utilize Indonesia trade balance to other ASEAN members Indonesia from www.trademap.org. Indonesia GDP per capita to other ASEAN members and Indonesia average CEPT rate and other ASEAN members. Both of them are getting from www.asean.org. Distance between Indonesia capital city to other ASEAN members capital city. And
Indonesia real exchange rates and others which pick up from International Financial Statistic 2009-IMF. The time period all of them are from 2002 to 2008.
The next step is optimization of Gravity Equation model to test H1. The modification model such as follow:
He argued, rightly, that by concentrating on producing those goods and services in which a country was relatively more efficient and importing those product in which it was relatively less efficient, it could increase its national income. And this would be so even if that country was absolutely less efficient in producing all products. In other words, international capital immobility leads to specialization in terms of
comparative advantage.
Pelkmans (2006) believes that market integration is a behavioral notion indicating that activities of market participants in different regions or member states are geared to supply and demand conditions in the entire union (or other relevant area). Usually, this will also show up in significant cross frontier movements of goods, services and factors. Regarding to European integration empirical evidence, he always emphasizes the expression of 'Custom Union' to start economic integration regionally because of market integration in European succeeded to apply it.
2.5. General Gravity Equation Model
The Gravity Equation model has been successfully applied to flows of varying types such a migration, foreign direct investment, and more specifically to international trade flows and has become a popular instrument in empirical foreign trade or free trade analysis. The general Gravity Equation Model or Gravity model can be written as :
(2)
Tij is the value of trade between country i and country j, Yi is country i's GDP, Yi is country j's GDP, and D ij is the distance between the two countries. This general Gravity Equation model takes from Krugman and Obstfeld (2009). Still from them, that the reason for the name is the analogy to Newton's law of gravity: Just as the gravitational attraction between any two objects is proportional to the product of their masses and diminishes with distance, the trade between any two countries is, other things equal, proportional to the product of their GDPs and diminishes with distance.
The are three valuable statements from Krugman and Obstfeld (2009) in discussing about the Gravity model:
1. In relation with 'the size matters of Gravity Model': There is a strong empirical relationship between the size of a country economy and the volume both its imports and its exports.
2. In relation with 'the logic of the Gravity Model': Why does the gravity model work? Broadly speaking, large economies tend to spend large amounts on imports because they have large incomes. They also tend to attract large shares of other countries' spending because they produce a wide range of products. So the trade between any two economies is larger.
3. In relation with the looking for anomalies using the Gravity Model: In fact, one of the principal uses of gravity models is that they help us to identify anomalies in trade. Indeed, when trade between two countries is either much more or much less than a gravity model predicts, economist search for the explanation.
c ij b j a i ij
D
Y
Y
A
Looking to wood based-products, as simultaneous is surely significant by seeing prob. (F-stat) at level of 1 %. Then the evidence of prob.(t-stat) presents that Indonesia GDP per capita is highly significant at level of 1 % with positive sign of coefficient. Brunei GDP per capita is also significant at level of 10 % with negative sign. Indonesia ACEPT is significant at level of 5 % with positive sign. Indonesia real exchange rate is significant at level of 1 % with negative sign and finally Brunei real exchange rate is significant too with different level at 5 % with positive value.
The analysis is Indonesia GDP per capita has positive sign (9.186632) reflects that wood based-products become Indonesia natural comparative advantage against Brunei and Indonesia succeed to manufacture this item through scale of economies mechanism. From the value of coefficient both countries which Y>Yi j which interpreted that Indonesia's net export increases maximum at 9.2 % otherwise Brunei's net export drop maximum at 4.1 %. Indonesia ACEPT in positive sign (4.121848) which indicating that cost of import about rubber based-products to Indonesia is lower and must be considered that only ti is significant. For that situation Indonesia to be importer country. And positive is associated with trade creation refer to AFTA.
The impacts like effectively its domestic consumers surplus maximum at 4.12 % on lower price of import from Brunei, in contrast with its producers loss maximum at 4.12 % for finished goods because losing price against Brunei but surplus maximum at 4.12 % for crude and semi-finished goods because cheaper than its domestic price and its tariffs revenues will be down. However, that trade creation is nothing much impacts to trade balance both countries because of Brunei for this merchandise has become the absorption country which need much more imports rather than exports. In real exchange rate, the value of Indonesia Rupiah-IDR (-2.967334) is depreciated against Brunei Dollar (BRD) (3.284086) that would be via the depreciation of IDR might contribute to increase Indonesia net export maximum at ex iminus exj (-2.967334-3.284086) equal to 6.25 %.
Next on agro based-products, first, all independent variables as together could impact to the anomalies of Indonesia trade balance (prob. F-stat is significant at level of 1 %). Exploring to prob. (t-stat), from Gravity Equation results, researcher has significant estimation value for Yi at 10 %level, Yj at 1 % level,
Dij at 5 % level, ti at 5 % level, exi at 1 % level, and exj at 1 % level. Similar with wood based-products in which Indonesia agro based-products became primary natural comparative advantage since long time which has role play of international trading to Brunei. The positive sign of Yi (4.838600) versus negative sign of Yj (-8.376061) show that the increasing net export of Indonesia maximum at 4.8 % versus the decreasing net export maximum of Brunei at 8 %. Once again Brunei's agro based-products construction is definitely to be absorption country that will need much more imports rather than exports.
Dij is negative sign (-9.365827) that proxy to the increasing transportations, services, communications and others costs that would be affecting to reduce Indonesia's producers surplus of agro based-products maximum at 9.4 %. Then ti > tj with -3.761359>-0.305202 images that related to AFTA, Indonesia as exporter linkage to trade creation and the logic impacts such Indonesian producers surplus maximum at 0.3 % on lower Brunei ACEPT, Brunei producers loss maximum at 0.3 % and also surplus if importing crude and finished-goods maximum at 0.3 % by Indonesia lower in order to production added value goods, Brunei consumers surplus maximum at 0.3 % on lower price from Indonesia agro based-products, and tariffs revenues definitely fall maximum at 0.3 %.
Where
#TBijis sum value of trade balance (net exports) of automotive, rubber based-products, wood based-products, agro based-products, textiles and apparel, fisheries and electronics from Indonesia (i) to other ASEAN members (j) in US Dollar;
# á is constant or unobserved effect;
1
# Y ; Yit jt are GDP per capita of Indonesia and other ASEAN members GDP per capita in US Dollar
(note: in this research does not utilize variable of population because of using GDP per capita not real GDP whereas GDP per capita composed of real GDP divided by population, so the variable of population already included into GDP per capita);
# Dij is distance between Indonesia capital city (i) and other ASEAN members capital city (j) kilometer;
# ti is Indonesia average CEPT rates (i) in percentage;
# tj is other ASEAN members average CEPT rates (j) in percentage;
# exi is Indonesia real exchange rates (i) in per US Dollar;
# exj is other ASEAN members average CEPT rates (j) in per US Dollar;
# eij is lognormal error term.
4. The Results: Bilateral Trade Analysis Between Indonesia and ASEAN 5
4.1. Indonesia to Brunei
Based on table 4 (See appendix A), within Brunei, in automotive sector trading, Indonesia could ignore it because of the value of coefficient prob. (F-stat) is not significant and also all value of coefficients prob.(t-stat). From that condition, the economic reason is the Brunei's population is too small (250,000 people in 2008) and low number of user automotive which not significant trading in automotive with Brunei.
Moving to rubber based-sector the prob. (F-stat) is highly significant in 1 % level of significance, that means the independent variables affect as simultaneous to affect dynamic Indonesia trade balance to Brunei. After that checking the prob. (t-stat) that trade cost is highly significant at 1 % level of significant and has negative coefficient sign. The value of -14.62007 on distance reflects increased cost of transporting goods and services or another cost such communications. This indicates that Indonesia's producers surplus to Brunei might drop maximum at 14. 6 % because of the distance of two countries.
2
From the table 5.18 and 5.19 are clearly that fisheries sector is number one with adjusted Rat 76.65 %, 2
the second is agro based-products at 60.71 % adjusted R, the third to wood based-products at 44.3 % 2
adjusted R, the fourth is rubber based products at 31.8 %, the fifth goes to electronics at 18.05 %, the sixth is be textiles and apparels at 5.37 % and the last one is automotive with 0.2 %.
4.1. Indonesia to Malaysia
Indonesia to Malaysia in sector automotive international trading regarding table 6 (see appendix A) presents that prob.(F-stat) is significant at 5 % level and none from independent variables are significant for prob. (t-stat). In fact, automotive sector in Malaysia especially for automobile is more developed than Indonesia. Malaysia had 'Proton' as its competitive original brand and succeed to distribute it to regional ASEAN. This automobile industry was running since 1980s by collaboration with Mitsubishi-Japan. Rubber based-products is highly significant of prob. (F-stat) at 1 % level.
Indonesia and Malaysia are the one of largest output of liquid natural rubber in the world. So that, both countries will be much benefits if trading outside of them. However, according to the estimation, there is still transaction of rubber based-products between both countries which based on table 5.4, there was transaction surplus for Indonesia to Malaysia at US$ 145,601,000 (total from 2002 to 2008). This indicates that Indonesia won on crude goods and semi finished goods. The previous statement linkage to prob.(t-stat), the significance is given to Yj at 10 % level with negative sign (-6.063400) which presenting for Malaysia became absorption country. This could raise Indonesia net export maximum at 6.1 % against Malaysia and Malaysia will fall until 6.1 %. This equal value 6.1 % (raise and fall) on both side show up because the significance is just for Yj The Dij is also significant at 1 % level and has negative sign (-13.63169). Negative sign of Dij is associated with Indonesian producers income reduced maximum at 13.6 % and automatically Indonesia net export quite disturbed by inefficient transportation costs and others. It might be Malaysia strategy to limit Indonesia rubber-based products enter much than its expectation.
For wood based products, the prob. (F-stat) is significant at 1 % level. Good enough bilateral trade with Malaysia in context wood based-products. On wood based-products, all independent variables are significant for prob.(t-stat), those are Yi at 1 % level, Yj at 1 % level, Dij at 1 % level, ti at 5 % level, tj at 10 % level, exi at 1 % level, and exj at 1 % level. The elaboration of Yi (-7.485078) and Yj (3.076818) reflect the natural comparative advantage goes to Malaysia and Indonesia to be absorption country. Indonesia net export will drop maximum at 7.5 % and Malaysia net export will raise at 3.1 %. It might correlate with scale of economies too that making the lower price of Malaysia's wood based-products. The output of Dij (-10.88413) describe the Indonesian producers gain eroded until 10.8 % and related also reduction of Indonesia net export. ti with 2.895193 and tj with -2.837597 have general explanation such Indonesia cost of import is lower than Malaysia.
Then the specific information explains how this condition will result trade diversion Indonesia as a exporter wood based-products refer to AFTA declaration. The consequence is Indonesian producers loss maximum at 2.8 % on higher Malaysia's ACEPT, Malaysian producers surplus maximum at 2.8 % on higher price of Indonesia wood based products, Malaysian consumers loss maximum at 2.8 % for receiving higher price from Malaysian producers because equate its price with Indonesia, and the tariffs revenues raise maximum at 2.8 %.
Indonesia as importer will be trade diversion, Indonesian consumers loss maximum at 3.76 % on higher price from both domestic and foreign, Indonesian producers surplus maximum at 3.76 % that harmonizing its price from Brunei, Brunei producers loss maximum at 3.76 % on higher Indonesia ACEPT, and tariff revenues raise dramatically maximum at 3.76 %. The value of IDR is depreciation versus BRD, the impact Indonesia's net export is up maximum to 8.5 % (-3.252881-5.228125).
Regarding table 5 (see appendix A), in textiles and apparel is obviously is not significant trading with Brunei [the prob. (F-stat) is not significant at any levels)], and automatically the significant of prob. (t-stat) of Yi at 10 % level would be dropped. The economics of population on is almost the same with automotive sectors which Brunei's population had not a large amount consuming over Indonesia's product of textiles and apparel.
In case with Brunei, the merchandise of fisheries are equal with wood products and agro based-products that Indonesia has natural comparative advantage (the largest ocean area country in ASEAN) and scale of economies to Brunei. Before that, the findings display that the prob. (F-stat) is highly significant at 1 % level. Then significant estimation prob. (t-stat) is placed to Yi at 1 % level, Dij at 1 % level, ti at 1 % level, exi at 5 % level, and exj at 5 % level. Back to the stated above that Indonesia has natural comparative advantage and scale of economies which indicated by positive value of Yi (8.462536).
The role of play is involving Indonesia to be dominant exporter to Brunei and otherwise Brunei is an absorption country that depending upon Indonesia import. Oppose with rubber based-products and agro based-products that in this situation Dij has positive sign (10.08323). The positive sign of Dij is relation with efficient of transportation costs, services costs, communications costs, and others. By exporting fisheries sector to Brunei, Indonesian producers could save money maximum until 10.1 % rather than rubber based-products and agro based-products.
The t ihas value 4.591401, surely directing to the cost of Indonesia imports is lower amount. The only significance of ti correlated with Indonesia as importer looking to AFTA. The trade creation should be implement with consequences that Indonesian domestic consumers surplus maximum at 4.6 % on lower fisheries item from Brunei, Indonesian producers loss maximum at 4.6 % for finished goods or could be surplus for foreign cheaper price rather than domestic on crude and semi-finished goods maximum at 4.6 %, and tariffs revenues must be decreased maximum at 4.6 %. Finally exi or IDR tends depreciated from year 2002 until 2008 and surely advantage to increase Indonesia export which maximum at 3 % (-1.322690-1.701005).
How about electronics sector? The prob. (F-stat) is significant at 10 % level and simultaneous all independent variables drive the dynamic Indonesia trade balance. Connected to prob. (t-stat), the significance variable is belong only to exj at 5 % level and the others are not. This shows that BRD is appreciation (2.751665) could impact to increasing of Indonesia export maximum at 2.75 %. The latest
2 2
one Indonesia trading with Brunei is the value of adjusted Reach sector. The adjusted Rdescribes the goodness of fit or which are the significant sectors that Indonesia will get a lot of benefits from free trade.
2
From point of view Indonesia as importer refer to AFTA that would be trade creation or trade expand where Indonesian consumers surplus maximum at 2.9 % of lower price from Malaysia, Indonesian producers loss maximum at 2.9 % if form of import like finished goods and surplus maximum at 2.9 % if crude goods or semi finished-goods because of lower price than domestic, and tariff revenue fall maximum at 2.9 %. Next on exi (2.799426)> exj (-2.308180) which interpreted as Indonesia Rupiah (IDR )is appreciated against Ringgit Malaysia (RMY) therefore fallen net export of Indonesia maximum at 5.1 % {2.799426-[-2.308180]}.
Recognizing for agro based-products, the prob. (F-stat) is significant at 1 % level and quite robust to seek anomalies of Indonesia trade balance as simultaneous. And the significance of prob.(t-stat) is occupied by Yi at 1 % level, Yj at 10 % level, Dij at 1 % level, exi at 1 % level, and exj at 10 % level. The analysis following like Yi in -10.05339 and Yj in 6.477341 which mean Indonesia losing its scale of economies against Malaysia and because of that Indonesia become absorption country. The net export of Indonesia agro based-products down maximum at 10.1 % otherwise Malaysia enjoys its increasing net export maximum at 6.5 %.
However this condition is not rigid because of based on table 5.4 provided vice versa where Indonesia trade balance surplus at US$ 1,876,071,000 (from 2002 to 2008). This is could be caused by refraction on pooled least square method. Dij in value of -14.72237 will become load of costs for Indonesia producers maximum at 14.7 % and logically will affect to Indonesia net export performance. Then if seeing the value of exi in 2.799426 and exj in -2.308180 describe that IDR is appreciation versus RMY and suppress Indonesia net export maximum at 5 % {2.799426-[-2.308180]}.
According to table 7 (see appendix A), textiles and apparel is significant at 5 % level for prob. (F-stat). The prob. (t-stat) certainly significance for Yi at 1 % level, Yj at 1 % level, exi at 10 % level, and exj at 10 % level. The Yi with value at -4.770530 and Yj at value 5.098985 is associated with analogy that Indonesia becomes absorption country and for that Indonesia net export suppress maximum at 4.8 % and Malaysia increases maximum at 5.1 %.in fact based on table 5.4, Indonesia even surplus at US$ 543,631,000 versus Malaysia for textiles and apparel. This indicates that early warning for Indonesia in order free trade with Malaysia. if Indonesia careless might be Indonesia in real becomes absorption country. And for exi is 0.979323 and exj is -1.182096 is describing where IDR is appreciated to RMY and it will be reduction Indonesia net export maximum at 2.16 % {0.979323-[-1.182096]}.
Continue to fisheries sector that the prob. (F-stat) is highly significant at 1 % level. This estimation output linkage to as working together among independent variables could influence the dynamic of Indonesia trade balance. The subject of significance from prob. (t-stat) is given to Y i at 1 % level, Yj at 1 % level, Dij at 10 % level, tj at 10 % level, exi at 1 % level, and exj at 1 % level. Yi has negative sign (-12.14327) and
Yj has positive sign (17.36504) are related to absorption effect where for negative sign that will be Indonesia and making Indonesia net exports of fisheries fall maximum at 12.14 % and Malaysia is up maximum to 17.4 %. The divergence results is coming from previous table 5.4 that Indonesia surplus at US$ 233,379,000. The disparity results between descriptive and empirical must be complementing each other. Once again, the empirical output must get special attention to avoid in free trade Indonesia will be deficit to Malaysia in fisheries sector. The value of Dij in 5.443870 is good news that Indonesian producers can save their costs until 5.4 % for trading fisheries and also better off impact to Indonesian trade balance performing.
Take a look for tj has 3.424231 (the only significance) cause Indonesia as exporter country and refer to AFTA as a trade creation. The cost-benefit analysis like this; where Indonesian producers surplus maximum at 3.4 % on lower Malaysia ACEPT, Malaysian consumers surplus maximum at 3.4 % on getting lower price from Indonesia fisheries, Malaysian producers loss maximum at 3.4 % if finished goods configuration and surplus maximum at 3.4 % if crude or semi-finished goods, tariff revenues exactly fall maximum at 3.4 %. And for exi (2.656597) and exj (-3.775544) display that IDR is appreciated to RMY and constructing Indonesia net export on fisheries will down approximately at 6.5 % {2.656597-[-3.775544]}.
Change over to electronics, the prob. (F-stat) is highly significant at 1 % level. The same movement for all independent variables are robust to influence Indonesia trade balance in term electronics sector. The
Yi is significant prob.(t-stat) at 10 % level with value -15.26322 and Yj is significant prob. (t-stat) at 10 % level with value 14.13212. Meaning of these values are Indonesia transformation into absorption country and eroded Indonesia net export on these items until 15.3 %. The empirical estimation could be indicating that in free trade Indonesia need to import a lot because of crude or semi-finished goods from Malaysia is cheaper and then Indonesia make large finished goods electronic export to China or India or other bilateral country outside ASEAN members. And the descriptive results limited only for present day. And the situation might be change dramatically in getting closer to real free trade.
Moreover ti (3.554940) and tj (-3.603973) are also significant value of prob. (t-stat). These are reflecting that Indonesia ACEPT is lower than Malaysia ACEPT of electronics. Indonesia as exporter must operate trade diversion and as importer will exercise trade creation. The trade diversion causes Indonesian producers loss maximum at 3.6 % on higher electronics Malaysia ACEPT, Malaysian producers surplus maximum at 3.6 % in equal rate with Indonesia electronics price product, Malaysian consumer loss maximum at 3.6 % on higher price from domestic and foreign, and the tariffs revenues raise maximum at 3.6 %.
Trade creation induces Indonesian consumers surplus maximum at 3.55 % on accepting lower price from Malaysia, Indonesian producers loss on finished goods maximum at 3.55 % or surplus on crude or semi-finished goods maximum at 3.55 % for domestic production, Malaysian producers surplus maximum at 3.55 % because of lower Indonesia electronics ACEPT, and tariff revenues fall maximum at 3.55 %. And for the only prob. (t-stat) significance of exi (4.767261) implies that IDR intents appreciation versus RMY and the result is net export of Indonesia electronics probability eroded until 4.8 %. And the
2
latest discussion that adjusted R which represent of determination from each sector that figure out the priority or strategic sector for Indonesia to do free trade. The stream from the highest to the lowest will be fisheries sector (71.32 %), wood based-products sector (67.8 %), the agro based-products sector (54.5 %), electronics sector (37.8 %), automotive sector (28.5 %), rubber based-products (24.8 %), and textiles and apparel (18.1 %).
4.1. Indonesia to Philippines
Then prob.(t-stat) is significant for variable Yi at 1 % level, Yj at 5 % level, Dij at 5 % level, and exj at 1 % level. Interestingly arrives to both value have negative sign, Yi (-2.821247) and Yj (-2.526011). A little bit impossible both countries to be absorption country in the same moment. The explanation must be breakdown detailing in each sub-item in this sector and could be in automotive the trading between both countries inefficient.
However by refer to table 5.6 that in real Indonesia surplus versus Philippines in automotive at US$ 513,388,000. Researcher has argument that Indonesia should stand to descriptive result rather than empirical result. Dij which has -9.741638 that making Indonesian producers spend extra cost until 9.8 % linkage to all item cost of trade because of distance both countries. About the one only significant of exj (1.226261) indicates that Philippines Peso (PHP) is appreciated against IDR, therefore the automotive goods from Indonesia is cheaper than Philippines and increase Indonesia net export approximately at 1.22 %.Change over to rubber based-products that its prob. (F-stat) is highly significant at 1 % level. All independent variables are driven group for increasing or decreasing the Indonesia trade balance for rubber based-products to Philippines.
The star symbol of independent variables identifies that variables have significance in different level of confidence of prob. (t-stat). Yi-2.025016 and Yj-3.397438 have similar case with automotive sector. The fact, Indonesia is the biggest provider natural rubber and would be Indonesia natural comparative advantage plus primacy in scale of economies. Refer to previous statement, rubber based-products market size in Philippines will be filled by Indonesian producers in context bilateral free trade. In Dij with -19.46577 describes how expensive for Indonesian producers in term of costs of trade. So that they must provide extra expenses until 19,5 %. However, this is worth to gain big profit from Philippines market size. The exi (1.081600) has meaning that IDR is appreciated against PHP and surely disadvantage for Indonesia to decrease its net export of rubber based-products until 1.1 %.
For sector of wood based-products, the prob. (F-stat) is highly significant at 1 % level. So that all independent variables are quite steady to improve constructive or vice versa the Indonesia trade balance of wood based-products to Philippines. The expression of star contained in particular independent variable that related to significance of prob. (t-stat) at any kind of level of confidence. Looking analysis for Yi (-2.841708) that Indonesia is absorption country. This is signal for Indonesia in real free trade that might be it comes true if not anticipated in smart way. But not much worried about empirical output where descriptive finding expressed in different pattern that Indonesia surplus against Philippines of wood based-products at US$ 21,400,000 (table 5.6).
It is better to hold on to descriptive finding rather than empirical. Because it is supporter by fact that forest zone of Indonesia is greater than Philippines so that it becomes natural comparative advantage and making role of trading play with Philippines in real AFTA 2015. Dij is -14.43766 is associated with extra expenses must be taken out from Indonesian producers pocket of money to cover cost of trading wood based-products to Philippines until 14.4 %. The significance of ti (2.971138) links to trade strategy and in this time Indonesia to be importer and trade creation must be implemented. Trade creation will affect to Indonesia producers loss maximum at 2.98 % for finished products but surplus for crude or semi-finished products for producing added value maximum at 2.98 %, Indonesia consumers surplus maximum at 2.98 % on getting lower price from foreign and domestic, Philippines producers surplus maximum at 2.98 % on getting lower Indonesia ACEPT for wood based-products,
and tariffs revenues fall maximum at 2.98 %. Then the ex i(1.622403) and exj (-1.124434) imply IDR is appreciated versus PHP and potentially undermine Indonesian net export of wood based products until maximum 2.74 % {1.622403-[-1.124434]. Turned to agro based-products sector and highly significant for its prob. (F-stat) at 1 % level. This description states that all independent variables move along to impact the constructive or vice versa of Indonesia trade balance to Philippines for agro based-products. The star symbol that contained on specific independent variables will correlate obviously with the significance of prob. (t-stat) at any level of confidence. Yi has value -3.283774 and Yj has value -4.634652 reflect both countries are absorption countries. This unique condition should be restored again to descriptive finding on table 5.6 in which Indonesia huge surplus about US$ 238,428,000 to Philippines agro based-products.
For that, the descriptive finding is better than empirical result. Dij is -25.68694 reads as additional cost for Indonesian producers maximum at 25.7% on trade costs cause distance both countries. However it is no big deal because Indonesia net export to Philippines so far in totally surplus from 2002 until 2008. And the last is positive sign of exi (1.504422) incurs IDR is appreciated to PHP and certainly drains Indonesia net export of agro based-products until 1.5 %. Textiles and apparel based on table 9 (see appendix A) has significant prob. (F-stat) at 1 % level. It exhibits that independent variables can measure performance of Indonesia trade balance to Philippines for textiles and apparel in simultaneously. Now the analysis moves to each significance of prob. (t-stat) for independent variables at different level of confidence that Yi with value -0.000177 is associated with absorption country which placed by Indonesia. When in fact the real which Indonesia surplus about US$194,602,000 in textiles and apparel to Philippines (see table 5.6). No doubt that Indonesian textiles and manufacturing is more sophisticated than Philippines refer to Indonesia surplus. Yi in negative sign could be interpreted that the circumstances change and Indonesia in real AFTA will become real absorption country.
This issue should be taken seriously otherwise it is bad for Indonesia in the advance AFTA 2015. Dij by coefficient value of -0.001825 is relation with costs of trading because distance and actually the amount is slightly so that Indonesian producers just ignore it. Beside it is really not much impact to Indonesia trade balance performs to Philippines in textiles and apparel. exi (7.693473) and exj (-5.124539) discloses that IDR is too expensive against PHP and drop Indonesia net export maximum at 2.58 % {7.693473-[5.124539]}.
Obviously that prob. (F-stat) of fisheries is highly significant at 1 % level. So that the all independent variables govern as simultaneously to existing Indonesia trade balance of fisheries to Philippines. The significance of prob.(t-stat) marked with star symbol on selected independent variables in different level of confidence. The Yi (-2.911854) and the Yj (4.468222) are defined that Indonesia is absorption country. In line with descriptive finding that Indonesia surplus about US$ 21,576,000 to Philippines fisheries commodity. It would be nicely to stick on descriptive finding whereas the empirical is better to merely to enrich information. While tj with value 2.493441 contributes some consequences; first Indonesia as exporter, second; Indonesia takes trade creation to Philippines, and the longest one is Indonesian producers surplus maximum at 2.5 %, Philippines producers loss maximum at 2.5 % if finished goods and surplus maximum at 2.5 % if crude or semi-finished goods, Philippines consumers surplus maximum at 2.5 %, and tariffs revenues fall maximum at 2.5 %. Then for exi (0.506773) exhibits IDR is more powerful to PHP and potentially reduction Indonesia net export approximately at 0.51 %.
For electronics, there is significant prob. (F-stat) at 1 % level and all independent variables in group are really influencing performance of Indonesia trade balance to Philippines in electronics sector. Next on prob. (t-stat) examines that the particular variable which has significance will be put star symbol in any kind level of confidence as its significance requirement. Dij is significant with value -7.821622 that correlation with trading expenses must be covered by Indonesian producers approximately at 7 % extra costs because of distance both countries. That way can eroded profit of Indonesian producers and either Indonesia net export of electronics to Philippines. Then exi (0.709276) whereas IDR is too performing against PHP so that impact to intimidate Indonesia net export until 0.7 % because of Indonesia electronics is more expensive based on Philippines producers point of view.
2 In another urgent discussion about Indonesia trading with Philippines is the determination Adjusted R to show strategic sector for Indonesia in order to be role of play versus Philippines in real AFTA 2015. The sequence from the first until the last position is fisheries (76.9 %), agro based products (74.1 %), wood based products (66.94 %), rubber based products (43.34 %), automotive (42.5 %), textiles and apparel (31.7 %), and electronics (26.8 %)
4.4. Indonesia to Singapore
Table 10 exhibits many urgent information related to Indonesia to Singapore in bilateral trade. Let discuss about automotive in which its prob. (F-stat) is highly significant at 1 % level. The logic explanation is independent variables in simultaneous affecting Indonesia trade balance to Singapore for automotive sector. The study more detail addressed to prob. (t-stat) of independent variables which significance owned star marking in any type of level of confidence. Yi (-2.482582) and Yj (-2.280842) are unique circumstances that both countries as absorption country because of negative sign for both. In the near future or in the near real AFTA might be the dynamic trading turn around in constructive or destructive for Indonesia depend on the trade policy it takes. The exj (1.620991) indicates that Singapore Dollar is appreciated against IDR and directly increase Indonesia net export of automotive maximum at 1.6 %.
Analysis of rubber based products that its prob. (F-stat) is highly significant at 1 % level. This statistic evidence is very closely in measuring the fluctuation of dependent variable (Indonesia trade balance of rubber based-products to Singapore) by independent variables as simultaneouslyStar symbol indicates that this specific independent variables are significant of prob. (t-stat) for any level of confidence. Yi (-2.231605) and Yj (-3.193488) imply that both countries to be absorption country and these are abnormal empirical results again. To solve this circumstances, the descriptive findings on table 5.3 must be restored in which Indonesia to Singapore for rubber based-products huge surplus about US$ 1,307,157,000.
This proves that in current condition Singapore is more fit to be absorption country rather than Indonesia. In fact no doubt that Indonesia is the one of biggest natural rubber provider in the world. Dij (-16.82774) describes that Indonesian producers must spend expenses until 16.8 % to cover all costs of trading because of distance both countries and reducing the profit and either Indonesia trade balance. exi (0.887683) explains how IDR is appreciation to SGD and potentially Indonesia net export slices maximum at 0.88 %.
For wood based-products, the prob. (F-stat) is highly significant at 1 % level. The effect is all independent variables afford to influence Indonesia trade balance to Singapore in wood based-products sector as simultaneously. The star marking infers the particular independent variables are significant for prob. (t-stat) in any level of confidence. Yi (-2.559711) implies that Indonesia is absorption country. When in fact, Singapore is absorption country based on descriptive finding on previous table 5.3 where Indonesia surplus US$ 351,771,000 against Singapore for wood based-products. Then Dij (-10.18010) is associated with trade expenses toward distance both countries that Indonesian producers shall bear the cost maximum at 10.18 % and indeed eroded their profit and Indonesia net export for wood based-products. exi (1.359832) and exj (-1.003077) show that IDR is appreciated versus SGD and impact to diminish Indonesia net export until 2.4 % {1.359832-[-1.003077]}.
Moving to agro based-products where its prob. (F-stat) is highly significant at 1 % level. Independent variables in joint movements are robust impact to Indonesia trade balance to Singapore for agro based-products. Now checking the star symbol of special significance independent variable for Yi, Yj, Dij, and exi at difference level of confidence. The value of Yi (-3.103830) and Yj, (-4.427253) indicates that abnormal empirical output are both countries are being absorption. Shifting to Dij (-22.61019) that negative sign reveals swelling costs for Indonesia producers to commerce with Singapore maximum at 22.6 %. And finally the only exi (1.318602) indicates IDR is appreciation and potentially interrupt Indonesia net export maximum at 1.32 %.
Prob. (F-stat) of textiles and apparel (table 11 in Appendix A) is significant at 10 % level. The only one significance of prob. (t-stat) for Yi (-0.806292) with negative sign exhibits that Indonesia is absorption country. This opposite with descriptive outcome (see table 5.3) which Indonesia surplus at US$ 509,242,000 to Singapore. Refer to descriptive outcome is more logic than empirical result.
Take a look to fisheries sector that significance prob. (F-stat) at 1 % level. The significance prob. (F-stat) provides simultaneous action to affect Indonesia trade balance to Singapore for fisheries sector. Star symbol is placed to significance particular independent variable refer to prob. (t-stat) for any kind of level of confidence. Yi (-3.033221) and Yj, (4.960436) explain Indonesia becomes absorption country. Matter of fact that Indonesia actually surplus at US$ 455,462,000 against Singapore for fisheries (see table 5.3). The descriptive finding presents the real Indonesia position that fixed for Singapore to be absorption country. Dij (6.318731) is definitely gaining for Indonesian producers because they can save trade expenses maximum at 6.32 % to Singapore. This condition in line with fact that the distance of port sea between both countries nearby if pursued from Riau Island province. The only significance of tj, (2.755098) describes that Indonesia as exporter must conduct trade creation. The trade creation impact to Indonesian producers surplus, Singapore consumers surplus, the Singapore producers also surplus for crude or semi-finished goods and loss for finished goods, and Singapore government for tariffs revenues decline. In this context the number of rate for surplus or loss can not figure out because actually Singapore ACEPT was already zero percent.
Moving to Yi (-2.923801) and Yj (-2.963539) has significance level of prob. (t-stat) at 1 % level, present that both countries are absorption because of their negative sign. To solve this ambiguous must refer to descriptive finding that Indonesia is absorption country because of very big deficit until US$ 2,536, 215 (see table 5.5). This proves that
Thailand is definitely superior in agro based-products because of its compcompetitive added value that making its strong brand toward ASEAN region and might be the world. The Dij is -11.82369 so that Indonesian producers spend extra costs until 11.8 % because of the distance both countries and also impact to erasing their profits and either Indonesia trade balance. The tj (-2.221986) depicts that as exporter, Indonesia runs trade diversion refer to AFTA. The effects are Indonesian producers loss maximum at 2.22 %, Thailand producers surplus maximum at 2.22 % on equate its price with Indonesia, Thailand consumers loss maximum at 2.22 % on getting higher price from foreign and domestic, and tariffs revenues raise maximum at 2.22 %. Change over to exi (0.603673) and exj (1.212119) that mean exi still bigger coefficient than exj that make IDR is better value than THB so that potentially scrape Indonesia trade balance until 0.6 % {0.603673-[1.212119]}.
According to table 13, in textiles and apparel is not significant prob. (F-stat) so that this sector is obviously not strategic again for Indonesia in order to international trade with Thailand. It could be China and India become primary supplier for Thailand market size about textiles and apparel.
In fisheries sector, its prob. (F-stat) is highly significant at 1 % level and it means that as joint maneuvers afford to check the increasing or decreasing of Indonesia trade balance to Thailand. The significance of prob. (t-stat) is given to particular independent variable in difference level of confidence. Yi (-2.538768) and Yj (4.601110) depict that Indonesia is absorption country. Recall from table 5.5 which provided information Indonesia surplus at US$ 258,639,000. In the fact Indonesia is superior on fisheries rather than Thailand where Indonesia had the largest zone of ocean in ASEAN. And more suitable that Thailand in this term to be absorption country.
However, the negative sign from empirical result might be defined that if Indonesia is careless, the role of play will be taken by Thailand and that time Indonesia to be real absorption country. Stir to ti (-3.535508) and tj (5.750686) that as exporter Indonesia takes trade creation and as importer takes trade diversion. Trade creation related to Indonesian producers surplus approximately at 5.75 %, Thailand producers loss at 5.75 % if finished goods and surplus maximum at 5.75 % if crude or semi-finished goods, Thailand consumers surplus maximum at 5.7 %, and tariffs revenues fall maximum at 5.75 %. Trade diversion depicts Indonesian producers surplus maximum at 3.5 % on harmonizing its price with Thailand, Thailand producers surplus approximately at 3.5 %, Indonesia consumers loss maximum at 3.5 % on getting higher price from foreign and domestic, and tariffs revenues raise about 3.5 %. The exi (0.620905) presents IDR is appreciated to THB and potentially to threat Indonesia net export quality approximately at 0.62 %.
Then electronics sector is highly significant at 1 % level and as working together impacts the quality of Indonesia trade balance to Thailand for electronics. The one only significance from independent variable is placed by exi (0.839907) in which IDR is appreciated to THB and potentially disrupts the performance Indonesia trade balance maximum at 0.83 %.
2 And the key sector for Indonesia goes to free trade with Singapore depend on value of adjusted R. The first sequence until the last sequence would be fisheries (76.5 %), agro based products (70.12 %), wood based-products (59.6 %), rubber based-products (44.64 %), automotive (36.8 %), electronics (27.6%), and textiles and apparel (17.66 %).
4.5. Indonesia to Thailand
From table 12 can be expressed important outcomes which still form statistic number per sector. In automotive sector can be seen from the table above that its prob. (F-stat) is highly significant at 1 % level. And onwards to prob. (t-stat) that the significance is belong to Yi, Yj, and exj at any kind of level of confidence. Yi (-2.482582) and Yj (-2.280842) read that both absorption country. Actually, refer to descriptive findings (see table 5.5) that more suitable Indonesia position as absorption country.
Nothing can do for Indonesia except changes its trade strategy to Thailand in automotive in real AFTA 2015. It could be Thailand definitely superior than Indonesia because Thailand has become the base of the automotive industry is strategically advantageous for famous brands such Honda, Toyota, Yamaha, Honda and others. exj (1.620991) indicates Thai Bath (THB) is appreciation to IDR and seems advantage for increasing net export Indonesia until 1.62 %.
Switch to rubber based-products in which prob. (F-stat) is highly significant at 1 % level and performs to impact Indonesia trade balance of rubber based-products to Singapore. The star symbol indicates significance of prob.(t-stat) for particular independent variables in any level of confidence. Yi (-2.091311) and Yj (-1.281840) imply Indonesia and Thailand are absorption country. However, the case is similar with automotive where Indonesia deficit at US$ 324,193,000 with refer to descriptive finding (see table 5.5). For this sector Indonesia is more precisely to be absorption country.
Matter of fact that Thailand had natural rubber comparative advantage compare with Indonesia. Normally Indonesia got deficit. The ti (1.704444) makes lower Indonesia ACEPT than Thailand and would be Indonesia as importer related to trade creation policy. The consequences are Indonesian producers loss maximum at 1.7 % for finished goods and surplus maximum at 1.7 % for crude and semi-finished products, Indonesian consumer surplus maximum at 1.7 % and tariffs revenues fall maximum at 1.7 %. The exj (0.836867) explains THB is appreciation and potentially increasing Indonesia net export maximum at 0.83 %.
Singapore Wood based-products
§Indonesia fills market size of raw and intermediate to Singapore to raise Indonesia net export and another side Indonesia needs to import in limited basis for luxurious wood based-products from Singapore
§Higher trade costs are not good for Indonesia trade balance, and can be solved by shifting pattern of export through Indonesian port that closest one to Singapore to minimize trade costs
Agro based-products
§Indonesia takes role of play to meet Singapore’s highly consumption over agro based-products
§Higher trade costs are not good for Indonesia trade balance, and can be solved by shifting pattern of export through Indonesian port that closest one to Singapore to minimize trade costs
Fisheries §Indonesia takes role of play to meet Singapore’s highly consumption over fisheries because Singapore as absorption country, efficient costs trade, and trade creation
Thailand Rubber
§Importing from Thailand in raw material and intermediate products to proceed added value in Indonesia because of trade creation and then export it to Thailand itself and other greater demand country, even inside and outside ASEAN
§Indonesia imports finished and luxurious goods from Thailand to meet Indonesia’s highly consumption over finished and luxurious goods of rubber based-products
Wood Based- products
§Importing from Thailand in raw material and intermediate products to proceed added value in Indonesia because of Thailand cheaper price products and then export it to Thailand itself and other greater demand country, even inside and outside ASEAN
§Indonesia imports finished and luxurious goods from Thailand to meet Indonesia’s highly consumption over finished and luxurious goods of wood based-products
§Higher trade costs are not good for Indonesia trade balance, and can be solved by shifting pattern of export through Indonesian port that closest one to Thailand to minimize trade costs
Agro Thailand to meet Indonesia’s highly consumption over agro based-products
§Higher trade costs are not good for Indonesia trade balance, and can be solved by shifting pattern of export through Indonesian port that closest one to Thailand to minimize trade costs
Fisheries §Indonesia takes role of play to meet Thailand’s highly consumption over fisheries related its natural comparative advantage and also economies of scale
§Indonesia imports quality and unique products from Thailand to meet domestic consumption
§Higher trade costs are not good for Indonesia trade balance, and can be solved by shifting pattern of export through Indonesian port that closest one to Thailand to minimize trade costs
Indonesia to: Brunei Malaysia Philippines Singapore Thailand
Sector S P S P S P S P S P
Now then the Adjusted R has function to identify priority sector that advantageous for Indonesia to face bilateral free trade with Thailand in real AFTA 2015. The number one is agro based-products (79.5 %) and followed by rubber based-products (72.65 %), fisheries (66.27 %), wood based-products (57.7 %), automotive (36.8 %), electronics (23.51 %) and textiles and apparel (5.9 %).
5. Briefly Conclusion and Recommendation
5.1. Briefly Conclusion
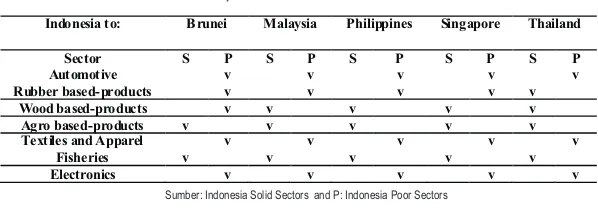
Table 2. Summary Indonesia Solid and Poor Sector to Face AFTA 2015
Sumber: Indonesia Solid Sectors and P: Indonesia Poor Sectors
The seven Indonesia sectors are ready to be fully integrated through AFTA 2015 with some constructive treatments and Priority (See Recommendation Points for solid sectors). Indonesia solid sectors to Brunei in AFTA 2015 are agro based-products and Fisheries. Indonesia to Malaysia, just for wood based-products, agro based-products, and fisheries. Indonesia to Philippines, Indonesia solid sectors are belong to wood based-products, agro based-products, and fisheries. Indonesia to Singapore, the Indonesia solid sectors related to wood based-products, agro based-products, and fisheries. And the last one that Indonesia to Thailand, Indonesia has solid sectors for rubber products, wood based-products, agro based-based-products, and fisheries.
5.2. Briefly Recommendation
Table 3. Recommendation Points for Indonesia Toward AFTA 2015
Indonesia
§Raising Indonesia net export to Brunei in finished goods,
§Shifting pattern of export through Indonesian port that the closest one to Brunei in order to minimize costs of trading
§Maintaining relative exchange rate of depreciation IDR to BRD
§Allowing Brunei to make export a lot finished goods to raise Indonesia’s government tariffs revenues
§Maintaining domestic production is lower price than Brunei
Fisheries §Raising Indonesia net export to Brunei in finished goods,
§Maintaining relative exchange rate of depreciation IDR to BRD
§Indonesia imports finished and unique goods from Brunei to such raw, intermediate, or finished goods with low price Malaysia’s products to meet domestic needs and the same time Indonesia exports a lot its original products to greater demand country, inside and outside ASEAN
§Higher trade costs are not good for Indonesia trade balance, and can be solved by shifting pattern of export through Indonesian port that closest one to Malaysia to minimize trade costs
Agro based-products
Fisheries §Raising Indonesia net export to Malaysia in raw, material, and
finished products in massively because of trade creation
§Indonesia imports finished and unique goods from Malaysia to meet Indonesian’s domestic consumption over fisheries commodities to offset the export one
Philippines Wood
based-products §
Raising Indonesia net export to Philippines in raw, material, and finished products in massively because of trade creation
§Indonesia imports finished and unique goods from Philippines to meet Indonesian’s domestic consumption over wood based-products commodities to offset the export one
§Higher trade costs are not good for Indonesia trade balance, and can be solved by shifting pattern of export through Indonesian port that closest one to Philippines to minimize trade costs
Agro
based-products §
Raising Indonesia net export to Philippines in form added value goods,
§Importing from Philippines much more raw material and intermediate products than finished goods to proceed added value in Indonesia through IDR is appreciation against PHP
§Higher trade costs are not good for Indonesia trade balance, and can be solved by shifting pattern of export through Indonesian port that closest one to Philippines to minimize trade costs
Fisheries §Raising Indonesia net export to Philippines in added value products
6. Reference
ASEAN Economic Community Blueprint (2008). ASEAN Secretariat, Jakarta, January 2008. ASEAN Economic Community Chartbook (2009). ASEAN Secretariat, Jakarta, September 2009.
ASEAN (2010). ASEAN Free Trade Area (AFTA Council), ., October
2009.
El-Agraa, Ali M. (1997). Economic Integration Worldwide, St Martins Press, New York.
Husted, Steven and Melvin, Michael (2010). International Economics, Eight Edition, Addison-Wesley. IMF (2009). International Financial Statistic, Washington 2009.
Krugman, Paul R. and Maurice Obstfeld. (2009). International Economics: Theory and Policy, Eight Edition, Addison-Wesley.
Market Analysis and Research, International Trade Center (2010). Trade Map, , October 2010.
Pelkmans, Jacques (2006). European Integration: Method and Economic Analysis, Third Edition, Pearson Education Limited.
Venables. J, Anthony (2000). International Trade; Regional Economic Integration, Prepared for the 'International Encyclopedia of Social and Behavioral Sciences' (Article 3.4 34); London School of Economics.
http://www.asean.org/19585.htm