Image segmentation by histogram thresholding
using hierarchical cluster analysis
Agus Zainal Arifin
a,*, Akira Asano
baGraduate School of Engineering, Hiroshima University, 1-4-1 Kagamiyama, Higashi Hiroshima 739-8527, Japan bDivision of Mathematical and Information Sciences, Faculty of Integrated Arts and Sciences, Hiroshima University,
1-7-1 Kagamiyama, Higashi Hiroshima 739-8521, Japan
Received 14 June 2005; received in revised form 22 February 2006 Available online 3 May 2006
Communicated by G. Borgefors
Abstract
This paper proposes a new method of image thresholding by using cluster organization from the histogram of an image. A new sim-ilarity measure proposed is based on inter-class variance of the clusters to be merged and the intra-class variance of the new merged cluster. Experiments on practical images illustrate the effectiveness of the new method.
2006 Elsevier B.V. All rights reserved.
Keywords: Image thresholding; Clustering; Inter-class variance; Intra-class variance
1. Introduction
Thresholding is a simple but effective tool for image seg-mentation. The purpose of this operation is that objects and background are separated into non-overlapping sets. In many applications of image processing, the use of binary images can decrease the computational cost of the succeed-ing steps compared to ussucceed-ing gray-level images. Since image thresholding is a well-researched field, there exist many algorithms for determining an optimal threshold of the image. A survey of thresholding methods and their applica-tions exists in literature (Chi et al., 1996).
One of the well-known methods is Otsu’s thresholding method which utilizes discriminant analysis to find the maximum separability of classes (Otsu, 1979). For every possible threshold value, the method evaluates the good-ness of this value if used as the threshold. This evaluation uses either the heterogeneity of both classes or the
homoge-neity of every class. By maximizing the criterion function, the means of two classes can be separated as far as possible and the variances in both classes will be as minimal as pos-sible. This method still remains one of the most referenced thresholding methods.
Minimum error thresholding method finds the optimum threshold by optimizing the average pixel classification error rate directly, using either exhaustive search or an iterative algorithm (Kittler and Illingworth, 1986). This method assumes that an image is characterized by a mixture distribution with the population of object and background classes are normally distributed. The probabil-ity densprobabil-ity function of the mixture distribution is estimated based on the histogram of the image.
Since the thresholding problem can be regarded as a clustering problem, Kwon (2004) proposed a threshold selection method based on the cluster analysis. He pro-posed a criterion function that involved not only the histo-gram of the image but also the information on spatial distribution of pixels. This criterion function optimizes intra-class similarity to achieve the most similar class and inter-class similarity to confirm that every cluster is well
0167-8655/$ - see front matter 2006 Elsevier B.V. All rights reserved. doi:10.1016/j.patrec.2006.02.022
* Corresponding author. Tel./fax: +81 82 424 6476.
E-mail addresses: [email protected] (A.Z. Arifin), asano@ mis.hiroshima-u.ac.jp(A. Asano).
separated. The similarity function used all pixels in two clusters as denoted by their coordinates.
Criterion-based thresholding algorithms are simple and effective for two-level thresholding. However, if a multi-level thresholding is needed, the computational complexity will exponentially increase and the performance may become unreliable (Chang and Wang, 1997).
This paper proposes a novel and more effective method of image thresholding by taking hierarchical cluster organi-zation into account. The proposed method attempts to develop a dendrogram of gray levels in the histogram of an image, based on the similarity measure which involves the inter-class variance of the clusters to be merged and the intra-class variance of the new merged cluster. The bot-tom–up generation of clusters employing a dendrogram by the proposed method yields a good separation of the clus-ters and obtains a robust estimate of the threshold. Such cluster organization will yield a clear separation between object and background even for the cases of nearly unimo-dal or multimounimo-dal histogram. Since the proposed method performs an iterative merging operation, the extension into multi-level thresholding problem is a straightforward task by just terminating the grouping when the expected num-ber of clusters of pixel values are obtained.
The concept of developing a dendrogram from a histo-gram was already employed in our previous work pre-sented in a conference paper (Arifin and Asano, 2004). This paper improves its merging criteria by involving inter-class variance and intra-class variance in the similar-ity measurement, so as to maximize the distance of cluster means, as well as the variance of the new merged cluster. This paper also provides comparisons of the quality of binarizations among the proposed method, Otsu’s method, and Kwon’s method, and shows the superiority of our method to the other methods, based on three kinds of quantitative comparison. The method has been developed not only from the theoretical interest, but also a practical applicability has been already presented in (Arifin et al., 2005).
The rest of this paper is organized as follows: The pro-posed algorithm is developed in Section2 its experimental results and quantitative comparison with other methods
are discussed in Section3, and finally, conclusions are pre-sented in Section4.
2. Histogram thresholding
If the histogram of an image includes some peaks, we can separate it into a number of modes. Each mode is expected to correspond to a region, and there exists a threshold at the valley between any two adjacent modes (Cheng et al., 2002). We propose a novel algorithm for estimating the optimal threshold using cluster analysis.
Initially, we regard that every non-empty gray level is a separate mode contained in a cluster. Then the similarities between adjacent clusters are computed, and the most sim-ilar pair is merged. The estimated threshold for the usual two-level thresholding is obtained by iterating this opera-tion until two groups of gray levels are obtained.
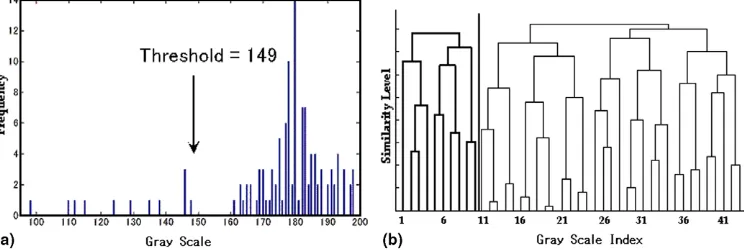
The hierarchical tree of this unification process is best viewed graphically as a dendrogram. Let us consider an example gray scale image, which contains 11·11 pixels and consists of 43 non-empty gray levels ranging from 98 to 198 with the histogram shown inFig. 1(a). Our method generates the dendrogram shown inFig. 1(b). The numbers along the horizontal axis of dendrogram represent the indi-ces of the gray levels numbered from 1 to 43. The height of the links between clusters represents the order of merging operations. The estimated thresholds for the t-level thres-holding are obtained by separating the dendrogram intot
groups by cutting the branch. It indicates that the multi-level thresholding is achieved quite straightforwardly by our method. For the usual two-level thresholding, i.e., the usual binarization, the threshold is obtained by cutting the dendrogram at the highest branch.
2.1. Cluster merging strategy
Let Ckbe thekth cluster of gray levels in the ascending
order, andTk be the highest gray level in the cluster Ck.
Consequently, the cluster Ck contains gray levels in the
range [Tk1+ 1,Tk], if we defineT0=1.
The proposed algorithm of cluster merging is summa-rized as follows:
1. We assume that the target histogram contains K differ-ent non-empty gray levels. At the beginning of the merg-ing process, each cluster is assigned to each gray level, i.e. the number of clusters isKand each cluster contains only one gray level.
2. The following two steps are repeated (Kt) times for
t-level thresholding.
2.1. The distance between every pair of adjacent clusters is computed. The distance indicates the dissimilar-ity of the adjacent clusters, and will be defined in the next subsection.
2.2. The pair of the smallest distance is found, and these clusters are unified into one cluster. The index of clustersCkandTkare reassigned since the number
of clusters is decreased one by the merging. 3. Finallytclusters,C1,C2,. . .,Ct, are obtained. The gray
levelsT1,T2,. . .,Tt1, which are the highest gray levels of the clusters, are the estimated thresholds. For the usual two-level thresholding, t= 2 and the estimated threshold isT1, i.e., the highest gray level of the cluster of lower brightness.
2.2. Distance measurement
The proposed definition of the distance between two adjacent clusters in the histogram is based on both the dif-ference between the means of the two clusters and the var-iance of the resultant cluster by the merging.
To measure the above two characteristics, we regard the histogram as a probability density function. Let h(z),
z= 0, 1,. . .,L1, be the histogram of the target image, where z indicates the gray level and L is the number of available gray levels including empty ones. The histogram
h(z) indicates the occurrence frequency of the pixel with gray level z. If we define p(z) as p(z) =h(z)/N, where N
is the total number of pixels in the image,p(z) is regarded as the probability of the occurrence of the pixel with gray levelz. We also define a functionP(Ck) of a clusterCkas
This function indicates the occurrence probability of pixels belonging to the clusterCk.
The distance between the clustersCk1 andCk2 is defined
as
The two parameters in the definition correspond to the inter-class variance and the intra-class variance, respec-tively. The inter-class variance, r2
I(Ck1,Ck2), is the sum
of the square distances between the means of the two clus-ters and the total mean of both clusclus-ters, and defined as follows:
The intra-class variance,r2
AðCk1[Ck2Þ, is the variance of all
pixel values in the merged cluster, and defined as follows:
r2
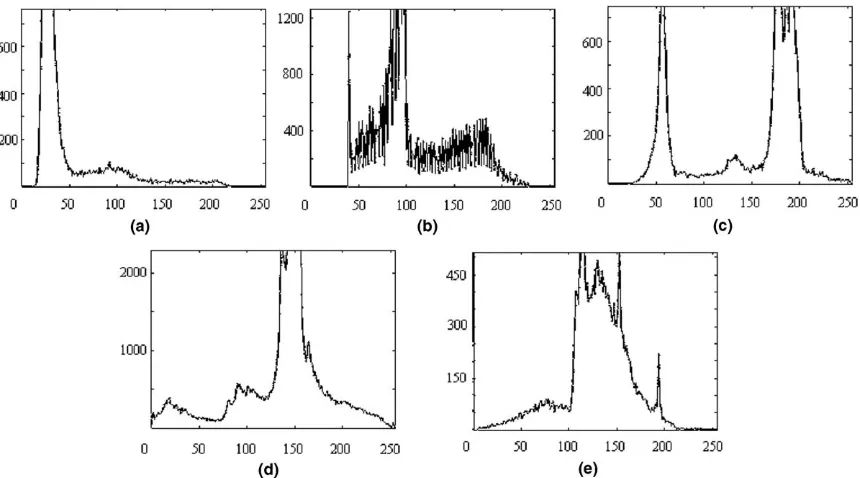
In order to evaluate the performance of the proposed method, our algorithm has been tested using images 1–5 (see Fig. 2). Image 2 and 5 are provided by The Math-Works, Inc. Fig. 3shows the corresponding histogram of the original images. It is observed that the shapes of histo-grams are not only bimodal or nearly bimodal, but also unimodal or multimodal.
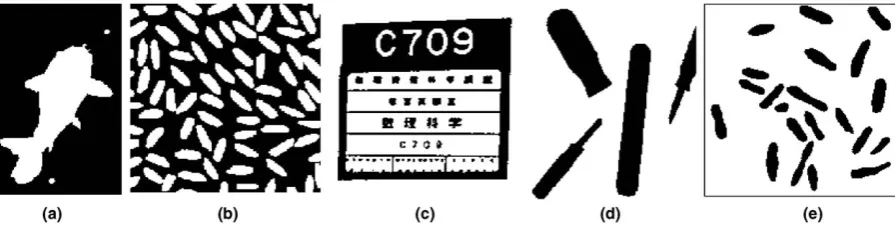
We have compared our method with three others: (i) Otsu’s thresholding method (Otsu, 1979), (ii) Minimum error thresholding method (KI’s method) (Kittler and Illingworth, 1986), and (iii) Kwon’s threshold selection method (Kwon, 2004). The thresholded images using the proposed method are shown inFig. 4, whileFigs. 5–7show thresholded images by using Otsu’s method, KI’s method, and Kwon’s method, respectively. The threshold values determined for each image using the three different meth-ods are summarized inTable 1.
The ground truth images shown inFig. 8are generated by manually thresholding the original images shown in
Fig. 2. Original images: (a) image 1, (b) image 2, (c) image 3, (d) image 4 and (e) image 5.
Fig. 3. Histogram of the experimental images: (a) image 1, (b) image 2, (c) image 3, (d) image 4 and (e) image 5.
Fig. 4. Thresholded image obtained by the proposed method: (a) image 1, (b) image 2, (c) image 3, (d) image 4 and (e) image 5.
pixels are misclassified into background in Figs. 5–7than that inFig. 4. The border line around the image 5 is clas-sified as the only object inFig. 6, due to extreme difference of frequency from the other peaks in the histogram.
In order to compare the quality of the thresholded images, we quantitatively evaluated the performance of
the method against the two other methods, using the mis-classification error (ME), (Sezgin and Sankur, 2004), rela-tive foreground area error (RAE) (Zhang, 1996; Sezgin and Sankur, 2004), and modified Hausdorff distance (MHD) (Dubuisson and Jain, 1994; Sezgin and Sankur, 2004).
ME is defined in terms of the correlation of the images with human observation. It corresponds to the ratio of background pixels wrongly assigned to foreground, and vice versa. ME can be simply expressed as
ME¼1jBO\BTj þ jFO\FTj
jBOj þ jFOj
; ð7Þ
where background and foreground are denoted byBOand
FO for the original image, and by BT and FT for the test image, respectively. RAE measures the number of discrep-ancy of thresholded image with respect to the reference image. It is defined as
Fig. 6. Thresholded image obtained by KI’s method: (a) image 1, (b) image 2, (c) image 3, (d) image 4 and (e) image 5.
Fig. 7. Thresholded image obtained by Kwon’s method: (a) image 1, (b) image 2, (c) image 3, (d) image 4 and (e) image 5.
Table 1
Threshold values determined using three threshold selection algorithms Sample images Threshold selection methods
Otsu’s method
Kwon’s method
KI’s method
The proposed method
Image 1 77 30 44 59
Image 2 125 96 132 105
Image 3 122 174 92 161
Image 4 110 146 56 121
Image 5 96 127 0 102
RAE¼
whereAOis the area of the reference image, andATare is the area of thresholded image. The shape distortion of the thresholded regions to the ground truth shapes can be
mea-sured by the modified Hausdorff distance (MHD) method. MHD is defined as
FO and FT denote foreground area pixels in the original image and the result image, respectively.
Table 2shows the ME, RAE, and MHD values for the thresholded image compared to the ground-truth image for each algorithm. For the ME evaluation, the thresholded images obtained by the proposed method gave the lowest ME values indicating the smallest ratio of background pixels wrongly assigned to the foreground, and vice versa. Similarly, for the RAE evaluation, the least values were obtained from the images thresholded by the proposed method indicating the largest match of the segmented objects regions. MHD evaluation shows that the smallest amount of shape distortion is obtained by the proposed method. Thus, according to three evaluations, the pro-posed algorithm seems to be the best, having less misclassi-fication error and less relative foreground area error.
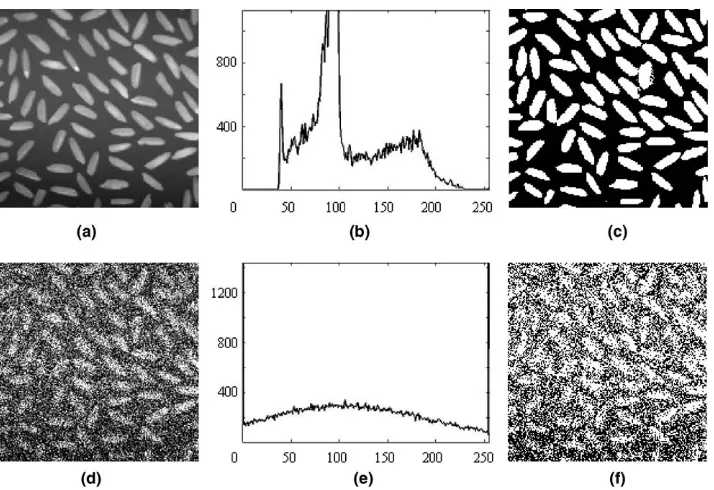
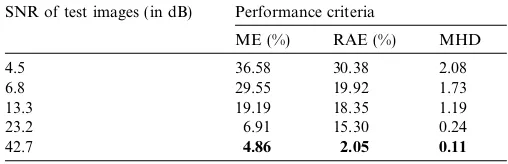
To demonstrate the robustness of the proposed method in the presence of noise, its application to several test images generated from image 2 by adding increasing quan-tities of noise with Gaussian distribution, with standard deviations of 1, 8, 26, 57, and 81, respectively. Each test image was characterized with SNR obtained by
Table 2
Performance evaluations of the proposed method and comparison with three other methods
Image 1 5.71% 26.66% 2.72% 1.91% Image 2 8.51% 13.12% 10.35% 4.68% Image 3 6.30% 9.72% 9.37% 1.38% Image 4 5.06% 26.68% 16.64% 3.05% Image 5 3.60% 30.69% 15.50% 2.89% RAE
Image 1 25.66% 54.52% 10.68% 7.81% Image 2 22.05% 19.73% 27.80% 4.65% Image 3 18.06% 21.78% 26.85% 3.80% Image 4 18.90% 50.38% 66.70% 7.59% Image 5 19.47% 63.02% 87.40% 13.99% MHD
Image 1 0.77 7.93 1.04 0.11
Image 2 0.64 0.87 0.84 0.18
Image 3 0.54 0.53 1.21 0.04
Image 4 0.53 18.30 42.23 0.18 Image 5 0.25 6.35 31.50 0.18 Note: Least values are bold-faced.
SNR¼10 log
(x,y) in the reference and test images, respectively. Nx
and Nx denote the number of columns and rows of
the image, respectively. The corresponding SNR of the test images are 4.5 dB, 6.8 dB, 13.3 dB, 23.2 dB, and 42.7 dB. Fig. 9(a) and (b) illustrate the test image and its histogram for SNR of 42.7 dB and Fig. 9(d) and (e) for SNR of 4.5 dB, respectively. The thresholded images of the corresponding test images are shown in Fig. 9(c) and (f), respectively. Both images exhibit a good degree of similarity with the ground truth of the original image shown in Fig. 8(b) and illustrate the robustness of the proposed method in the presence of noise. Table 3 shows the performance evaluation of the proposed method for all test images with respect to the ground truth shown in Fig. 8(b). It is noticed from Table 3 that for the test image with SNR of 23.2 dB, the ME, RAE, and MHD evaluations obtained by the proposed method are better than those of three other methods which are applied to image 2 without noises.
4. Conclusions
In this paper, we have presented a new gray level thres-holding algorithm based on the close relationship between the image thresholding problem and the cluster analysis. The key point of this algorithm is that the cluster similarity measurement is used to control the selection of the thres-hold value.
The proposed similarity measurement uses two criteria, the mean cluster distances and variance. These criteria correspond to the intra-class variance and the inter-class variance, respectively. The iterative merging ultimately
produces two clusters, from which the optimal threshold can be estimated.
From the evaluation of the resulting images, we con-clude that the proposed thresholding method yields better images, than those obtained by the widely used Otsu’s method, KI’s method, and Kwon’s method. The images thresholded by the proposed method correspond well to ground truth images. Evaluation of the application to sev-eral test images with different level of noises illustrates the robustness of the proposed method in the presence of noise. It is obviously straightforward to extend the method to multi-level thresholding problem by terminating the grouping process as the expected segment number is achieved.
Acknowledgement
This research is partially supported by the 2004 re-search-promoting budget of Hiroshima University.
References
Arifin, A.Z., Asano A., 2004. Image Thresholding by Histogram Segmentation Using Discriminant Analysis. In: Proceedings of Indo-nesia–Japan Joint Scientific Symposium 2004: IJJSS’04, pp. 169–174. Arifin, A.Z., Asano, A., Taguchi, A., Nakamoto, T., Ohtsuka, M.,
Tanimoto, K., 2005. Computer-aided system for measuring the mandibular cortical width on panoramic radiographs in osteoporosis diagnosis. In: Proceedings of SPIE Medical Imaging 2005—Image Processing Conference, pp. 813–821.
Chang, C.-C., Wang, L.-L., 1997. A fast multilevel thresholding method based on lowpass and highpass filter. Pattern Recognition Letters 18, 1469–1478.
Cheng, H.D., Jiang, X.H., Wang, J., 2002. Color image segmentation based on homogram thresholding and region merging. Pattern Recognition 35, 373–393.
Chi, Z., Yan, H., Pham, T., 1996. Fuzzy Algorithms: With applications to images processing and pattern recognition. World Scientific, Singapore. Dubuisson, M.P., Jain A.K., 1994. A modified Hausdorff distance for object matching. In: Proceedings of ICPR’94, 12th International Conference on Pattern Recognition, pp. A-566–A-569.
Kittler, J., Illingworth, J., 1986. Minimum error thresholding. Pattern Recognition 19, 41–47.
Kwon, S.H., 2004. Threshold selection based on cluster analysis. Pattern Recognition Letters 25, 1045–1050.
Otsu, N., 1979. A threshold selection method from gray-level histograms. IEEE Transactions of Systems, Man, and Cybernetics 9, 62–66. Sezgin, M., Sankur, B., 2004. Survey over image thresholding techniques
and quantitative performance evaluation. Journal of Electronic Imaging 13 (1), 146–165.
Zhang, Y.J., 1996. A survey on evaluation methods for image segmen-tation. Pattern Recognition 29, 1335–1346.
Table 3
Performance evaluations of the proposed method for noise robustness SNR of test images (in dB) Performance criteria
ME (%) RAE (%) MHD