Diet and growth in infancy: relationship to socioeconomic
background and to health and development in the Avon
Longitudinal Study of Parents and Children
Pauline M Emmett and Louise R Jones
To assess the relationship between diet and growth in infancy and socioeconomic
background, all publications from the Avon Longitudinal Study of Parents and
Children (ALSPAC) covering breastfeeding, diet and growth in infancy, and the
associations of these factors with socioeconomic background and later health and
developmental outcomes were reviewed. Diet was assessed by parent-completed
food records and parent-completed food frequency questionnaires covering infant
feeding practices. Infancy growth was monitored through routine screening and by
standardized measurements. Indicators of socioeconomic background were
obtained by parent-completed questionnaires. Childhood outcomes were measured
by standardized procedures. Rapid early weight gain was associated with later
obesity. Longer breastfeeding duration was associated with lower body fat, but not
lower body mass index, and with higher IQ in mid-childhood. Breastfed infants were
better at regulating their energy intake than bottle-fed infants. In bottle-fed infants,
energy intake at 4 months was associated with greater weight gain up to 5 years of
age. Feeding cow's milk as a main drink in infancy was associated with anemia and
high salt intake. Maternal education was a strong determinant of dietary
differences: low education was associated with never breastfeeding and not
following feeding guidelines. ALSPAC has provided unique insights into the
relationship between diet and growth in infancy and later developmental outcomes.
© 2014 International Life Sciences InstituteINTRODUCTION
Optimal nutrition during infancy and toddlerhood is essential because these periods are characterized by rapid growth and development. An infant’s birthweight will double in the first 6 months of life, triple by the end of the first year, and quadruple by the end of the second year.1 Therefore, relative to their size, infants have substantial requirements for energy and nutrients. Infancy is a criti-cal time for brain development; insufficient energy and/or essential nutrients during early infancy may have profound effects on the structural and functional devel-opment of the brain.2This is also the period when infants
make the important transition from an entirely milk-based diet to one that includes a variety of family foods from all food groups. The timing of this transition, the choice of foods and beverages to offer, and the context in which foods are offered can shape future eating habits and food preferences. This has implications that track through childhood and into adulthood.3,4Optimal introduction of complementary foods should lead to the development of healthy eating habits, which will help prevent the onset of diet-related diseases such as childhood obesity.4,5
Many studies have focused solely on the choice of milk feeding for the first few months of life, and there are numerous reports documenting the differences between Affiliations:PM EmmettandLR Jonesare with the Centre for Child and Adolescent Health, School of Social and Community Medicine, University of Bristol, Bristol, UK.
Correspondence:PM Emmett, Centre for Child and Adolescent Health, Oakfield House, Oakfield Grove, Bristol BS8 2BN, UK. E-mail: [email protected]. Phone:+44-117-3310195. Fax:+44-117-3313303.
Key words: breastfeeding, complementary feeding, diet, feeding guidelines, inequality, rapid early growth bs_bs_banner
Lead Article
doi:10.1111/nure.12122
breastfed and formula-fed infants. Extensive evidence exists documenting the benefits of breastfeeding, includ-ing improved infant health and lower rates of gastroin-testinal illness,6 respiratory illness, and allergies.7 Differences in growth patterns between breastfed and formula-fed infants have also been identified.8,9 Breastfeeding is associated with better intellectual and motor development10and lower chronic disease risk later in life.11
In contrast to the large literature on breastfeeding, there are relatively few studies on the complementary feeding process in the United Kingdom and other devel-oped countries. This is primarily because the debate on the optimal duration of exclusive breastfeeding has over-shadowed consideration of other aspects of the infant diet and their effect on childhood nutrition and long-term health outcomes. Although a global recommendation by the World Health Organization (WHO) for exclusive breastfeeding for the first 6 months of life was published in 2001,12its implementation is still shrouded in confu-sion and controversy. Countries have interpreted this rec-ommendation in different ways, and there was no advice given regarding formula-fed infants. In the United Kingdom, the WHO guidelines were adopted by the Department of Health in 2003 and extended to include formula-fed infants.13,14 The European Society for Paediatric Gastroenterology, Hepetology and Nutrition (ESPGHAN) Committee on Nutrition stated that exclu-sive breastfeeding for about 6 months was desirable and that complementary feeding should begin no sooner than 17 weeks but no later than 26 weeks.15 In Ireland, the guidelines recommend that complementary feeding should be introduced at approximately 6 months for breastfed infants and between 4 and 6 months for formula-fed infants.16
Guidance on what and how complementary (weaning) foods should be offered is often not clear. In the United Kingdom, mothers are provided with advice about the hygienic preparation of complementary foods and the consistency of the first foods to be offered, but they are not advised on specific first foods. Rather, they are instructed merely to introduce a wide variety of foods from the different food groups and to avoid certain foods that could be allergenic.17The WHO guidelines also give advice on the safe preparation of foods and the consis-tency of foods. They provide detailed information on the amount of complementary food needed, which is described in terms of energy requirements, and state that complementary foods should be nutritious, rich in micronutrients and iron, and have appropriate fat content.18 These recommendations, although laudable, require highly qualified people to be available to translate them into real foods to be used in the complementary feeding process in particular contexts.
The Avon Longitudinal Study of Parents and Chil-dren (ALSPAC) is one of the few studies in the world that has collected comprehensive dietary information during infancy and childhood and followed the same children through adolescence. It is important to put the ALSPAC results into the context of the infant feeding guidelines that were in use in the United Kingdom when ALSPAC mothers were recruited. ALSPAC infants were born in 1991 and 1992, and recommendations at the time were not very specific. Breastfeeding was recommended, and, regarding weaning, mothers were advised that “very few infants will require solid foods before the age of 3 months, but the majority should be offered a mixed diet not later than the age of 6 months.19Slightly different advice was published in 1994, suggesting 4 months as a more appro-priate age to start solid foods and emphasizing that cow’s milk should not be used as a main drink before 12 months.20 In the United Kingdom, a national cross-sectional survey of infant feeding practice has been carried out every 5 years since 1975, the most recent one in 2010.21The surveys that took place around the time of ALSPAC recruitment can be used to set ALSPAC in the context of these national data. The 1990 Infant Feed-ing Survey (IFS 1990)22showed that 62% of mothers ini-tiated breastfeeding, which increased to 66% in the 1995 survey (IFS 1995).23In 1990, 25% of mothers were still breastfeeding (not exclusively) at 4 months, a percentage similar to that in 1995 (27%).22,23The age of introduction to solids was slightly later in 1995 than in 1990; in 1990, 19% of mothers introduced solid foods before 8 weeks, which was down to 13% in 1995. Likewise, in 1990, 68% of mothers introduced solids by 3 months, which was down to 55% in 1995.22,23 ALSPAC infants were born in the middle of this period. This review will analyze the ALSPAC data, both cross-sectionally and longitudinally, on breastfeeding, diet and growth in infancy, and the relationship of these factors to socioeconomic back-ground and to later health and developmental outcomes.
METHODS
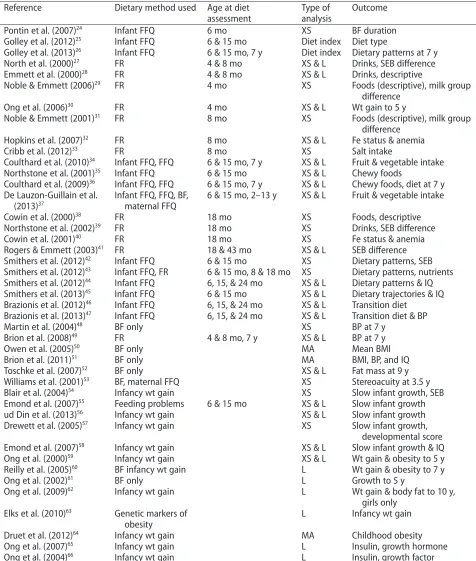
The literature was searched for all papers based on ALSPAC data and published by 2013 that address growth and dietary intake between the ages of 0 and 18 months. The 43 papers identified are listed in Table 1. Among them, 21 used questionnaire data relating to diet, 13 used food record data, and 10 used growth data only.24–66The main outcome measures for each paper are given in Table 1.
Subjects
health, behavior, and development as children grow from fetus through infancy and childhood to adulthood.67,68 From the outset, diet was considered a key environmental exposure. ALSPAC is an observational birth cohort study,
which recruited pregnant women resident in three Bristol-based health districts of the county of Avon, located in the southwest of England, with an expected delivery date between April 1991 and December 1992
Table 1 ALSPAC papers reviewed, listed in the order in which they are presented in the results.
Reference Dietary method used Age at diet
assessment
Type of analysis
Outcome
Pontin et al. (2007)24
Infant FFQ 6 mo XS BF duration
Golley et al. (2012)25 Infant FFQ 6 & 15 mo Diet index Diet type
Golley et al. (2013)26
Infant FFQ 6 & 15 mo, 7 y Diet index Dietary patterns at 7 y
North et al. (2000)27 FR 4 & 8 mo XS & L Drinks, SEB difference
Emmett et al. (2000)28
FR 4 & 8 mo XS & L Drinks, descriptive
Noble & Emmett (2006)29 FR 4 mo XS Foods (descriptive), milk group
difference
Ong et al. (2006)30 FR 4 mo XS & L Wt gain to 5 y
Noble & Emmett (2001)31
FR 8 mo XS Foods (descriptive), milk group
difference
Hopkins et al. (2007)32 FR 8 mo XS & L Fe status & anemia
Cribb et al. (2012)33 FR 8 mo XS Salt intake
Coulthard et al. (2010)34 Infant FFQ, FFQ 6 & 15 mo, 7 y XS & L Fruit & vegetable intake
Northstone et al. (2001)35
Infant FFQ 6 & 15 mo XS & L Chewy foods
Coulthard et al. (2009)36 Infant FFQ, FFQ 6 & 15 mo, 7 y XS & L Chewy foods, diet at 7 y
De Lauzon-Guillain et al. (2013)37
Infant FFQ, FFQ, BF, maternal FFQ
6 & 15 mo, 2–13 y XS & L Fruit & vegetable intake
Cowin et al. (2000)38
FR 18 mo XS Foods, descriptive
Northstone et al. (2002)39 FR 18 mo XS Drinks, SEB difference
Cowin et al. (2001)40
FR 18 mo XS Fe status & anemia
Rogers & Emmett (2003)41 FR 18 & 43 mo XS & L SEB difference
Smithers et al. (2012)42
Infant FFQ 6 & 15 mo XS Dietary patterns, SEB
Smithers et al. (2012)43 Infant FFQ, FR 6 & 15 mo, 8 & 18 mo XS Dietary patterns, nutrients
Smithers et al. (2012)44 Infant FFQ 6, 15, & 24 mo XS & L Dietary patterns & IQ
Smithers et al. (2013)45 Infant FFQ 6 & 15 mo XS & L Dietary trajectories & IQ
Brazionis et al. (2012)46 Infant FFQ 6, 15, & 24 mo XS & L Transition diet
Brazionis et al. (2013)47 Infant FFQ 6, 15, & 24 mo XS & L Transition diet & BP
Martin et al. (2004)48 BF only XS BP at 7 y
Brion et al. (2008)49
FR 4 & 8 mo, 7 y XS & L BP at 7 y
Owen et al. (2005)50 BF only MA Mean BMI
Brion et al. (2011)51
BF only MA BMI, BP, and IQ
Toschke et al. (2007)52 BF only XS & L Fat mass at 9 y
Williams et al. (2001)53
BF, maternal FFQ XS Stereoacuity at 3.5 y
Blair et al. (2004)54 Infancy wt gain XS Slow infant growth, SEB
Emond et al. (2007)55
Feeding problems 6 & 15 mo XS & L Slow infant growth
ud Din et al. (2013)56 Infancy wt gain XS & L Slow infant growth
Drewett et al. (2005)57 Infancy wt gain XS Slow infant growth,
developmental score
Emond et al. (2007)58 Infancy wt gain XS & L Slow infant growth & IQ
Ong et al. (2000)59 Infancy wt gain XS & L Wt gain & obesity to 5 y
Reilly et al. (2005)60 BF infancy wt gain L Wt gain & obesity to 7 y
Ong et al. (2002)61
BF only L Growth to 5 y
Ong et al. (2009)62 Infancy wt gain L Wt gain & body fat to 10 y,
girls only Elks et al. (2010)63 Genetic markers of
obesity
L Infancy wt gain
Druet et al. (2012)64 Infancy wt gain MA Childhood obesity
Ong et al. (2007)65
Infancy wt gain L Insulin, growth hormone
Ong et al. (2004)66 Infancy wt gain L Insulin, growth factor
Abbreviations: BP, blood pressure; BF, breastfeeding; BMI, body mass index; Fe, iron; FFQ, food frequency questionnaire; FR, food record; L, longitudinal; MA, meta-analysis; XS, cross-sectional; SEB, socioeconomic background; wt, weight.
(14,541 pregnancies). The recruitment area covered the city of Bristol and surrounding urban and rural areas, including towns, villages, and some industrial areas and farming communities (total population in 1991, approx. 0.9 million). Ethical approval for the study was obtained from the ALSPAC Law and Ethics Committee and local research ethics committees.
The indicators of socioeconomic background of the family at recruitment, such as highest educational attain-ment of the mothers, housing tenure, and maternal char-acteristics such as age, ethnicity, smoking status, and prepregnancy body mass index (BMI), are shown in Table 2. The cohort was population based and broadly representative, at recruitment, of the population of women with children under 1 year of age in Avon.67There was a relatively low percentage of ethnic minority women recruited: nonwhite women with children under 1 year of age constituted 2.2% of the ALSPAC participants, com-pared with 7.6% in the United Kingdom as a whole and 4.1% in Avon. The children (14,062 at birth, 13,988 alive at 1 year) were tracked via the following: parent-completed questionnaires, medical records, health service data, educational records, and hands-on assessment at dedicated research clinics. Table 2 shows the socioeco-nomic background of mothers recruited to ALSPAC, mothers whose children were recruited to the more intensive substudy (see below), and mothers who com-pleted food records at 15 months and 18 months, respec-tively. The retained mothers had higher educational attainment, were older, and had more favorable health indicators than the mothers who did not continue in the study or did not take part in the substudy.
A proportion of children born in the last 6 months of the recruitment phase (equivalent to 10% of the whole cohort) were randomly selected to take part in the substudy known as Children in Focus (CIF).67Parents were invited to bring these children to research clinics regularly from the age of 4 months (n = 1,432 ever attended).
Availability of data
As a longitudinal study with many different outcomes measured in different ways at various ages, sometimes, in selected subsamples only, ALSPAC had inevitable varia-tions in the numbers of subjects and the level of missing data in each analysis. The number of subjects included in the main analysis for each paper, as well as whether the analysis used the CIF substudy only, is noted in the present review. In general, tables in the published papers showed the background biases inherent in studying the group with available data compared with the group without data for that particular analysis. These have not been reprinted in this review; they show biases similar to
those shown in Table 2 and these become more pro-nounced as the study progresses. ALSPAC has invested considerable effort into minimizing study attrition and has been reasonably successful.67,68An investigation into the effect of selective attrition in ALSPAC on behavioral outcomes was carried out using teacher-rated assessment of 8-year-old children in schools in the study area.69 These data covered children currently engaged in the study (n =3,975), those recruited but no longer taking part (n=1,140), and those who had never been part of the study (n=4,383). Simulations (n=36) were carried out to explore the impact of selective recruitment and attrition. The analysis confirmed the selective bias in recruitment and attrition as shown in Table 2 and showed that behav-ioral problems were less prevalent in the retained group. However, the simulations showed that the prediction of teacher-reported behavioral problems by background factors was very similar in all three groups. The authors concluded that the presence of substantial selection bias did not greatly attenuate the relationship between expo-sure and this particular outcome, although there was a reduction in the range of the variables and an underesti-mation of prevalence of the outcome. Other outcomes may be affected more significantly.
Dietary assessment
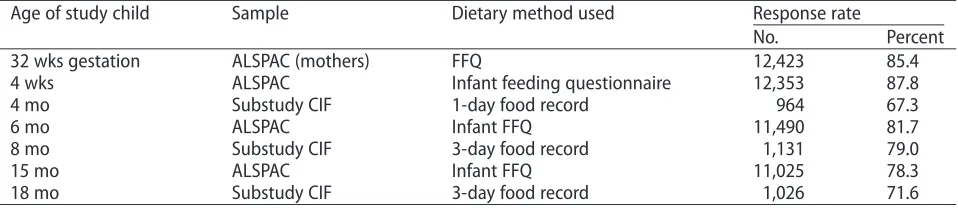
Table 3 lists the ages at which dietary assessment was carried out and the numbers of subjects with data avail-able at each age.
Table 2 Socioeconomic background of mothers recruited to ALSPAC and to the intensively studied Children in Focus (CIF) 10% substudy of ALSPAC, along with socioeconomic background of the mothers in both groups who supplied dietary information about their children in the second year of life.
Characteristic Whole ALSPAC
cohort (n=14,541)
Mothers who completed infant FFQ at 15 mo (n=11,025)
Mothers of infants in CIF substudy (n=1,432)
Mothers of infants in CIF substudy who completed diet record at 18 mo (n=1,026)
No. Percent No. Percent No. Percent No. Percent
Maternal education
No school qualification at age 16 3,709 25.5 1,847 25.8 334 23.4 217 21.1
School qualification obtained at age 16 4,273 29.4 3,754 34.0 486 33.9 368 35.9
Education beyond age 16 4,358 30.0 3,996 36.2 546 38.1 419 40.8
Data missing 2,201 15.1 428 3.9 66 4.6 22 2.2
Maternal age at birth
<20 y 655 4.5 347 3.1 46 3.2 24 2.3
20–24 y 2,682 18.4 1,801 16.4 194 13.6 127 12.4
25–29 y 5,369 36.9 4,354 39.5 575 40.1 409 39.9
30–34 y 3,808 26.2 3,336 30.3 460 32.1 349 34.0
≥35 y 1,382 9.5 1,187 10.7 157 11.0 117 11.4
Data missing 645 4.5 0 0
Housing tenure
Mortgaged or owned 9,757 67.1 8,308 75.4 1,086 75.8 829 80.7
Council and housing associations 2,138 14.7 1,365 12.4 171 11.9 101 9.9
Privately rented or other 1,440 9.9 1,006 9.2 134 9.3 83 8.1
Data missing 1,206 8.3 346 3.0 41 3.0 13 1.3
Ethnicity
White 11,927 82.0 10,332 93.7 1,337 93.4 984 95.9
Nonwhite 321 2.2 224 2.0 31 2.1 20 2.0
Data missing 2,293 15.8 469 4.3 64 4.5 22 2.1
Smoked in last trimester of pregnancy
Yes 2,413 16.6 1,845 16.7 199 13.9 123 12.0
No 9,671 66.5 7,861 71.3 1,044 84.0 802 78.2
Data missing 2,457 16.9 1,319 12.0 189 13.2 101 9.8
Maternal prepregnancy BMI
<18.5 1,482 10.2 1,188 10.8 65 4.5 40 3.9
18.5–24.99 8,602 59.2 7,372 66.9 911 63.6 691 67.3
25–29.99 1,739 12.0 1,482 13.4 211 14.7 151 14.7
≥30 631 4.3 538 4.9 86 6.0 58 5.7
Data missing 2,087 14.3 445 4.0 159 11.1 86 8.4
Abbreviations: BMI, body mass index; CIF, Children in Focus substudy; FFQ, food frequency questionnaire.
Nutrition
Reviews®
parent-completed FFQs covering the child’s diet at 7 years of age were also collected.
Infant feeding questionnaires. Parents were asked to com-plete questionnaires about their child’s health and devel-opment (http://www.bristol.ac.uk/alspac/researchers/ resources-available/data-details/questionnaires). The questionnaires were sent when children were ages 4 weeks, 6 months, and 15 months; all included a section about the child’s diet. The questionnaire for 4-week-olds collected data about breast and formula feeding, feeding schedule, feeding behaviors, and feeding difficulties. In the questionnaires about 6- and 15-month-olds, there were questions about breast and formula feeding, fre-quency of consumption of specific foods and drinks (listing foods likely to be offered to infants in the UK), age at the introduction of each food/drink, feeding behaviors, and feeding difficulties (refer to Table 3 for response rates). In the questionnaire about 15-month-olds, mothers were asked, “Babies’ first solid meals are usually a puree. When did your child first have a meal with ‘lumps’ in?” This was to ascertain when chewy/lumpy foods were first introduced. None of the ALSPAC infants received formula with added long-chain fatty acids because there was minimal availability of this type of formula in the early 1990s.
Diet records. As part of CIF, the infant’s diet was assessed by a research clinic at 4,298,31and 1838months (refer to Table 3 for response rates). The parents were invited, by post, to record in a structured diary all foods and drinks their child consumed over 3 individual days (1 day only at 4 months): preferably 1 weekend day and 2 weekdays. The parents could choose which days to record, so days were not necessarily consecutive. They were asked to bring the completed food record to a research clinic where, at 8 and 18 months, they were interviewed briefly by a member of the nutrition team to check for completeness and to clarify any uncertainties in the diaries, such as cooking methods. Foods and drinks consumed were recorded in
household measures. Parents were asked to record the use of medicines and vitamins in the drinks section of the diary. Mothers of breastfed infants were asked to record the duration of each feeding in minutes.
Food records were converted into weights and codes linkable to the energy and nutrient content correspond-ing to each of the drinks or foods consumed, uscorrespond-ing Microdiet software (University of Salford, UK) at 4 and 8 months and DIDO software (developed by the Dunn Nutrition Unit, Cambridge, UK)72at 18 months. Portion sizes for baby foods were usually described by spoonfuls or by the proportion of a jar eaten. Family foods were assigned weights based on reported food-portion sizes73 and scaled down appropriately. Weights were also obtained from manufacturer’s information and from food packages. Composite foods and recipes that did not have an equivalent in the food tables were broken down into their component parts and assigned weights appropriately.
The data bank used for nutrient analysis of the food records included the fifth edition of McCance and Widdowson’sThe Composition of Food,74along with its supplements.75–83 These data were used to generate average daily nutrient intakes and the amounts of various groups of food/drink consumed. Intakes from dietary supplements were not included in the nutrient calcula-tions. A measure of added-sugars (nonmilk extrinsic sugars) intake was calculated by deducting the sugars from milk, fruits, and vegetables from total sugars. Fiber was measured as nonstarch polysaccharide (NSP); this type of fiber does not include resistant starch or lignin substances, which are a part of fiber measured by other methods.
For breast milk, the duration of each feeding was used to estimate the likely volume of milk consumed. The basis of the calculation differed at each age and used validated assumptions.84,85 At 4 months, 125 g was allowed for a feeding lasting 10 minutes or longer, and a percentage of 125 g was allowed for shorter feedings (i.e., 12.5 g of breast milk/min). At 8 months, a feeding lasting
Table 3 Dietary data available in the ALSPAC recruited mothers' cohort (n=14,541a), the ALSPAC children's
cohort (n=14,062b), and the CIF substudy (n
=1,432).
Age of study child Sample Dietary method used Response rate
No. Percent
32 wks gestation ALSPAC (mothers) FFQ 12,423 85.4
4 wks ALSPAC Infant feeding questionnaire 12,353 87.8
4 mo Substudy CIF 1-day food record 964 67.3
6 mo ALSPAC Infant FFQ 11,490 81.7
8 mo Substudy CIF 3-day food record 1,131 79.0
15 mo ALSPAC Infant FFQ 11,025 78.3
18 mo Substudy CIF 3-day food record 1,026 71.6
10 minutes or longer was assumed to deliver 100 g in amount, with a proportion of this assumed if the feeding was of shorter duration (i.e., 10 g of breast milk/min).
Reference nutrient values. The calculated nutrient intakes were compared with age-specific reference values recom-mended by the UK Department of Health’s Report on Health and Social Subjects, no. 41.86Reference Nutrient Intakes have several levels: the Estimated Average Requirement is the amount of a nutrient at which about half the population will need more and half the popula-tion less than this amount; the Reference Nutrient Intake is the amount of a nutrient sufficient for 97% of the popu-lation; and the Lower Reference Nutrient Intake (LRNI) is the amount that is adequate for only around 2.5% of the population.
Anthropometric measurements
Birthweights were obtained from the medical records, and supine length was measured with a Harpenden neonatometer (Holtain Ltd, Crosswell, Dyfed, UK) soon after birth by a member of the ALSPAC study team. The infants in CIF had their weight and height measured at the research clinics at 4, 8, 12, 18, 25, 31, 37, 43, 49, and 61 months. For the whole ALSPAC cohort, body weight and length at around ages 2, 9, and 19 months were available from routinely collected measurements performed by trained health professionals as part of the infant health surveillance program and were extracted from the local child health database. Later height and weight measure-ments for the whole cohort were obtained at the research clinics at ages 7, 9, 10, 11, 12, and 13 years.At these ages, fat mass was also assessed by bioelectrical impedance using a Bodystat 1500 impedance monitor (Bodystat Ltd, Isle of Man, UK). A Lunar Prodigy dual-energy X-ray absorptiometry (DXA) scanner (GE Medical Systems, Madison, WI, USA)was used to measure body composi-tion at ages 9, 11, and 13 years and provided estimates of total fat mass, lean body mass, and bone mass. Whole-body scans were carried out with children wearing light clothing, with metal objects such as bracelets and watches removed.
From these measurements of height or length (cm) and weight (kg), ponderal indices in infancy (weight/ length3) and BMIs in childhood (weight/height2) were calculated. Body weight, height/length, and BMI at each time point were converted to standard deviation scores (SDS; sometimes known as “z scores”) by comparing values with the British 1990 growth reference,87 using gestational age or the actual age at measurement for each individual. Weight gain was assessed by calculating the difference in z scores between weight at the beginning and at the end of the period, adjusting for regression
toward the mean using correlates from the British 1990 growth reference.88 Using this increasingly preferred method,54,89 weight gain becomes “conditional” on gender, age, and initial weight, thereby providing a more accurate measure of infant growth.
Hemoglobin and ferritin values
At the 8-, 12-, and 18-month visits to CIF research clinics, a heel-prick capillary blood sample was collected. The hemoglobin concentration was assayed using the HemoCue B-Hb photometer (HemoCue Ltd, Derbyshire, UK). The blood was then centrifuged and the plasma removed and frozen. Plasma ferritin was assayed using a dissociation-enhanced lanthanide fluoroimmunoassay (DELFIA), a time-resolved fluoroimmunoassay system.
Blood pressure measurements
Blood pressure was measured at a research clinic when the children were 7.5 years of age. Systolic blood pressure and diastolic blood pressure were measured using a Dinamap 9301 Vital Signs Monitor (Morton Medical, London, UK). Using a cuff size appropriate for a child’s upper-arm circumference, two right-arm measurements were taken and the average recorded.
Girls' age at menarche
Data on whether the girls had started menstruating were collected at a clinic between February 2004 and Decem-ber 2005.62Girls were asked during a measuring session in a private room if they had started menstruating, and if so, when. In total, 3,751 girls attended the clinic. Mean age of girls who attended the clinic was 12.89 (SD, 0.23) years, ranging from 11.30 to 14.34 years. Data on whether menarche had been reached were available from 3,298 girls, of whom 1,637 (50%) stated they had not. Of the 1,661 who had reached menarche, age at first period was available for 1,550; of these, 1,328 were white girls from singleton births.
IQ and child development data
Developmental data were obtained from questionnaires mailed to parents when their children were 6 months and 18 months of age. The questionnaires contained a series of questions assessing the mental and physical develop-ment of the child (taken from the Denver Developdevelop-mental Screening Test90,91); this provided a developmental score for each child. When children were 8 years of age, their IQ was measured at a research clinic. IQ was measured using a validated age-adjusted shortened version of the Wechsler Intelligence Scale for Children.92
Maternal socioeconomic and anthropometric factors
Maternal age at delivery was calculated by subtracting the mother’s date of birth from the child’s date of birth. Infor-mation on highest maternal educational attainment was derived from a questionnaire sent out at 32 weeks’ gesta-tion. Information on all the educational qualifications of the mother was obtained, and from this a 5-point scale of highest educational attainment achieved was created, with the following categories: no academic qualifications; vocational training (hairdressing, catering, etc.); O-level academic examination, usually taken at 16 years, or equivalent; A-level academic examination, usually taken at 18 years, or equivalent; and university degree. In some analyses, these were contracted to three categories: no academic qualification, or vocational training only; O-level qualification; and A-level or degree qualification. Information on maternal smoking status was assessed by questionnaires sent during pregnancy and infancy. Housing tenure data were also collected during preg-nancy (types of housing: owned or mortgaged housing; rented council housing; privately rented housing). Data on financial difficulties, including difficulty affording food, were derived from questionnaires completed during pregnancy and during infancy of the child. Mothers were asked to report their prepregnancy weight and height by questionnaire during pregnancy; these values were used to calculate maternal prepregnancy BMI. The mother’s partner was also asked to report his or her height and weight by questionnaire.
Comparison of nationally representative dietary studies
Several nationwide surveys of diet in infants and very young children are available and have been quoted in comparison with ALSPAC data in this review. The IFS, carried out every 5 years, has comparable questionnaire data from 1990 to 2010 on breastfeeding and complemen-tary foods.21–23,93The Food and Nutrient Intakes of British Infants Aged 6–12 months84collected food records from nationally representative infants aged 6–9 months (n= 258) and 9–12 months (n=230) in 1985–1986, fairly close to the time of the infancy of ALSPAC children. This study helped to inform the methods used in dietary assessment in ALSPAC and provided comparable nutrient and food group information. A new national survey was published in 2013, the Diet and Nutrition Survey of Infants and Young Children (DNSIYC 2011)94; it collected 4-day weighed food records, as well as blood samples and anthropometric measures, cross-sectionally from 329 4-to 6-month-olds, 630 7- 4-to 9-month-olds, 449 10- 4-to 11-month-olds, and 1,274 12- to 18-month-olds from January to August in 2011.It has been used in this review to
assess the likely relevance of ALSPAC results to infant feeding practices in 2011. The DNSIYC used the same method as ALSPAC to estimate breast milk intake from the duration of each breastfeeding. For 90 mother-child pairs, the DNSIYC was able to use a stable isotope method to measure breast milk intake for comparison with the diary estimates.94The agreement between the two methods was considered moderate (r=0.599), with the diary method found to be reasonably reliable for estimating breast milk intake in the field.
Statistical methods
Since this review features a host of papers, it is not prac-tical to list all the statisprac-tical methods used in individual papers. Descriptive statistics were provided within most papers. Confidence intervals (CIs) are shown at the 95% level in all cases. Tests for associations between variables were performed using various statistical tests, paired t
tests, analysis of variance, andχ2test. Regression analyses were carried out after adjustment for major confounders, depending on the outcome of interest, and were described in the text for each study. The main confound-ing variables used in the various analyses were the indi-cators of socioeconomic background listed in Table 2.
RESULTS
Diet and feeding practices in early infancy
Infant milk-feeding practices were assessed by question-naire at 6 months (n=10,474). Exclusive breastfeeding (defined as breast milk with no other food or drink except water) was carried out by 55% of the cohort in the first month, 44% in the second month, and 31% in the third month, with a further 24% feeding breast milk in combi-nation with other foods/drinks at 3 months of age.24By the sixth month, only 36% of the infants were receiving any breast milk, always along with other foods. Infant formula was used from birth in 22% of infants, with this percentage gradually increasing to 63% in the sixth month.24These findings were similar to results from the IFS carried out in the early 1990s, when the prevalence of breastfeeding at 6 weeks was 44% and at 6 months was 22%.22These data are still comparable with more recent data from the IFS 2010, in which the prevalence of breastfeeding at 6 weeks was 55% and at 6 months was 34%.21
of breastfeeding, timing of solids introduction, feeding on demand, and various recommendations about the types of foods and drinks to introduce) compiled from inter-national sources.25The score comprised 14 components (the main ones are covered in this paragraph) and was developed to assess the degree of adherence to comple-mentary feeding guidelines. The difference between the lowest (furthest from the guidelines) and the highest (closest to the guidelines) quintiles, derived from guidelines-adherence scores, for ALSPAC infants was most marked in breastfeeding duration (an average of 1 month vs. 8 months, respectively;P<0.001), feeding on demand (22% vs. 56%;P<0.001), age at introduction of cow’s milk (9 months vs. 12 months;P<0.001), number of portions of vegetables (1.0 vs. 1.7 per day;P<0.001), fruit (0.7 vs 1.1 per day;P<0.001), and servings of com-mercial infant food (14 vs 8 per week). Better adherence to the guidelines was more likely with higher maternal age (P < 0.001) and higher maternal education (P < 0.001). Mothers who were overweight before pregnancy were less likely to follow the guidelines than those with a healthy weight (P<0.001) before pregnancy. In longitu-dinal analysis (n=4,326), better adherence to the guide-lines – adjusted for socioeconomic background – was independently associated with increasing scores on a “health-conscious” dietary pattern (β = 0.18; CI: 0.14, 0.21) and with decreasing scores on a “processed” dietary pattern (β = −0.16; CI:−20,−0.13) derived from the child FFQ at age 7 years by principal components analysis.26 These results suggest that a good dietary foundation may set the trend for later healthy eating patterns.
The drinks offered to infants, including breast milk, were investigated in detail at 4 months, using the diet diaries in the CIF subsample (n=993).27,28The strongest determinant of breastfeeding was maternal education: a quarter of the lowest education group (no qualifications), half of the moderately high group (those with academic qualifications at 18 years), and three-quarters of the highest group (those with degrees) were still breastfeeding at 4 months. Similarly, in IFS 2010, breastfeeding at 4 months was highest among mothers who left full-time education after 18 years of age (56%) compared with those who left at or before16 years of age (22%).21In CIF, the age of the mother was also strongly independently related to breastfeeding, with older mothers much more likely to breastfeed (54% in mothers≥30 years vs. 21% in mothers ≤25 years).27Again in IFS 2010, breastfeeding rates at 4 months were lowest among mothers under the age of 20 (15%) and highest among mothers aged 30 and over (53%).21Apart from breast and formula milk, fruit drinks were fed to 24% and herbal drinks to 15% in CIF.28Fruit drinks were any fruit-flavored drinks,including fruit juice, dilutable drinks,and drinks marketed for infant consump-tion. Herbal baby drinks were flavored drinks containing
herbs like camomile and fennel that were strongly mar-keted for infant consumption at that time. The main asso-ciation with the feeding of fruit drinks at 4 months was the absence of older siblings in the family (P<0.0001), with maternal education much less important (P<0.05).Herbal drinks were more likely to be fed by younger mothers and those who had never breastfed (P<0.0001).27There was some evidence that the volume of milk drunk,either breast or formula, was slightly lower if other drinks were also given (around 70 g to 114 g less), which implies a slightly lower nutrient intake in these groups because these other drinks have very little nutritive value.28
Further evidence of social inequality in infant feeding practices came from the diet diary at 4 months (n=933),29the age at which the introduction of comple-mentary foods was recommended at that time.19,20 Marked differences were found between formula-fed and breastfed infants in the age at introduction to foods/ drinks and in the types of foods used.29 Formula-fed infants were more likely to be eating complementary solids (93%), particularly commercial infant foods, but there was no difference in milk volume between formula drinkers fed solids and those not fed solids. Around 80% of breastfed infants were receiving complementary solids, and those that were tended to consume slightly less milk than those totally breastfed. However, the average weight of breastfed infants who received solids was similar to that of exclusively breastfed infants at 4 months and was comparable to that of formula drinkers.29The overall nutrient intake of solids-eating breastfed infants did not appear to be compromised by the intake of solid foods, although it is possible that lower amounts of these nutrients were absorbed.29
A further analysis related recorded diet at 4 months to growth up to 5 years of age (n=881 full-term single-tons). Formula-fed and mixed-fed (breast and formula) infants were assessed separately from breastfed infants.30 In the formula/mixed-fed but not the breastfed group, there was evidence that those introduced to complemen-tary solids before 3 months of age had higher energy intakes at 4 months than those introduced later (P = 0.002). This was also true of first-born compared with later-born infants (P = 0.01). Again, in the formula/ mixed-fed group only, greater energy intake at 4 months was related to greater weight gain between birth and 1, 2 or, 3 years of age and higher mean body weight and BMI at 5 years of age (P <0.001).30These associations were not altered by controlling for maternal age or maternal education.
Diet and feeding practices in mid-infancy
Food/drink records from the CIF substudy (n= 1,131) were available again at 8 months, at which point all infants
were receiving complementary solids, with 23% still being breastfed at least once a day.31Food and nutrient intakes were very similar to those from the national survey by Mills and Tyler84and with the DNSIYC 2011,94which had exactly the same proportion of breastfed infants at 7–9 months (23%) as ALSPAC at 8 months. Nutrient intakes were adequate, with zinc and vitamin D being the nutri-ents most likely to cause concern. In Table 4, the types of foods eaten at 8 months by ALSPAC infants are compared with those eaten in six countries around the world by infants taking part in a WHO study designed to produce optimal growth data for breastfed infants on which growth charts could be reliably based.95The proportion of ALSPAC children consuming each of the food groups was within the range between 6 and 12 months shown for most of the countries and was particularly similar to con-sumption levels in Norway and the United States.95
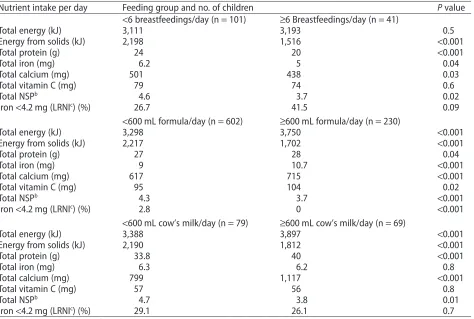
A further analysis of these diet diary data (n=928 full-term singletons) focused on differences in diet according to the type and volume of milk fed. It was found that 12.9% of mothers were feeding cow’s milk as the main drink, and many infants were fed more than 600 mL of milk (any type) per day.32The infant feeding recommendations suggest a limit of 500–600 mL per day for formula-fed infants at 6 months20; if applied to breastfed infants, this is equivalent to no more than 6 breastfeedings per day. Table 5 shows intakes of energy and selected nutrients according to the type and volume of milk fed.32 In both breastfed and cow’s-milk-fed infants, the nutrient profile was worse in those who con-sumed high volumes of milk. The breastfed infants seemed to be able to regulate their energy intake, so that those fed breast milk more than 6 times per day obtained less energy from solids, with a total energy intake similar to that of breastfed infants who received fewer feedings. This was at the expense of the other nutrients, particularly iron, which resulted in 41% having intakes of iron below the LRNI, an amount adequate for only 2.5% of the popu-lation. However, although infants fed more than 600 mL per day of either formula or cow’s milk had lower intakes of solid foods than those fed lower volumes of milk, they did not fully compensate and had higher overall energy intakes.32Furthermore, the groups who were fed cow’s milk had a poor nutrient profile, particularly if fed more than 600 mL per day: they had very low iron and vitamin C intakes and high calcium intakes, with a large propor-tion having intakes below the LRNI for iron. The analysis showed that infants fed cow’s milk were much more likely to be anemic at 12 months (27% with hemoglobin<110 g/ dL,P= 0.006) than infants fed formula (15%), and that higher calcium intake was associated with poorer iron status.32Underlining the problem with low iron intakes in breastfed infants was evidence showing they were vulner-able to anemia (27%), suggesting that increased
con-sumption of complementary foods high in bioavailable iron would be advantageous. This use of cow’s milk as a main drink before 12 months of age is an ongoing problem in the United Kingdom, as shown by the 5-yearly IFS (8% of 9-month-olds in IFS 2000, 6% in IFS 2005, and 4% in IFS 2010).13,21,93ALSPAC has the advantage of being a longitudinal study with data on many aspects of feeding, and in another analysis, mothers feeding formula to infants at 4 months were found to be twice as likely as those feeding breast milk to have switched to cow’s milk as the main drink by 8 months (17% vs. 8%, respec-tively).27The mothers who did this were more likely to have vocational education with no academic qualifica-tions at 16 years, to live in council-rented housing, to have several children, and to find it difficult to afford food.27Therefore, this particular type of adverse feeding practice is related to socioeconomic background in this population.
When dietary salt (sodium) intake in CIF children was investigated at 8 months33and compared with the recommendation for this age group, which is not more than 400 mg of sodium per day,8670% of the diets were found to exceed this maximum.33Dietary sodium content was not related to maternal education but was higher in infants introduced early to complementary foods. Fur-thermore, the use of cow’s milk as a main drink was one of the contributors to excessive sodium intake, since cow’s milk has a much higher sodium content than either breast milk or formula.76Bread and breakfast cereals were large contributors to sodium intakes. This suggests that reformulating these products to reduce their sodium content would be beneficial for infants. There was also inappropriate use of salty flavoring (given to 23% of these infants), including the use of gravy granules.33
Age at which different types and textures of food were introduced
Table 4 The percentage of infants in six countries eating each food group at 6 and 12 months of age from the WHO Multicentre Growth Reference Study Group
(1997–2003) compared with the percentage of ALSPAC infants eating each food group (assessed by food records collected at 8 months of age in 1993).a
Food group Age Percentage of children eating each food group
Brazil (n=69) Ghana (n=228) India (n=173) Norway (n=159) Oman (n=153) USA (n=121) ALSPAC, at 8 mo (n=1,178)
Grains 6 mo 24.6 88.6 86.1 79.2 85.6 73.6 90.7
12 mo 85.5 97.4 100.0 100.0 97.4 97.5
Legumes & nuts 6 mo 5.8 20.2 35.3 0.0 10.5 0.8 10.0
12 mo 43.5 38.6 87.3 3.8 15.7 33.9
Milk & dairy products 6 mo 20.3 59.2 64.2 13.2 49.7 9.1 23.4
12 mo 75.4 76.3 89.6 82.4 83.0 86.0
Flesh foods 6 mo 2.9 11.4 0.0 3.1 26.8 1.7 64.3
12 mo 50.7 81.1 6.4 66.7 77.8 59.5
Eggs 6 mo 2.9 4.4 3.5 0.0 7.8 0.0 1.0
12 mo 8.7 27.2 13.9 3.1 31.4 18.2
Vitamin-A-rich fruit & vegetablesb
6 mo – 7.5 15.0 7.5 38.6 34.7 –
12 mo – 53.9 31.8 29.6 46.4 78.5
Other fruit & vegetablesb
6 mo 73.9 11.4 52.6 23.9 39.9 34.6 85.7
12 mo 76.8 78.9 85.0 79.9 69.9 89.3
Juice 6 mo 27.5 9.2 19.7 0.6 45.1 3.3 21.6
12 mo 52.2 24.6 20.2 12.6 60.8 43.0
Sweet beverages 6 mo 23.2 1.8 1.7 6.3 4.6 0.0 20.5
12 mo 34.8 11.8 9.8 24.5 11.8 8.3
Soup 6 mo 66.7 4.4 12.1 0.0 38.6 0.0 4.3
12 mo 47.8 34.2 8.7 2.5 40.5 3.3
Fats & oils 6 mo 0.0 6.6 15.6 2.5 1.3 0.0 51.5
12 mo 0.0 72.8 45.1 64.2 2.0 10.7
aAdapted from the WHO Multicentre Growth Reference Study Group (2006).95
bIn some countries, fruit and vegetables have been divided into vitamin-A-rich and other.
Nutrition
Reviews®
and both types of fruit covered in the 7-year FFQ, whereas associations with ready-prepared versions were some-times negative, particularly for green vegetables (all reported associations P < 0.0001). There was also evi-dence of a moderating effect of frequency of feeding home-prepared vegetables at 6 months on the relation-ship between age of introduction and vegetable eating at 7 years.34 Thus, if children were introduced to home-prepared vegetables after 5.65 months of age, a high fre-quency (intake on most days) of home-prepared vegetable feeding was associated with a high intake at 7 years, but a low frequency was not. Frequency of feeding was less important when home-prepared vegetables were introduced earlier. All the analyses were adjusted for socioeconomic background, breastfeeding duration, and age of introduction to any solid foods.34
Information about when “lumps,” i.e., chewy textured foods, had first been given to the child was obtained, and infants were grouped according to whether the recom-mendation (introduction between 6 and 9 months) was followed. The initial analysis (n=9,360) assessed whether
the age at which lumps were introduced showed any rela-tionship to the types of foods fed at 15 months or to past or present feeding difficulties, as perceived by the parents.35The majority of the children (72%) were intro-duced to lumps at between 6 and 9 months of age, although 11% were introduced before 6 months (early) and 18% were introduced from 10 months onward (late). Older mothers with better education were more likely to have introduced lumps at the recommended age. Com-pared with the group who were introduced to lumps at the recommended age (i.e., the “recommended group”), the early group were fed a greater variety of family foods at both 6 months and 15 months, while fewer of the late group were given a full range of solid foods at 6 months, and they were less likely to be having family foods at 15 months.35 There was evidence that those introduced to lumps late were more difficult to feed at 15 months than they had been at 6 months; this was not the case in the other two groups. Those introduced late were almost twice as likely as the recommended group to have definite likes and dislikes at 15 months (odds ratio [OR] adjusted
Table 5 Energy and selected nutrient intake at 8 months, according to the type and volume of milk fed, the
amount of energy from complementary solid foods, and the proportion of infants with very low iron intakes.a
Nutrient intake per day Feeding group and no. of children Pvalue
<6 breastfeedings/day (n=101) ≥6 Breastfeedings/day (n=41)
Total energy (kJ) 3,111 3,193 0.5
Energy from solids (kJ) 2,198 1,516 <0.001
Total protein (g) 24 20 <0.001
Total iron (mg) 6.2 5 0.04
Total calcium (mg) 501 438 0.03
Total vitamin C (mg) 79 74 0.6
Total NSPb 4.6 3.7 0.02
Iron<4.2 mg (LRNIc
) (%) 26.7 41.5 0.09
<600 mL formula/day (n=602) ≥600 mL formula/day (n=230)
Total energy (kJ) 3,298 3,750 <0.001
Energy from solids (kJ) 2,217 1,702 <0.001
Total protein (g) 27 28 0.04
Total iron (mg) 9 10.7 <0.001
Total calcium (mg) 617 715 <0.001
Total vitamin C (mg) 95 104 0.02
Total NSPb
4.3 3.7 <0.001
Iron<4.2 mg (LRNIc) (%) 2.8 0 <0.001
<600 mL cow’s milk/day (n=79) ≥600 mL cow’s milk/day (n=69)
Total energy (kJ) 3,388 3,897 <0.001
Energy from solids (kJ) 2,190 1,812 <0.001
Total protein (g) 33.8 40 <0.001
Total iron (mg) 6.3 6.2 0.8
Total calcium (mg) 799 1,117 <0.001
Total vitamin C (mg) 57 56 0.8
Total NSPb 4.7 3.8 0.01
Iron<4.2 mg (LRNIc) (%) 29.1 26.1 0.7
Abbreviations: LRNI, Lower Reference Nutrient Intake; NSP, nonstarch polysaccharide. aReproduced with permission from Hopkins et al. (2007).32
bA measure of the fiber content of the diet.
for socioeconomic and feeding characteristics: 1.91; CI: 1.68, 2.16).35
From the FFQ data collected at 7 years, unadjusted associations suggested that the group introduced to lumps late continued to be less likely than the recom-mended group to eat many foods, particularly fruit and vegetables.36 Associations adjusted for socioeconomic background, breastfeeding duration, feeding difficulties at 6 months, and age at introduction to fruit and vegetables showed that the late group were more likely to eat less than one portion of fruit (OR: 1.33; CI: 1.14, 1.55) and vegetables per day (OR: 1.21; CI: 1.05, 1.41), while the early group was less likely to eat less than one portion (OR for low vegetable intake: 0.70; CI: 0.57, 0.85).36 Chil-dren introduced to lumps late were slightly more likely to be choosy with food at 7 years (OR adjusted: 1.16; CI: 1.05, 1.28) than those introduced at the recommended time, and those introduced early were slightly less to be choosy (OR adjusted: 0.82; CI: 0.73, 0.93).36
These findings led to ALSPAC becoming part of a European Union (EU) collaboration to examine critical periods during infancy, a partnership that aimed to for-mulate future dietary guidelines for children. This con-sortium, named HabEat, brought together cohorts of children from four countries: the United Kingdom (ALSPAC, the longest-running of the four cohorts), France, Portugal, and Greece. Data for all cohorts include detailed information about infant feeding practices, infancy and childhood diet, and cultural variation of eating patterns. These data were used in parallel analysis to investigate factors affecting fruit and vegetable eating in children.37Breastfeeding duration was longest in Por-tugal, and complementary foods were introduced earliest in the United Kingdom. Longer duration of breastfeeding was consistently associated with higher intakes of fruit and, particularly, vegetables at 2 and 4 years of age across the countries, after adjustment for equivalent social vari-ables. In the United Kingdom, these associations were present throughout childhood. In the United Kingdom and France, where maternal fruit and vegetable eating was assessed by FFQ, the association with breastfeeding remained robust to adjustment for this.37These results suggest an independent effect of breastfeeding on fruit and vegetable eating. The other cohorts, however, did not replicate the association found in the United Kingdom between late introduction of vegetables and lower intake of vegetables in childhood, although this association was present at all ages assessed by ALSPAC. This discrepancy may be due to the fact that the other cohorts did not differentiate between home-prepared and ready-prepared vegetables, shown to be a very important dis-tinction in ALSPAC.34 The HabEat consortium also conducted experimental work to assess food exposure and acceptance in infants and young children. This
showed that repeated exposure to novel vegetables without any other additions is sufficient to increase acceptance and consumption.96
Diet and feeding practices in the second year of life
When the infants were 18 months of age, in 1994, diet diaries were available for 1,026 infants in the CIF substudy. Again, intakes were adequate for most nutrients except vitamin D, zinc, and iron.38 Results were very similar to those of a British national survey of 1.5- to 4.5-year-old children carried out in 1992–1993 using weighed diet records.97In CIF, there was little evidence that food intakes had been under-reported at 18 months, as only 4.9% of infants were identified as potential under-reporters of energy intake when their intakes were com-pared with energy requirements derived from a study using double-labeled water measurements of energy expenditure in young children.98
The drinks consumed by CIF 18-month-olds were investigated further. Cow’s milk was the predominant drink, given to 94%, while only 3.5% were given any formula and 2.4% any breast milk.39Fruit-flavored drinks were very commonly used, with half of the children fed drinks labeled as either low-calorie or low-sugar and con-taining artificial sweeteners. There was a strong educa-tional bias in the use of these drinks: 61% of mothers with vocational but not academic qualifications versus 25% of mothers with degrees fed these drinks. Tea or coffee was given to 17% of the children, again with a very strong bias in maternal education (ranging from 33% of the least-educated to 7% of the most-least-educated mothers). Only 20% of mothers fed plain water as a drink, and in this case the educational bias was toward the higher-educated mothers, who did this more often, a bias that also held for the use of orange juice (fed by 19% overall) and apple juice (9%).39 The type of vessel used for drinks was recorded and, despite the recommendation that all fluids should be fed by a feeding cup by 12 months of age,20a large number of 18-month-olds were still using feeding bottles (10% exclu-sively, and 53% some of the time). Of the children of mothers in the lowest education group, one-quarter used a bottle only, half used both a bottle and a cup, and one-quarter used a cup only. Of the children of degree-educated mothers, 5% used a bottle only, 43% used both a bottle and a cup, and more than half used a cup only. The amount of milk fed was related to the type of vessel used. When a bottle was used exclusively, the average intake was 488 g/d, compared with 381 g/d when a cup was used exclusively; there was no difference in the total amounts of other drinks fed.39These data suggest that the use of a feeding bottle at 18 months may promote excess intake of cow’s milk at a time when milk intake should be gradually replaced by the consumption of a variety of foods.
The finding that diet at 18 months provided marginal amounts of iron prompted investigation of the relation-ship between diet and hemoglobin and ferritin as a measure of iron status in these children (n=796 single-tons with blood samples).40There were univariate posi-tive associations between energy-adjusted intakes of iron and vitamin C and ferritin and negative associations between intakes of calcium and NSP (fiber) and ferritin, although hemoglobin was positively associated only with vitamin C intakes. In adjusted models, calcium intake retained a strong negative association (P < 0.001) and iron intake retained a weak positive association with ferritin (P = 0.049), while vitamin C intake retained a moderately strong positive association with hemoglobin (P = 0.004). There was also evidence that hemoglobin levels were slightly higher in consumers of fruits or veg-etables than in nonconsumers (P = 0.013 and 0.044, respectively). In consumers, the amount of cow’s milk drunk was negatively associated with ferritin (P<0.001) but was not related to hemoglobin.40These findings are very similar to the findings at 8 months, thus increasing confidence in their plausibility.32
Whether nutrient and food group differences between recorded diets at 18 months were independently associated with maternal characteristics such as educa-tion, age at the birth of the child, and smoking status was investigated more closely.41Nutrient intakes were most strongly associated with maternal education: children of the least-educated mothers, when compared with chil-dren of the most-educated mothers, had lower intakes of NSP and total sugars and higher intakes of nonmilk extrinsic (added) sugars, while intakes of most key micronutrients, particularly iron, were lower. This was a reflection of the many differences in the food groups consumed: children of the least-educated mothers con-sumed “meat products,” “chocolate,” “crisps and snacks,” “white bread,” “fried potatoes,” “tea,” and “diet soft drinks” more often and “cheese,” “yogurt and fromage frais,” “wholemeal bread,” “fruit” and “fruit juice” less often than those of the most-educated mothers. Despite having a worse nutrient intake profile, these children were less likely to take vitamin supplements.41In the diet of chil-dren of the youngest mothers versus chilchil-dren of the oldest, starch intake was higher and total sugars intake lower, but there were no important associations with other nutrients. Some independent associations with food and drinks were found: children with younger mothers were more likely to consume “crisps and snacks” and “tea” and less likely to consume “buns, cakes, and puddings,” “biscuits,” “semi-skimmed milk,” and “fruit juice”.41 Chil-dren of smokers had lower intakes of NSP than those of nonsmokers, and the main differences in foods consumed were less frequent intakes of “buns, cakes and puddings,” “wholemeal bread,” and “fruit.” These associations were
very similar to those shown in the dietary patterns analy-sis performed using the Infant FFQ in the whole cohort, reported below.42
Dietary patterns in infancy
Further investigation of the questionnaires covering the feeding of the infants at 6 and 15 months was conducted by examining patterns of associations between foods eaten. Four underlying patterns were found at each age.42 There were particular foods with a high correlation with each pattern, and these were used to describe that pattern. At 6 months, the following patterns were identified: “home-prepared meat, vegetables, and desserts” (HM Traditional); “biscuits, sweets, crisps, fizzy drinks, and tea” (Discretionary); “ready-prepared baby foods” (RM Baby Foods); and “breastfeeding, raw fruit, and vegetables” (Breastfeeding). Three patterns at 15 months had very similar correlations with the same foods as at 6 months: the HM Traditional, the Discretionary, and the RM Baby Foods patterns. A fourth pattern was obtained in the 15-month-olds that had high correlations with “herbs, cheese, fish, nuts, legumes, raw fruit, and vegetables” (Contemporary). At this age, only 4% of infants were still breastfeeding, and breast milk did not contribute sub-stantially to any of the patterns.
Each child received a score on each pattern, and the level of their score was associated with maternal charac-teristics.42At both ages, high scores on the HM Tradi-tional pattern were more likely when the mother had academic qualifications at 18 years but were not indepen-dently related to maternal age. Maternal obesity before pregnancy was associated with lower scores on this pattern at 6 months but not at 15 months. The RM Baby Foods pattern was not strongly associated with maternal education at either age; this pattern was less likely at 15 months if older siblings were present in the family. The Discretionary pattern was strongly negatively related to maternal age and education at both ages: high scores were much more likely if the mother was young and had low educational attainment. Maternal obesity before preg-nancy and being in a family with older children were also associated with higher scores on this pattern.
Dietary patterns from the questionnaires were inves-tigated in relation to the nutrients derived from the diet diaries collected 2–3 months later in the CIF substudy.43 The associations pointed to several differences in nutrient profiles, suggesting that these patterns derived from foods consumed also describe variations in the nutrient com-position of the diet. In particular, at both ages, high scores on the Discretionary pattern were associated with higher intakes of sodium but lower intakes of NSP and most micronutrients and, thus, a less favorable nutrient profile. The RM Baby Foods pattern was negatively associated with sodium intake, possibly due to strict legislation in United Kingdom about the amount of sodium allowed in ready-prepared baby foods.43This pattern also had a posi-tive association with iron and vitamin C intakes at both ages, but the profile of some nutrients, such as selenium and NSP was less favorable. High scores on the HM Tra-ditional pattern at both ages were associated with higher protein intakes, but higher energy intake was associated with this pattern at 6 months only, and other relationships were also inconsistent.43 Although the Breastfeeding pattern appeared to be negatively associated with some micronutrients, this is probably because the food compo-sition tables were unable to allow for the better bioavailability of nutrients from breast milk.99The Con-temporary pattern, which was identified only at 15 months, seemed to have a relatively micronutrient-dense profile and was the only pattern strongly associated with fat intake, higher scores being associated with lower intakes of total fat, particularly saturated fat.43
Once these dietary patterns had been described,inves-tigations were conducted to determine whether there was any evidence of a relationship between the dietary patterns and IQ measured by a standardized test at 8 years of age in 7,000 of the original cohort of children.44 There were biases between those with and without data for IQ as well as for some other variables, so statistical methods for imputation of missing data and checks on validity were used to try to minimize the effects of these.At both 6 and 15 months, a 1-SDS increase in the Discretionary pattern score was associated with a decrease in full-scale IQ points: −1.15 (CI: −1.80,−0.50),P= 0.001 for the pattern at 6 months;−0.86 (CI:−1.52,−0.20),P=0.012 for the pattern at 15 months,after adjustment for the other patterns at that age and for 12 potential confounders that included sex, gestational age,maternal education,and social class; more-over,at 15 months,scores for the patterns at 6 months were included. At both ages, adjustments attenuated the effect size considerably.44Similarly, there was a negative inde-pendent association with the RM Baby Foods patterns: IQ points−0.63 (CI−1.06,−0.19),P=0.005 for the pattern at 6 months;−1.11 (CI−1.71,−0.50),P=0.001 for the pattern at 15 months. There was, however, a positive independent association of IQ with the Breastfeeding pattern at 6
months (0.97 [CI: 0.49, 1.45], P ≤ 0.001) and with the Contemporary pattern at 15 months (0.67 [CI: 0.07, 1.26],
P=0.029). The HM Traditional pattern was inconsistent in its association with IQ, being positively associated at 6 months but showing no independent association at 15 months.44
A further attempt to assess the basis for these asso-ciations was made by combining the scores on similar dietary patterns across each age, using multilevel mixed models45and including IQ measured at both 15 years and 8 years of age. Four trajectories of dietary patterns from 6 months to 2 years were developed for each child, and each trajectory was characterized by different foods and named accordingly. High scores on the “Healthy” trajec-tory were correlated with breastfeeding at 6 months, high intakes of fresh fruit and vegetables, cheese, and herbs at 15 and 24 months, and high intakes of fish and eggs at 24 months. This “Healthy” trajectory was associated with a β-coefficient on full-scale IQ points: 1.07 (CI: 0.17, 1.97),
P=0.020 at 8 years, and 0.49 (CI:−0.28, 1.26),P=0.208 at 15 years, after multiple linear regression adjusted for all major confounders and with multiple imputations of missing covariables.45 For the Discretionary trajectory, high scores were correlated with high intakes of biscuits, chocolate, and crisps at all ages, and adjusted associations with full-scale IQ were−0.35 (CI:−1.03, 0.33),P=0.307 at 8 years, and−0.73 (CI−1.33,−0.14),P=0.017 at 15 years. Foods associated with the Traditional trajectory at all ages were meat, cooked vegetables, and pudding, and again, adjusted associations with full-scale IQ were stronger at 15 years (−0.41 [CI−0.77, −0.04],P = 0.031) than at 8 years (−0.19 [CI:−0.71, 0.33],P=0.466). There was some evidence of a “Ready-to-eat” trajectory, high scores being associated with eating more ready-prepared baby foods at 6 and 15 months and more biscuits, bread, and breakfast cereals at 24 months. This trajectory, however, was not associated with IQ at either age.45
During infancy, the diet of necessity changes rapidly from a milk-based to a family-food-based diet; therefore, using these same data, the transition of the diet was exam-ined longitudinally, in a subtly different way, by putting the information about foods consumed at 6, 15, and 24 months simultaneously into a principal components analysis.46Two types of transition diet were used to sum-marize the variations in all the foods consumed at each age over this period. The first, the Healthy Transition Diet, is characterized by breastfeeding at 6 months and home-prepared meat, fish, cheese, vegetables, fruit puddings, and raw fruit and vegetables at all ages. The second, the Less-Healthy Transition Diet, is characterized by formula at 6 months and home-prepared meat and potatoes, baked beans, biscuits, crisps, confectionary, soft drinks, and tea at later ages. Each child received a score on both transition diets. Higher maternal age and education were
strongly independently related to higher scores on the Healthy Transition Diet, but there was no relationship to maternal prepregnancy BMI, smoking in pregnancy, or number of older siblings.46 Of these predictors, only maternal smoking was not related to the Less-Healthy Transition Diet: higher scores were associated with younger maternal age, higher prepregnancy BMI, lower maternal education attainment, and more siblings in the family. This analysis was limited to the 2,169 participants with complete dietary data, so the group studied were biased toward older mothers with a higher education level who were less likely to have smoked in pregnancy.46 The possible relationship between these two transi-tion diets and later blood pressure (BP) in these children has been investigated.47Previously, it was shown that BP at 7 years (n= 4,763) is related to breastfeeding. BP of children who were breastfed was lower on average than that of children never breastfed,−0.7 mm Hg (CI:−1.4, −0.02) systolic BP and−0.4 mm Hg (CI:−1.1,−0.04) dia-stolic BP. This difference remained after adjustment for child and maternal factors, including child BMI at age 7 years.48 Furthermore, in the CIF substudy with diet records, sodium intake at 4 months (n=533) but not 8 months (n=710) was shown to be positively associated with systolic BP at age 7 years,49although this was partly attenuated when breastfeeding was added to the model. In the transition diet analysis, after controlling for breastfeeding duration as well as for sex, birthweight, maternal education, and smoking in pregnancy, there was no relationship with the Healthy Transition Diet, but a positive relationship with the Less-Healthy Transition Diet remained47: for every 1-SDS increase in the diet score, there was a 0.62 mm Hg (CI: 0.00, 1.24) increase in systolic BP and a 0.55 mm Hg (CI: 0.10, 1.00) increase in diastolic BP. Further adjustment for body size at age 7 years attenuated the relationship with systolic BP, but that with diastolic BP persisted. However, these associations with dietary pattern trajectories and transition diets may be due to residual confounding (see below).
Breastfeeding and later outcomes
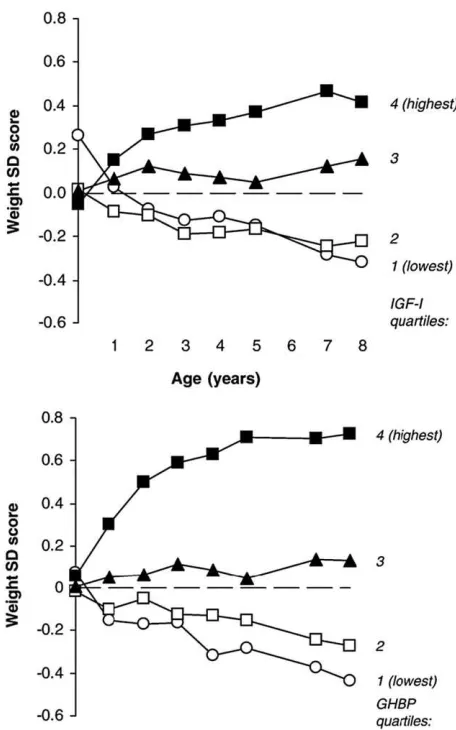
Breastfeeding was shown to be related to several later outcomes, but because breastfeeding initiation and dura-tion are highly socially biased in this populadura-tion, there is a strong possibility that these associations are due to residual confounding. Some work has been carried out to test this possibility.ALSPAC data contributed to a system-atic review that assessed the effect of any breastfeeding on mean BMI in 36 published and unpublished studies, mostly from developed countries.50Unpublished studies were included to try to address publication bias, which tends toward null findings not being published. There was a slightly lower mean BMI in childhood and
adult-hood among breastfed compared with formula-fed sub-jects, but this was strongly influenced by factors such as maternal BMI, smoking in pregnancy, and socioeco-nomic background. In the 11 studies in which full adjust-ment was possible, the association of breastfeeding with BMI was abolished. A comparative analysis between data from ALSPAC and Pelotas, Brazil, a middle-income country where the relationship between breastfeeding and socioeconomic background is very different from that in the United Kingdom, was able to assess whether associations seen between breastfeeding and BMI, BP, and IQ in ALSPAC were likely to have been due to residual confounding.51This analysis found that breastfeeding was associated with lower BP and BMI and with higher IQ in ALSPAC, even in models adjusting for socioeconomic background. In Pelotas, however, breastfeeding was unre-lated to socioeconomic background, and there were no strong associations with BP or BMI. In contrast, a strong positive association of breastfeeding with IQ was present. It is likely, therefore, that the only robust relationship here is between breastfeeding and IQ.