CHANGING ETHNIC DIVERSITY IN PENINSULAR MALAYSIA
Hans-Dieter Evers
Institute of Asian Studies, Universiti Brunei Darussalam, Gadong BE 1400, Brunei Darussalam
Email: hdevers@uni-bonn.de
This paper reviews several approaches for measuring and evaluating ethnic diversity. Based on Simpson's diversity index, a metric commonly used in biodiversity research, an "ethnic diversity index" (EDI) is developed that describes the degree of variety of ethnic groups living together on a common territory. The EDI values of the states of Peninsular Malaysia and Kuala Lumpur reveal a general decrease in ethnic diversity between 1970 and 2000. This change is attributed to migration, government policy and urban planning. Ashby's "Law of Requisite Variety" and Ostrom's recommendation for the governance of biodiversity are used to address problems associated with the governance of complex and highly diverse social systems.
Keywords: cohesion, ethnic diversity, ethnic conflict, ethnoscape, Malaysia, pluralism, urban development
ETHNIC DIVERSITY THEORY
governance, as the management of complex systems requires additional social mechanisms of control and guidance, resource allocation and conflict mediation. Similar theoretical arguments have also been made in the realm of ecological study. Nevertheless, the terminology has not been adapted to serve both the biological and social systems, despite Durkheim's observation a century ago that "the social realm is a natural realm which differs from the others only by a far greater complexity" (Durkheim, 1965 [1912]: 31).
Geographers have recently voiced similar concerns: "Understanding geographical systems represents one of the greatest challenges of our time. Complexity has emerged as a useful paradigm to effectively study linked human, socioeconomic and biophysical systems at a variety of different spatial and temporal scales" (GIS and Agent-Based Modeling, 2009; Evers, Genschick, Schraven, 2010; Evers, Gerke, Menkhoff, 2010).
Our discussion will now turn to the concept of ethnic diversity. Ethnic diversity, or "ethno-diversity" as it is sometimes called, describes the degree of variety of ethnic groups living together on a common territory. Precisely what constitutes an ethnic group and what binds it together has been thoroughly investigated in the social science literature (e.g., Barth's classical study from 1969). Ethnic groups may live together in a "plural society" or form cultural enclaves, or "diasporas," within a host society. Issues pertaining to ethnic diversity, formerly the domain of social anthropologists, are also frequently taken up by the mass media and politicians and imbued with a normative element. Moreover, these issues are often viewed as a burden or challenge, rather than a boon, especially in the context of nation-building efforts.
ETHNIC DIVERSITY AS A VALUE AND RESOURCE
Since the concept of ethnic diversity entered the public domain, the valuation of it and the reality behind it have changed considerably. With globalisation, cultural identity and ethnic identity have increased in importance. As Abdul Rahman Embong recently asserted, "cultural identity is at the essence of contemporary imagination just as much as globalisation and its consequences" (Abdul Rahman, 2011: 20). A comparison with the debate on biodiversity is instructive. NGOs have advocated on both issues, but by and large, high biodiversity is seen as important for sustaining life on the planet, while ethnic diversity is mostly seen as detrimental to social harmony and political stability.
standards as other groups. The intended outcomes are that economic and ethnic differences will be reduced, gaps will be closed, and diversity will be diminished. Political leaders generally stress unity (or, as in Indonesia and Malaysia, "unity in diversity"; "Perpaduan dalam Kebelbagaian" in Malay and "Bhinneka Tunggal Ikha" in Indonesian). The "Satu Malaysia – One Malaysia" policy of the
Malaysian government stresses the unity of the nation and conveys the message that "we are all Malaysians," rather than Malays, Chinese, Indians and others. Although this position is debated and disputed, ethnic diversity is still largely perceived as a cause of conflict, disorder and trouble, requiring government intervention and regulation.
It is perhaps significant that even the 2000 UNESCO culture report is titled "Cultural diversity, conflict and pluralism," clearly placing diversity and pluralism side by side with conflict. One particular field that thrives on conflict and conflict studies is political science. As Shamsul (2010: 2) has noted, "The construction of academic and popular analyses on plural societies has privileged the 'conflict approach'...A heavy emphasis has been given to the working of problematic. "Ethnic diversity is widely held to make governance more difficult. Such diversity is associated with low production of public goods; poor economic growth; and high levels of corruption, violence, and civil conflict" (Baldwin and Huber, 2010: 644). In a comparative study of 160 nations, Fearon (2003) poses a related question, but does not arrive at a conclusive answer. Malaysia has a fractionalisation index of 0.596 (similar to our ethnic diversity index discussed below) and ranks third in Asia. Such a high index value and ranking are predicted to correspond with ethnic violence, civil war and a highly fractionalised political party system. Sri Lanka, in contrast, has a much lower fractionalisation index of 0.428, which places the conflict-ridden country well below Malaysia at the 10th position on the index rank, corresponding to a lesser degree of conflict and violence. These inconsistencies contradict the hypothesis that ethnic diversity is an indicator of conflict and violence.
lacking. The business studies literature is even more firm in stressing the positive aspects of diversity, referring to it as "workforce diversity" in terms of ethnicity, gender and age. In management theory, in contrast to politics, the valuation of diversity has taken a positive turn. For instance, "diversity management" emphasises the business advantage of diversity (Harvey and Allard, 2012), with ethnically diverse teams deliberately created to increase innovation and improve output.
A recent survey of the European Commission on the costs and benefits of diversity in 200 companies asserts that "companies that implement workforce diversity policies identify important benefits that strengthen long-term competitiveness and, in certain instances, also produce short and medium-term improvements in performance" (Centre for Strategy and Evaluation Services, 2003: 3). A study by the Brookings Institute revealed that diversity (measured by a combined diversity index, or CDI) "strongly predicts high-tech growth" in the US (Florida and Gates, 2001: 6). Specifically, a ranking of American high technology regions correlates highly with a ranking of regional ethnic diversity. This rather crude rank order correlation is nevertheless supported by case studies of high tech companies that indicate that high diversity is indeed profitable.
Considering another perspective, foreign-born students and researchers have been involved in the majority of patents awarded to the top research universities in the US. A recent study of 1,500 patents awarded in 2011 to the 10 most productive American universities found that 76% of the patents had a foreign-born inventor. "Foreign-born inventors played especially large roles in cutting-edge fields like semiconductor device manufacturing (87%), information technology (84%), pulse or digital communications (83%), pharmaceutical drugs or drug compounds (79%), and optics (77%). The almost 1,500 patents awarded to these universities boasted inventors from 88 different countries" (Partnership for a New American Economy, 2012: 1). Similar studies for Southeast Asian economies are not yet available, but we hypothesise that the results would be similar.
MEASURING DIVERSITY
(
1)
Economists have used a similar fractionalisation index that captures "the probability that two individuals randomly drawn from the population belong to different groups, and reaches a theoretical maximum of 1 when every individual belongs to a different group" (Alesina and La Ferrara, 2003: 27). The Simpson diversity index can be applied to show how the ethnic composition of a nation or district has changed or how different areas compare in terms of the distribution of ethnic groups.
The Institute of Ethnic Studies (KITA), Universiti Kebangsaan Malaysia (UKM) is involved in the development of a Malaysian Ethnic Relations Monitoring System (MESRA) for tracking changes in the ethnic composition of the Malaysian population, its livelihood and its political behaviour. Within this framework, an "ethnic diversity index" that takes its cue from biodiversity research and related fields has been developed (Evers, Anis and Shamsul, 2010). This index will enable policy administrators and civil society organisations to track long-term social change and pinpoint, in combination with other data and indicators, possible fields for policy interventions.
The advantage of the ethnic diversity index (EDI) lies in the fact that large datasets are standardised and can therefore be compared and correlated with other variables. For instance, we may pose the hypothesis that the conflict potential of certain areas is not only related to the incidence of poverty or the dominance of a particular ethnic group but also to the degree of ethnic diversity. The hypothesis that areas of high ethnic diversity are less prone to ethnic violence than areas of low ethnic diversity should be empirically tested using large datasets. The EDI therefore serves as both an analytical and a planning tool.
The US Census Bureau recently applied the Simpson diversity index to measure ethnic diversity by county. The overall US diversity index is 0.49. Areas of high diversity are found in southern parts of the US because persons of Latino origin are counted as a separate ethnic group.
I will now turn to our recent field data and analyse some trends in the changing ethnic landscape of Southeast Asia and Peninsular Malaysia in particular.1
ETHNICITY: A SOUTHEAST ASIAN DILEMMA
periods in Southeast Asia, colonial governments used the reduction of cultural complexity within their colonies as a strategy of governance. The British in Malaya, for example, classified the native population into constructed categories of Malay, Chinese, Indians and others, although the ethnic diversity was and continues to be much more complex (King, 2008: 135; Holst, 2012). In this tradition, modern Singapore provides an example of the management of cultural diversity for the sake of effective government. The system of categorising ethnicity was adopted from the British to standardise the complex ethnic and religious diversity. Thus, the Singaporean government has managed to model ethnicity through government regulation to encourage people to act, dress and speak according to predefined categories to enable a conflict-free and functional government system. From a governance point of view, ethnicity has been streamlined and put into a straight jacket of four distinct categories. This, of course, does not preclude that ethnic distinctions are more prolific in reality and everyday life.
Brunei, a British colony until 1984, has emphasised its Malay Muslim cultural heritage and created a state ideology of "Melayu Islam Beraja" while more or less ignoring other ethnic groups in a form of "benign neglect." The existence of other indigenous as well as migrant ethnic groups is recognised, but conversion to Islam and integration into Malay society is actively encouraged. The value of diversity is not officially recognised.
Indonesia is another example of the creation of a unitary national state in the face of extreme cultural diversity. With more than 100 large ethnic groups living in the Indonesian archipelago, diversity cannot be ignored, but the state has nevertheless managed to create a unifying model under the national motto of "Unity in Diversity." Each province has a different set of items to symbolise diversity, but the set itself represents a standardised mode for modelling diversity.
Indonesia, Thailand, Brunei, Malaysia and Singapore have each developed distinct forms of governing with respect to ethnic diversity. The large number of ethnic groups has been categorised into several standardised ethnic groupings to reduce the complexity to manageable proportions. All these countries experienced ethnic violence in the past, but looking at Malaysia first, the country "...had since been in a state of 'stable tension'...dominated by many contradictions, but we have managed to solve most of them through a process of consensus seeking negotiations..." (Shamsul, 2008: 3). Inward migration, both legal and illegal, is still substantial and requires a constant process of integration or assimilation into Malaysian society (Gerke and Meinert, 2008).
Shamsul, "what many have failed to realize is that all the predictions of the prophet of dooms have not come true. Instead, since the major ethnic riot in May 13th 1969, there has been consistent long peaceful period, punctuated once or twice by ethnic skirmishes. Instead, all the riots and conflict have been happening in the north of peninsular Malaysia, in the once famous 'peaceful' Thailand" (Shamsul, 2008).
THE ETHNOSCAPE OF MALAYSIA
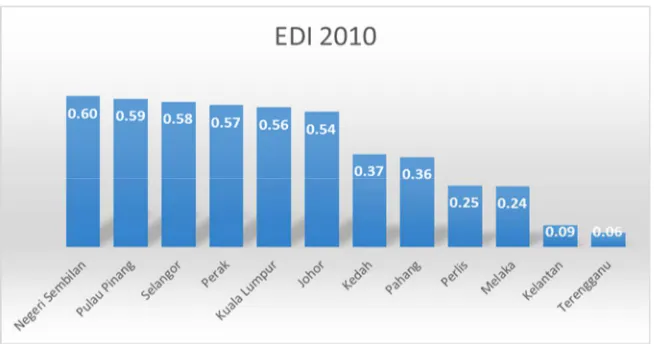
Ethnic diversity creates distinct, but constantly shifting "ethnoscapes" of ethnic groups distributed across the geographical space of nations (Appadurai, 2010). Measured by our recently developed Simpson index of ethnic diversity, Malaysian states differ greatly in terms of ethnic diversity, even when only the broad categories of Malays, Chinese, Indian and others are used (see Figure 1 and Table 1).
Figure 1: Ethnic diversity index, West Malaysian States, 2010
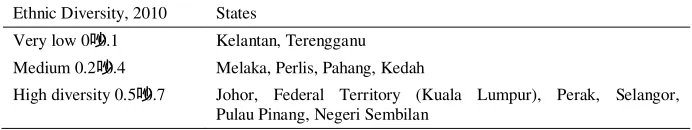
The index shows that Malaysian states can be grouped into three categories.
Table 1: Ethnic Diversity Index, West Malaysian States, 2010
Ethnic Diversity, 2010 States
Very low 0‒0.1 Kelantan, Terengganu Medium 0.2‒0.4 Melaka, Perlis, Pahang, Kedah
High diversity 0.5‒0.7 Johor, Federal Territory (Kuala Lumpur), Perak, Selangor, Pulau Pinang, Negeri Sembilan
Source: Department of Statistics Malaysia (2012) and our own calculations
More interesting than the distribution of ethnic groups at any particular time are the dynamics of ethnic diversity. As the ethnic diversity of Sabah and Sarawak is quite different from that of Peninsular Malaysia and therefore difficult to compare, we have focussed our analysis on the Peninsular states and on Kuala Lumpur in particular.
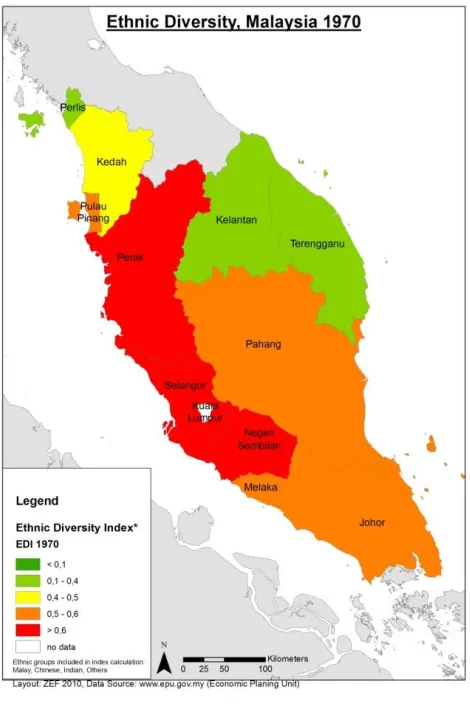
The following maps (Figures 2 and 3) show the changing ethnoscape of the West Malaysian states. These maps can be partly explained in terms of the population distribution in these states, as the degree of urbanisation is highly correlated with ethnic diversity. Another important factor is exposure to international trade and migration. The status of the Straits of Malacca as a conduit of shipping and trade has impacted the high ethnic diversity along its shores (Evers and Gerke, 2008). For centuries, long distance trade has brought migrants to the western states along the Straits and thus increased the mix of ethnic groups.
The ethnic diversity index of the Peninsular Malaysian States correlates positively with economic performance (r = 0.665 for EDI in 2010 and economic growth from 2000 to 2010), but the sheer number of factors that contribute to economic growth preclude any robust conclusions.
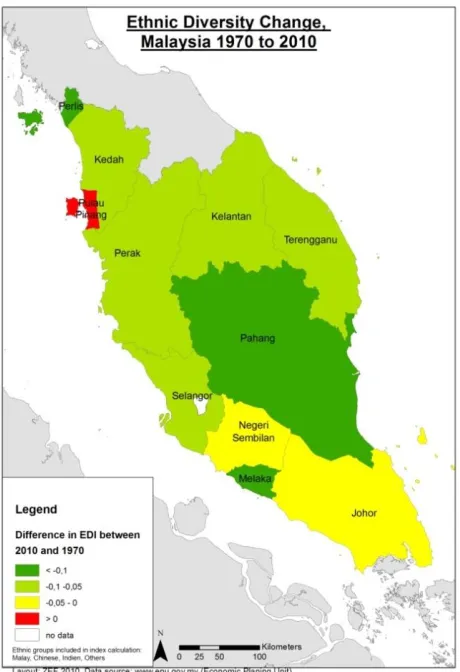
More interesting, however, is the change in ethnic diversity over time between 1970 and 2010. Increased ethnic diversity was observed in only one state (Pulau Pinang), in contrast to all the other states, particularly Perlis and Pahang, where ethnic diversity decreased (Evers, 2012).
Figure 2:Ethnic diversity in 1970
Figure 3:Change in ethnic diversity index between 1970 and 2010
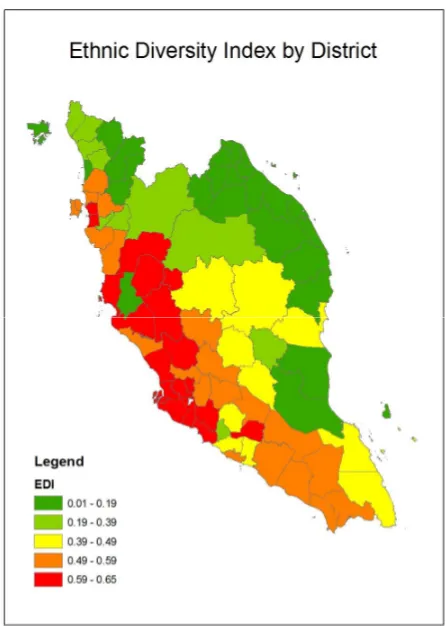
Figure 4: Ethnic diversity index, Peninsular Malaysia, 2000 (District Level)
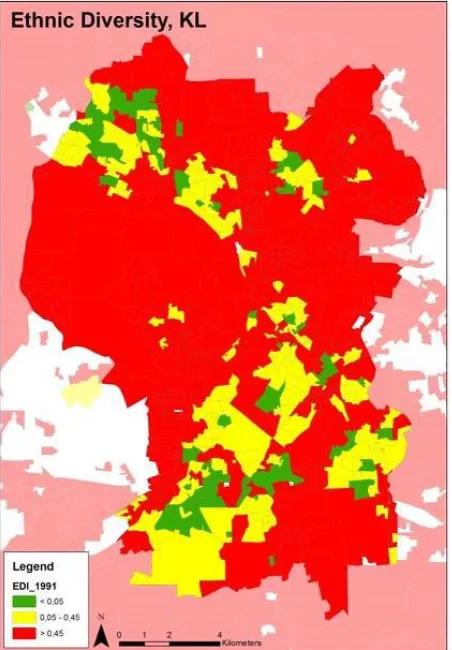
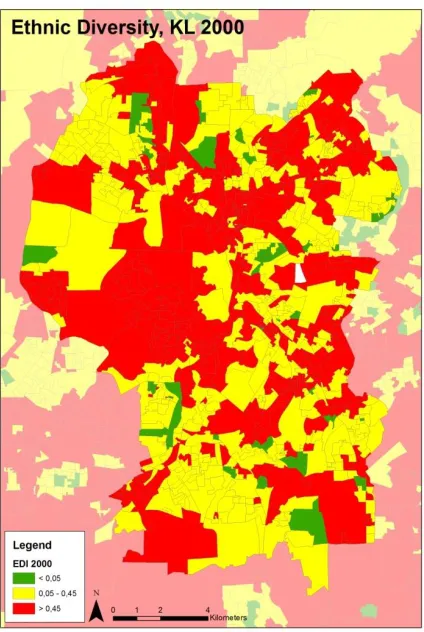
Down-scaling the diversity index to census block levels produces an even clearer picture of the development of ethnic diversity. The following maps (Figure 5 and 6) show the change in ethnic diversity within the Federal Territory, which encompasses the city of Kuala Lumpur, Malaysia's major urban area. If the census data are correct, ethnic diversity has declined, and living areas have become more segregated. This preliminary result requires further confirmation and analysis.
Figure 5:Ethnic diversity index for Kuala Lumpur, 1991
Figure 6: Ethnic diversity index for Kuala Lumpur, 2000
Data source: Department of Statistics Malaysia (n.d.) and our own calculations
We can only hypothesise that government policies have had a decisive impact on the level of ethnic diversity. Creating cost housing estates for low-income groups as well as high-cost gated communities may have segregated the population along ethnic lines. Another possibility is that large-scale diasporas of migrant workers have formed, replacing the mixed Malaysian population (Sultana, 2008 on the large Bangladeshi diaspora in Kuala Lumpur; Evers, 2012).
CONCLUSIONS
regulating" (Ashby, 1960). Ashby and Ostrom make similar recommendations in terms of the governance of biodiversity: "complex resource systems and biodiversity can successfully be maintained by complex, polycentric, multi-layered governance systems which have a variety of response mechanisms" (Ostrom, 1998). Accordingly, a highly centralised system of government is not suitable for the successful management of populations with a high degree of ethnic diversity.
The uses of the diversity index have not been fully explored in the present paper. A Pandora's box has been opened, and many questions still need to be addressed with further research, political analysis and policy advice. The analysis of ethnic diversity rests on the assumption that "ethnic diversity" is a variable in its own right. It treats all ethnic groups as equal, irrespective of their cultural, social and economic status. As an independent variable, ethnic diversity may be correlated with other socio-economic data and enable the researcher to investigate the relationship between ethnic diversity and development. We assume that ethnic diversity will have a positive impact on innovation, social mobility and economic development provided a suitable system of governance is in place. Though several studies have been conducted in Europe (Alesina and La Ferrara, 2005; Lee and Nathan, 2010) and the US (Florida and Gates, 2001; Herring, 2010; Montalvo and Reynal-Querol, 2005), this assumption requires further testing and analysis with empirical data before any robust conclusions can be drawn.
NOTES
1. This analysis was prepared with considerable input from Shamsul A. B. and Anis
Y. Yusoff of the Institute of Ethnic Studies (KITA), Universiti Kebangsaan Malaysia, whose contribution is gratefully acknowledged. The author is, however, solely responsible for errors and omissions.
REFERENCES
Abdul Rahman Embong. 2011. The question of culture, identity and globalisation: An unending debate. In Community, identity, politics and healthcare in Malaysia, eds. Abdul Rahman Embong and Chin Yee Whah, special issue, Kajian Malaysia 29(Supp.1): 11‒22.
Alesina, A. and E. La Ferrara. 2005. Ethnic diversity and economic performance.
Journal of Economic Literature 43(3): 762‒800.
______. 2003. Ethnic diversity and economic performance. Harvard Institute of Economic Research. Disscussion paper (2028).
Ashby, W. R. 1960. Design for a brain: The origin for adaptive behavior. New York: John Wiley.
Barth, F., ed. 1969. Ethnic groups and boundaries: The social organisation of cultural difference. London: Allen and Unwin.
Baldwin, K. and J. D. Huber. 2010. Economic versus cultural differences: Forms of ethnic diversity and public goods provision. American Political Science Review 104(4): 644‒662.
Centre for Strategy and Evaluation Services. 2003. The costs and benefits of diversity. A study on methods and indicators to measure the cost-effectiveness of diversity policies in enterprises. Brussels: European Commission, Directorate-General for Employment, Industrial Relations and Social Affairs.
Department of Statistics Malaysia. 2012. Statistics yearbook Malaysia 2012. Kuala Lumpur: Department of Statistics Malaysia.
______. n.d. Unpublished census data 2010.
Durkheim, E. 1965[1912]. The elementary forms of religious life. New York: Free Press.
Economic Planning Unit. 2001. The third outline perspective plan 2001‒2010. Putrajaya, Malaysia: Economic Planning Unit, Prime Minister's Department.
Evers, H.-D. 2012. The value of diversity. Penang Monthly 7(12): 30‒33.
Evers, H.-D., S. Genschick and B. Schraven. 2010. Constructing epistemic landscapes: Methods of GIS-based mapping. The IUP Journal of Knowledge Management (July): 1‒17.
Evers, H.-D., S. Gerke and T. Menkhoff. 2010. Knowledge clusters and knowledge hubs: Designing epistemic landscapes for development.
Journal of Knowledge Management 14(5): 678‒689.
Evers, H.-D., Anis Yusoff and A. B. Shamsul. 2010. Ethno-diversity and bio-diversity-methods and measurement. Unpublished paperKITA-UKM. Evers, H.-D. and S. Gerke. 2008. The strategic importance of the Straits of
Malacca for world trade and development. In The Straits of Malacca: Knowledge and diversity. ZEF Development Studies Vol. 8, eds. S. Gerke, H. D. Evers and A.-K. Hornidge, 7‒22. Berlin, London, Penang: LIT Verlag/Straits G. T.
Fearon, J. D. 2003. Ethnic and cultural diversity by country. Journal of Economic Growth 8(2): 195‒222.
Florida, R. and G. Gates. 2001. Technology and tolerance: The importance of diversity to high-technology growth (Survey series). Washington, D.C.: The Brookings Institute.
Gerke, S. and S. Meinert. 2008. Cultural diversity at the Straits of Malacca: A study of Associations of Georgetown, Penang. In The Straits of Malacca: Knowledge and diversity. ZEF Development Studies Vol. 8, eds. S. Gerke, H.-D. Evers and A.-K. Hornidge, 153‒188. Berlin, London, Penang: LIT Verlag/Straits G. T.
GIS and Agent-Based Modeling. 2009. AAG special session: Modeling geographic complexity. http://gisagents.blogspot.com/2009/09/aag-special-session-modeling-geographic.html (accessed date 22 September 2009).
Harvey, C. P. and M. J. Allard. 2012. Understanding and managing diversity. 5th ed. New Jersey: Pearson Education.
Herring, C. 2010. Does diversity pay? Race, gender, and the business case for diversity. American Sociological Review 42(2): 208‒224.
Holst, F. 2012. Ethnicization and identity construction in Malaysia. Oxford: Routledge.
Holtug, N. and A. Mason. 2010. Introduction: Immigration, diversity and social cohesion. Ethnicities 10: 407‒413.
King, V. T. 2008. Sociology of Southeast Asia: Transformations in a developing region. Copenhagen and Honolulu: NIAS Press/University of Hawai'i Press.
Lee, N. and M. Nathan. 2010. Knowledge workers, cultural diversity and innovation: Evidence from London. Int. J. Knowledge-Based Development 1(1/2): 53‒78.
Lipietz, A. 1992. Towards a new economic order. Oxford: Oxford University Press.
Luhmann, N. 1984. Soziale systeme. Grundriss einer allgemeinen Theorie. Frankfurt am Main: Suhrkamp.
McGrady-Steed, J., P. M. Harris and P. J. Morin. 1997. Biodiversity regulates ecosystem predictability. Nature 390: 162‒165.
Menkhoff, T., H.-D. Evers and Y. W. Chay, eds. 2010. Governing and managing knowledge in Asia. 2nd revised edition. New Jersey, Singapore and London: World Scientific Publishing.
Montalvo, J. G. and M. Reynal-Querol. 2005. Ethnic diversity and economic development. Journal of Development Economics 76: 293‒323.
Ostrom, E. 1998. Scales, polycentricity, and incentives: Designing complexity to govern complexity. In Protection of global biodiversity: Converging strategies, eds. L. D. Guruswamy and J. A. McNeely, 149‒167. Durham, NC: Duke University Press.
Shamsul Amri Baharuddin. 2010. From conflict to cohesion: The paradigmatic challenge in analyzing plural societies in Southeast Asia, Malaysia as a case study. Unpublished conference paper.
______. 2008. Many ethnicities, many cultures, one nation. The Malaysian experience. UKM ethnic studies papers no.2. Kuala Lumpur: Institut Kajian Etnik (KITA)-Universiti Kebangssan Malaysia (UKM).
Simpson, E. H. 1949. Measurement of diversity. Nature 163: 688
Sultana, N. 2008. Bangladeshi diaspora in Peninsular Malaysia-organizational structure, survival strategies and networks. Berlin, Münster: LIT Verlag. UNESCO. 2000. World culture report, 2000: Cultural diversity, conflict and