106 August 2013
Accredited by DGHE No: 66b/DIKTI/Kep/2011 DOI: 10.5398/medpet.2013.36.2.106
*Corresponding author:
E-mail: [email protected]
Profiles of Cortisol, Triiodothyronine, Thyroxine and Neutrophil/Lymphocyte Ratio
as Stress Indicators in Swamp Buffaloes 15 Days Post-Transportation
H. Maheshwaria,*,Yulnawatib, A. Esfandiaria, Andriyantoa, M. D. Andriania, & A. Khovifaha aDepartment of Anatomy, Physiology and Pharmacology, Faculty of Veterinary Medicine,
Bogor Agricultural University
#Jln. Agatis, Kampus IPB Darmaga, Bogor 16680, Indonesia bResearch Center for Biotechnology, Indonesian Institute of Sciences (LIPI),
Jln. Raya Bogor km. 46, Cibinong, 16911, West Java, Indonesia (Received 24-06-2013; Reviewed 01-08-2013; Accepted 09-09-2013)
ABSTRACT
Transportation may cause stress that affects livestock’s health. This research was conducted to observe the effect of transportation on the profiles of blood cortisol, triiodothyronine (T3), thyroxine (T4) and neutrophil/lymphocyte (N/L) ratio as stress indicators during 15 days post-transportation. Four females swamp buffaloes, 2-yr-old were used in this research. The animals were transported using an open truck, along 15 kilometers distance for 2 h. During acclimatization, the animals were fed grass twice a day and access to water ad libitum. Blood was collected at the time of arrival and everyday for 15 d post-transportation. Cortisol, T3 and T4were analyzed using Radioimmunoassay (RIA) method. Blood smears were also prepared and stained with Giemsa for leukocyte differential counts. Results showed a significant relation (P<0.05) between transport and an increase in cortisol and T4 level on day-1 post-transportation compared to the normal levels. The level of T3 was also increased on day-3 post-transportation. Total leukocyte counts were 8.91-18.83×10³/μL. Neutrophil, eosinophil, monocyte, and lymphocyte counts were 4.87-10.41×10³/μL, 0.66-1.75×10³/μL, 0.11-0.58×10³/ μL, and 2.98-6.21×10³/μL, respectively. N/L ratio was 1.23-3.49 with >1.5 in average throughout the period of the research. It is concluded that transportation causes stress and therefore changes metabolic process.
Key words: cortisol, N/L ratio, swamp buffalo, thyroxine, triiodothyronine
ABSTRAK
Transportasi dapat menyebabkan suatu kondisi stres yang berdampak terhadap kesehatan ternak. Penelitian ini bertujuan untuk mengkaji pengaruh transportasi terhadap kadar kortisol, triiodotironin (T3), tiroksin (T4) darah dan rasio neutrofil/limfosit (N/L) sebagai indikator cekaman selama 15 hari pasca-transportasi. Empat ekor kerbau lumpur betina usia 2 tahun digunakan dalam penelitian ini. Kerbau-kerbau tersebut ditranspor menggunakan truk bak terbuka menempuh jarak 15 km selama 2 jam. Selama 15 hari masa aklimatisasi, kerbau-kerbau tersebut diberi pakan rumput 2 kali sehari dan air minum ad libitum. Pengambilan darah dilakukan setiap pagi hari sejak tiba di lokasi selama 15 hari pasca-transportasi. Kadar kortisol, T3, dan T4 diukur menggunakan metode radio-immunoassay (RIA). Diferensiasi leukosit dilakukan menggunakan preparat ulas darah yang telah diwarnai dengan pewarna Giemsa. Hasil yang diperoleh menunjukkan bahwa terdapat korelasi yang signifikan (P<0,05) antara transportasidanpeningkatan kadar kortisol dan T4 pada hari ke-1 pasca-transportasi bila dibandingkan dengan kadar normal, sedangkan peningkatan kadar T3 terlihat pada hari ke-3pasca-transportasi. Kisaran jumlah leukosit total adalah 8,91-18,.83×10³/μl, jumlah neu-trofil, eosinofil, monosit, dan limfosit secara berturut-turut adalah 4,87-10,41×10³/μl, 0,66-1,75×10³/μl, 0,11-0,58×10³/μl, dan 2,98-6,21×10³/μl. Rasio N/L berkisar antara 1,23-3,49 dengan rerata >1,5. Dari hasil yang diperoleh dapat disimpulkan bahwa hewan mengalami cekaman transportasi sehingga proses metabolisme mengalami perubahan.
August 2013 107 INTRODUCTION
Transportation is one of the important parts in livestock management that is addressed for marketing of animals in large numbers, transporting to the slaugh -ter house, providing breeding stock to other areas,
relocation animals from dry to green areas, and also for changing ownership purposes (Grandin, 2004; Averós et al., 2008). Transport process can lead to a condition of stress for animals. Stress is a condition that originates from one or more sources and affects the body system of the animals. The stressors can either raise from inside of the body or come form surrounding (Christiansen et al., 2007).
Animals in transport may be exposed to both psy
-chological (restraint, handling, novelty and unfamiliar animals and environments), and physical (hunger, thirst, injury, and extreme weather condition) stressors. Stress condition in particular heat stress can affect the health and welfare of the animals. Heat stress has been recog
-nized as one of the commonest problems encountered farm animals during road transportation to the slaughter house or to the new farm (Zulkifli et al., 2010).
During heat stress condition, body system will
provide physiological responses such as changes in
res-piration and heart rate, hormonal, pH and other blood chemistry parameters, and concentration of plasma ions (Beatty et al., 2006; Marai et al., 2007; Odore et al., 2011). Those physiological responses will have impacts on growth, body weight and milk production (Garriga et al., 2006). In addition, physiological response in individual who experience stress is changes in leukocyte profiles. One of the indicators of stress through leukocyte pro
-files is the increase of neutrophil/lymphocyte (N/L) ratio (Kannan et al., 2000; Maheshwari et al., 2008). Rajion et al. (2001) reported that N/L ratio and serum glucose concentration in goats were significant elevated during transportation at an ambient temperature of 29 oC. In the stressful condition of transport, adrenokortikoid
activity is also increased and indicated by an increase in
cortisol level. In addition to this hormone, stress condi
-tion can also affect the secre-tion of the thyroid hormone, triiodothyronine (T3) and tetraiodothyronine/thyroxine (T4) with various mechanisms (Hangalapura et al., 2004; Astuti et al., 2010; Azis et al., 2012).
Until recently, it has been widely reported on the effects of stress transportation in cattle, goat, sheep, pig and poultry (Tarrant & Grandin, 2000; Kannan et al., 2000), but it is still limited reported in buffaloes. Swamp buffalo (Bubalus bubalis) is one of the Indonesia’s key commodities other than cattle, goat, sheep and chicken. Based on the survey data of cattle, dairy cow, and buffalo, the population of buffalo in Indonesia in year 2011 was estimated at 1,305,016 heads (Ditjennak, 2011).
Buffalo has a pivotal role in the socio-economic life of Indonesian people as producers of meat, milk, labor, fertilizer, and leather. Ownership of buffalo among particular societies is also considered as a deter
-minant of social status of the owners (Peter et al., 2003). Distribution of buffalo between regions in Indonesia, as well as high demand for domestic, regional, and inter
-national markets bring about transport system of buffalo
plays an important role, therefore, a proper transport management needs to be applied to the transportation of this animal. Given the increasing public awareness about the concept of animal welfare, all aspects in transport management including the treatments before, during, and after transportation of animals to various destina
-tions need to be taken seriously to avoid adverse effects to the animals transported.
This research was conducted to assess the profiles of cortisol, thyroid hormones (T3 and T4) and the ratio of neutrophil/lymphocyte (N/L) as stress indicators in female swamp buffaloes during 15 days post-transporta
-tion. The results of this study are expected to provide information about the condition of buffalo during 15 days post-transportation or during acclimatization period before being used as research subjects as well as for other purposes. In addition, the data obtained from this research is also hoped to be used as a reference to establish appropriate conditions during the process of transportation of livestock, particularly buffalo, includ
-ing animal welfare aspects to minimize the level of stress
during road transportation.
MATERIALS AND METHODS
Animal Transportation
A total of four female swamp buffaloes aged 2 yr old were used in this research. These animals were subject
-ed to road transportation during the day at 11 am over a total distance of about 15 km for 2 h form Tenjolaya Village, Bogor District to Reproduction Rehabilitation Unit (URR), Bogor Agricultural University, Darmaga. Vehicle used was an open truck with 3 m (L) x 2 m (W) x 1.5 m (H) in size. No access to feedstuff and drinking water during transportation.
Animal Housing
During 15 d post-transportation, each animal was maintained in individual cage, with 2 m (L) x 3 m (W) in size, and floor made of cement. The cages were cleaned twice a day, every morning and evening. The tempera
-ture and humidity of the environment surrounding the cage were also measured every day. Feedstuff was given twice a day in the morning and evening, while access to drinking water was ad libitum. The animals were bathed every morning and evening to prevent dehydration, and occasionally were released to the pasture for grazing.
Blood Collection and Analysis
At arrival, the animals were unloaded individually and blood samples (5 mL) were collected from jugular
veinusing 5 mL syringe and 18G needle. Pre-transpor
-tation blood samples were not assayed as the research would be focused on the dynamic of the hormones and N/L ratio during acclimatization periode (15 d
post-transportation). For hormone analysis, blood was placed
108 August 2013
placed into tubes containing ethylenediaminetetraacetic acid (EDTA).
At the same time, blood smears were also prepared using Giemsa’s stain for leukocyte differential counts and the ratio of neutrophil and lymphocyte (N/L) determination. Blood was continuosly collected ev
-eryday at 07.00–08.00 in the morning for 15 d. Cortisol concentration was analyzed for daily blood samples, whereas T3 and T4 concentrations were analyzed for every 2 d blood samples. Concentration of cortisol, T3, and T4 were assayed using Radio Immunoassay (RIA) kit (Izotop, Institute of Isotopes Ltd, Budapest) after all blood samples were collected.
Data Analysis
Data of cortisol, T3 and T4 obtained were analysed using analysis of variance test (Anova) and continued by Duncan’s test. Data of N/L were analyzed descriptively.
RESULTS AND DISCUSSION
Profile of Cortisol
Animals in transport may be exposed to variety of
psychological and physical stressors. Stressful condi
-tions can lead to increased blood pressure and emotion, increased in sympathetic nerve activity, psychological disorder, changes in hormonal system as well as changes
in metabolic rate (Marai et al., 2007).
Various stressors encountered animals during transport can be occurred while handling, loading, be
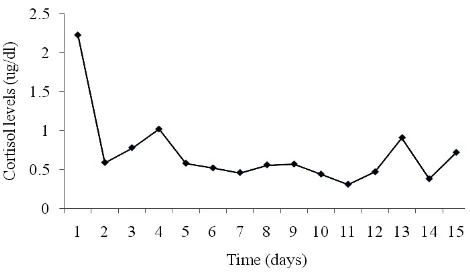
-ing on vehicle, and mov-ing to a new environment. One commonly used as indicator of physiological stress in post-transportation is the measurement of blood cortisol level (Christiansen et al., 2007). Cortisol profile obtained from this research showed the influence of transporta
-tion in buffaloes (Figure 1).
The effect of transportation was indicated by the high level of cortisol on day-1 when the animals just arrived to the location (Figure 1). Cortisol level on
day-1 was significantly different (P<0.05) compared to the
normal level (Khan et al., 2003) and to any other days,
then seemed to decline during 15 d post-transportation.
This is consistent with the result obtained by Kannan et
al. (2000) which found that the level of cortisol started to elevate at the preload and reached the peak at postload,
then began to decline after 1 h and reached the baseline after 3 h post-transportation. Subsequently, the adapted animal would give rise the decrease in cortisol level.
The increase of blood cortisol is due to the response of animal to the stress transportatiom including the type of vehicle used, the number of animals transported, distance, heat, and fasting. Type of transportation used for the buffaloes in this research is categorized as short-term transportation and can cause stress on the animal. The results obtained in this research were also consistent with those of reported by Honkavaara et al. (2003) who found that the concentration of cortisol would rise then fell significantly during short-term transportation (ap
-proximately 1.5 h) compared to the long-term transpor
-tation (7-10 h).
In normal condition, secretion of adrenocorticotropic hormone (ACTH) from the anterior pituitary will be suppressed when glucocorticoid levels increase (negative feedback mechanism). However, under stress condition, hypothalamus is stimulated to secrete corticotropin-releasing hormone (CRH) which in turn stimulates the anterior pituitary to release ACTH. With the increased of ACTH secretion, the adrenal cortex will be activated to increase the secretion of cortisol. Cortisol level will then remain high due to the inhibition of negative feedback mechanism to the hypothalamus and pituitary resulting in continual secretion of CRH and ACTH (Burdick et al.,
2011).
The decrease in cortisol level started on day-2
post-transportation (Figure 1) that might be due to several factors as follows: 1) adaptation process to the stress.
Adaptation is a physiological response to repetitive
stimuli. In this period, the animal starts to adapt to the new environment, lowers the stress level and establishes the comfort zone, 2) secretion of ß-endorphin in response to stress. This mechanism occurs as a consequence of a feedback mechanism to counteract repetitive stimuli. This condition causes the pituitary pars intermedia and pars anterior secrete ß-endorphin which has the effect to suppress the onset of stress, as reported by Fazio et al. (2008), and 3) no repetitive stimuli to the animal during transportation. Stimuli during transportation can cause rapid stress response which will decrease immediately. This can be attributed to the speed of the hypothalamus
in response to a given stimuli (Christiansen et al. 2007).
On day-3 and day-4 cortisol level seemed to in
-crease again (Figure 1). This in-crease occurred after a
decline, which was probably due to an abrupt changes
in environment that could not be coped by the animal properly. Changes in environment that occured were changes in habitat conditions from free-ranging grazing into an individual cage of 2 m (L) x 3 m (W) x 1.5 m (H) in xize and no interaction between animals. Wallowing habit that was normally performed in the area of origin
could not be done freely. The level of cortisol seemed to be decreased in the following days after arrival. The fluctuation of cortisol levels throughout the course of research hence represented changes in environment con
-ditions including temperature and humidity which were not the same every day. The response of the animal to
August 2013 109 the environment change can be more clear in studying
the diurnal profile of cortisol. According to Marai dan Haeeb (2010) and Farooq et al. (2010), changes in tem
-perature could cause changes in the biological function of animal including decreased in appetite, disturbances in metabolic, hormonal secretion, enzyme reactions, and blood metabolites.
Profile of T3
T3 homone is synthesized from T4 and secreted by the thyroid gland. T3 formation can occur outside the thyroid gland and involves 5’-deiodinase enzyme. These enzymes are presented in various organs, especially in the liver and intestine of which the amount of this en
-zyme is relatively high (Nguyen et al., 2003). According to Todini (2007) circulating of thyroid hormone can be considered as an indicator of changes in metabolic and nutritional status of the animal.
The profile of T3 was fluctuated and seemed to increase from day-3 post-transportation then started to decline on day-5 onwards (Figure 2). The level of T3 on day-3 and day-5 post-transportation was significantly
different (P<0.05) compared to any other days. Some fac
-tors can involve ini this phenomenone, such as 1) lack of
energy sources in animal body due to the deprivation of feedstuff and drinking water during transportation. To meet the energy needs, the body will utilize the reserve
energy through the process called gluconeogenesis. This
condition will thus increase the level of T3. The overall effect of T3 hormone is to increase the basal meta
-bolic rate, to make more glucose available to the cells to stimulate protein synthesis, to improve lipid metabolism and to stimulate the heart and nervous sysem (Todini, 2007). Once the body’s energy needs are met, T3 level will gradually declined, 2) during the exposure of stress transportation which results in increasing in cortisol level, the body tries to compensate this acute stress to prevent to be worse by adjusting the metabolism process so that the T3 level is increased. Meanwhile, the decline of the T3 level that occurred after the day-2 may be due to the animal adaptation process so that the body has returned to normal basal metabolism rate as energy supply becomes sufficient.
Profile of T4
T4 hormone is a thyroid hormone which is present
-ed in large quantities in the inactive form. The majority of hormone secreted by the thyroid gland is T4 and the rest is T3, but at the end all T4 will be altered to the active form T3 through the process of deiodinasi using 5’-deiodinase-enzyme (Hernandez & Germain, 2003).
Level of T4 was high at the time of arrival and de
-creased on day-3 post-transportation. The level of T4 on day-3 was significantly different (P<0.05) compared to the level of T4 on day-1 (Figure 3).
The highest level of T4 was found on day-1, but still lower compared with normal T4 in cattle as reported by Cinar & Selcuk (2005). High level of T4 on day-1 was presumably due to the impact of acute stress during transportation as well as type of transportation used.
The comparison between the level of two thyroid hormones, T3 and T4 showed the different level of each hormone on the day-2. Figure 2 and Figure 3 showed that once the level of T3 increased, T4 level would decrease. This condition may also be associated with an increase in the level of cortisol, as cortisol has metabolic effect that can increase gluconeogenesis by 6-10 times. The condition without feedstuff and drinking water
during transportation leads to a deficiency of energy
sources that induced the process of gluconeogenesis and increase thyroid hormone levels (Marai & Haeeb, 2010).
The level of T4 seemed to be declined on day-2, and this is likely due to the changing process of inactive T4 to a more active T3. This condition is supported by
Christiansen et al. (2007) who stated that an increase of T4 level or decrease of T3 level could occur due to the conversion of T4 to T3 which is more active form.
Cortisol, T3, and T4 Responses to the Temperature and Humidity of the Environment
There was relationship between temperature and humidity of the environment and the levels of cortisol, T3, and T4 of the experimental animals (Table 1). The average of ambient temperature was 25.7 oC and the average of humidity was 86%. As for the relationship between temperature and cortisol levels, it can be seen that the temperature on day-1 was relatively above the average. Heat stress condition might increase the level
Figure 2. Triiodothyronine (T3) levels of female swamp buffa -loes during 15 d post-transportation
110 August 2013
of stress, and could also cause cortisol level remain high on the first day of arrival. Factors associated with heat stress that can affect physiological responses are the ambient temperature, relative humidity (% RH) and radiation energy. High environmental humidity can exacerbate heat stress conditions (Marai & Haeeb, 2010).
Furthermore Marai & Haeeb (2010) stated that the level of cortisol would increase during acute heat stress con -ditions. This is because glucocorticoids can lead to the
transport of amino acids and fats from the cells so it can be used immediately as a source of energy and for the synthesis of other compounds including glucose needed by various tissues of the body (gluconeogenesis process) (Christiansen et al., 2007).
Gluconeogenesis process is consistent with the increased of T3 level on day-2 because of an increase in the body’s metabolic processes. This process is accompa
-nied by the increased of the inactive form conversion of T4 to the active form of T3 that cause the decrease of T4 level on day-2. On day-3 onwards temperature changes seemed to have no significant effect on the level of cor
-tisol, T3, and T4. This is likely because of the adaptation process that has already established in animal’s body.
Neutrophil/Lymfocyte (N/L) Ratio
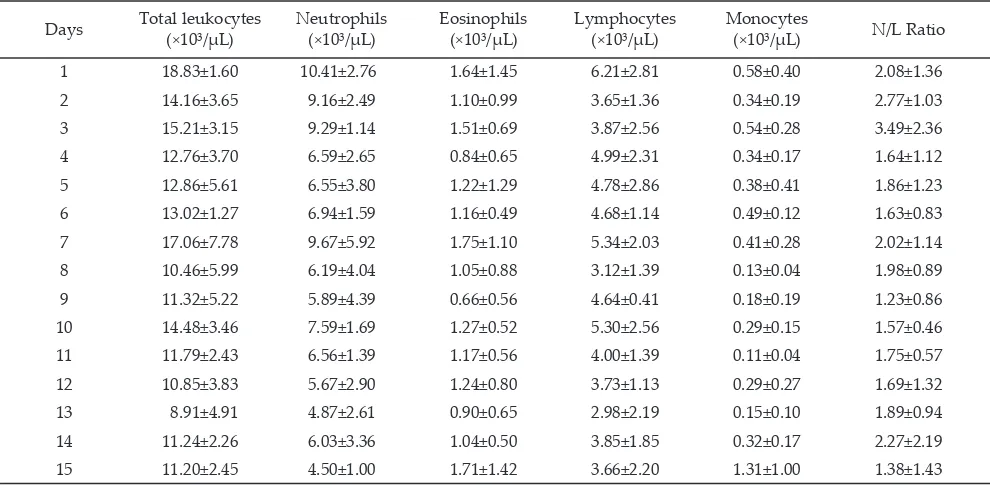
The range of total leukocyte count of swamp buffaloes during 15 d post-transport was 8.91-18.83 × 10³/mL with neutrophil, eosinophil, lymphocyte and monocyte counts were 4.87-10.41 × 10³/mL, of 0.66-1.75 × 10³/mL, of 2.98-6.21 × 10³/mL, 0.11 to 0.58 × 10³/mL and the ratio of N/L ranged from 1.23 to 3.49 (Table 2). Total leukocyte count was highest on day-1 and increased 76% when compared with the results obtained by Sulong et al. (1980). This number was increased by 34% when compared to the day-2 during 15 d post-transportation, then started to decline and remain constant until day-7. After day-7, the total number of leucocytes increased by 31%, but was still lower than day-1. In this condition, the release of cortisol which occurs when animals under stress, will stimulate bone marrow to release mature neutrophils, resulting in increasing number of
Days Total leukocytes (×10³/μL) Neutrophils(×10³/μL) Eosinophils(×10³/μL) Lymphocytes (×10³/μL) Monocytes(×10³/μL) N/L Ratio 1 18.83±1.60 10.41±2.76 1.64±1.45 6.21±2.81 0.58±0.40 2.08±1.36 2 14.16±3.65 9.16±2.49 1.10±0.99 3.65±1.36 0.34±0.19 2.77±1.03 3 15.21±3.15 9.29±1.14 1.51±0.69 3.87±2.56 0.54±0.28 3.49±2.36 4 12.76±3.70 6.59±2.65 0.84±0.65 4.99±2.31 0.34±0.17 1.64±1.12 5 12.86±5.61 6.55±3.80 1.22±1.29 4.78±2.86 0.38±0.41 1.86±1.23 6 13.02±1.27 6.94±1.59 1.16±0.49 4.68±1.14 0.49±0.12 1.63±0.83 7 17.06±7.78 9.67±5.92 1.75±1.10 5.34±2.03 0.41±0.28 2.02±1.14 8 10.46±5.99 6.19±4.04 1.05±0.88 3.12±1.39 0.13±0.04 1.98±0.89 9 11.32±5.22 5.89±4.39 0.66±0.56 4.64±0.41 0.18±0.19 1.23±0.86 10 14.48±3.46 7.59±1.69 1.27±0.52 5.30±2.56 0.29±0.15 1.57±0.46 11 11.79±2.43 6.56±1.39 1.17±0.56 4.00±1.39 0.11±0.04 1.75±0.57 12 10.85±3.83 5.67±2.90 1.24±0.80 3.73±1.13 0.29±0.27 1.69±1.32 13 8.91±4.91 4.87±2.61 0.90±0.65 2.98±2.19 0.15±0.10 1.89±0.94 14 11.24±2.26 6.03±3.36 1.04±0.50 3.85±1.85 0.32±0.17 2.27±2.19 15 11.20±2.45 4.50±1.00 1.71±1.42 3.66±2.20 1.31±1.00 1.38±1.43 Days Temperature (oC) Humidity(%) Cortisol (μg/dL) (μg/dL)T3 (μg/dL)T4
1 27.5 82 2.23a 0.08cb 4.21b
2 24.5 91 0.59cd
3 25.0 91 0.78cd 0.09b 3.65cb
4 26.5 84 1.02cb
5 24.0 91 0.58cd 0.06cb 2.75cd
6 28.0 70 0.52cd
7 28.0 85 0.46cd 0.06cb 2.77cd
8 27.0 77 0.56cd
9 26.0 84 0.57cd 0.04c 2.11d
10 26.5 84 0.44cd
11 23.5 91 0.31d 0.04c 2.14d
12 25.0 92 0.47cd
13 24.5 84 0.91cd 0.05cb 2.29cd
14 25.0 92 0.38d
15 25.0 92 0.72cd 0.04c 1.87d
Average 25.7 86
Note: Means in the same column with different superscript differ sig -nificantly (P<0.05).
Table 1. Temperature and humidity of the environment sur -rounding the cage, cortisol, triiodothyronine (T3), and thyroxine (T4) levels of female swamp buffaloes dur -ing 15 d post-transportation
August 2013 111 neutrophils in the circulation and gave rise of increasing
in the total leukocyte count. could occur when the animal had an infection or acute inflammation, or animals experiencing stress (Todini, 2007). Acute infection or acute inflammation will trigger the release of corticosteroids and catecholamine. Excessive amount of corticosteroids in the body can lead to a decrease in the number of circulating eosinophils.
Other types of leukocytes that is monocyte, had relatively constant in number from day-1 to day-7, then decreased on day-8 and remained constant throughout the course of the research. Monocyte plays an important role in phagocytosing foreign object in the body.
According to Kannan et al. (2000), monocytes did not significantly affect the response to stress, particularly
stress transportation.
Type of leukocytes that is very small in number, is basophil and only 0.02% found in the circulation of river buffalo. Basophil has a primary function in generating
a hypersensitivity reaction through its secretion that
have vasoactive characteristic. No basophil found in this study did not mean there is no basophil in the circula
-tion, but because of a very few number of basophils in
the circulation. Sulong et al. (1980) also reported that the
percentage of basophil in swamp buffaloes in Malaysia was only 0.3% of the total leukocyte count.
Lymphocyte count on day-1 was higher when com
-pared to the other days for 15 d post-transportation, and
then declined. Although it appeared to increase on day-7
and day-10, but the number was not higher compared to day-1. The overall number of lymphocyte during 15 d post-transportation was decreased except on day-1. High level of glukokortkoid can decrease the secretion of cytokines IL-2, which leads to reduced proliferation of lymphocytes and makes lymphocyte cells susceptible to apoptosis, thereby reducing its amount in the circulation (Hangalapura et al., 2004).
According to Kannan et al. (2000), the N/L ratio which exceeds of 1.5 may indicate stress. The high value of N/L ratio occurred on day-1 to day-3, this ratio started to decrease and relatively constant after those days. Fluctuation in the N/L ratio is strongly influenced by the number of neutrophils and lymphocytes, and is closely related to the influence of stress transportation. After the animals reach their comfort zone and become adapted, the N/L ratio will decrease and return to a physiological value (Zapata et al., 2004).
Animals experienced long trip often exposed to stress condition such as extreme temperature changes, exhaustion, lack of feedstuff and drinking water, as well as fear. The factors that cause stress can stimulate the secretion of glucocorticoids. Glucocorticoids are immu
-nosuppressants so that animals can become vulnerable to infection and this phenomenone known as shipping fever or transit fever (McDonald, 2003).
Transportation is an important part in livestock management. The selection of vehicle used to transport animals have to be considered, including proper con -struction and ventilation. Other aspects related to the
preparation and management of transport that need to be considered are as follows: the density of livestock, which is related to the size of individual animal, spe
-cies, numbers of livestock, construction and the size of vehicles (ACLG, 2003).
Furthermore, duration of transportation is not recommended for over 36 h and the animals should be rested for feeding and drinking if the travel takes more than 24 h. Conditions without feedstuff and drinking water during transportation can cause the decrease in body weight, and if the transportation is carried out during the day time can cause death due to heat stress
during transport. Handling and controlling related to conditions during transport should also be put in
consideration (Lampworth, 2002). Hence, the process of animals transport should be conducted properly so that the animals are free from fear and distress, and free from all forms of cruelty, according to the concept of animal welfare (Dallas, 2006).
CONCLUSION
Based on the type of transportation used, on the day-1 post-transportation all stress indicators in buffa
-loes increase and reach normal values on day-15. It can
be concluded that transportation causes stress and
there-fore changes metabolic process and it is recommended that the acclimatization period for experimental animals would be accomplished after 15 d post-transportation.
ACKNOWLEDGMENT
This research was supported by the HIBAH KOMPETENSI PROGRAM 2012, No.: 148/SP2H/PL/Dit.No.: 148/SP2H/PL/Dit. Litabmas/III/2012. Special thank goes to Dr Amrozi andDr Amrozi and all staffs at URR for providing the facilities for animals housing, and also to Jasmine, Sri, Ayu, Asep, Ahmad, Vecky and Mr. Kosasih for their kindly help in perform -ing all the activities dur-ing carry-ing out the research.
REFERENCES
ACLG. Australian Council of Local Government. 2003. Cattle
transportation, code of practice for the transportation of cattle in Western Australia. Department of Local Govern
-ment and Regional Govern-ment. Perth.
Astuti, P., Sarmin, A. Kusumawati, C. M. Airin, H.
Mahesh-wari, & L. Sjahfirdi. 2010. Physiological response of bli
-gon buck to transportation: Relation to level of thyroid hormone. J. Vet. 11:87-91.
Averós, X., J. Serratosa, L. F. Gosólvez, S. Martín, & M. Rui. 2008. Stress response of extensively reared young bulls be
-ing transported to grow-ing finish-ing farms under Spanish summer commercial conditions. Livestock Sci.
119:174-182. http://dx.doi.org/10.1016/j.livsci.2008.04.002
112 August 2013
hormone and blood metabolites concentrations of broiler chickens subjected to feeding time restriction. Med. Pet.
35:32-37. http://dx.doi.org/10.5398/medpet.2012.35.1.32
Beatty, D. T., A. Barnes, E. Taylor, D. Pethick, M. McCarthy, &
S. K. Maloney. 2006. Physiological responses of Bos taurus
and Bos indicus cattle to prolonged, continuous heat and
humidity. J. Anim. Sci., 84: 972-985.
Burdick, N. C., J. A. Carroll, R. Randel, S. Willard, R. Vann, C.
C. Chase, S. Lawhon, L. E. Hulbert, & J. T. Welsh. 2011.
In-fluence of temperament and transportation on physiologi
-cal and endocrinologi-cal parameters in bulls. Livestock Sci.
139:213–221. http://dx.doi.org/10.1016/j.livsci.2011.01.013
Christiansen, J. J., C. B. Djurhuus, C. H. Gravholt, P. Iversen, J. S. Christiansen, O. Schmitz, J. Weeke, J. O. L. Jørgensen,
& N. Møller. 2007. Effect of cortisol on carbohydrate, lip
-id, and protein metabolism: studies of acute cortisol with
-drawal in adrenocortical failure. J. Clin. Endocr. Metab.
92:3553-3559. http://dx.doi.org/10.1210/jc.2007-0445
Cinar, A. & M. Selcuk. 2005.Effects of chronic fluorosis on
thyroxine, triiodothyronine, and protein-bound iodine in cows. Fluoride 38(1):65–68.
Dallas, S. 2006. Animal Biology and Care. 2nd ed. Blackwell Sci
-ence. US.
Ditjennak. 2011. Direktorat Jenderal Peternakan. Statistik
Indo-nesia 2011. Jakarta.
Fazio, E., P. Medica, V. Aronica, L. Grasso, & A. Ferlazzo.
2008. Circulating β-endorphin, adrenocorticotrophic hor
-mone and cortisol levels of stallions before and after short road transport: stress effect of different distances. Acta Vet.
Scand.50:6-21. http://dx.doi.org/10.1186/1751-0147-50-6
Farooq, U., H. A. Samad, F. Shehzad, & A. Qayyum. 2010.
Phys-iological responses of cattle to heat stress. WASJ 8: 38-43. Garriga, C., R. R. Hunter, C. Amat, J. M. Planas, M. A.
Mitch-ell, & M. Moreto. 2006. Heat stress increase apical glucose
transport in the chicken jejunum. Am. J. Physiol. Regul. In
-tegr. Comp. Physiol. 290:195-201. http://dx.doi.org/10.1152/ ajpregu.00393.2005
Grandin, T. 2004. Principles of design of handling facilities and
transport systems. In: G. J. Benson and B. E. Rollin (Eds). The well-being of farm animals, challenges and solutions. Blackwell Publishing, Ames. http://dx.doi.org/10.1002/978
0470344859.ch8
Hangalapura, B. N., M. G. Nieuwland, J. Buyse, B. Kemp, &
H. K. Parmentier. 2004. Effect of duration of cold stress
on plasma adrenal and thyroid hormone levels and im
-mune response ini chickens line divergently selected for
antibody respons. Poultry Sci. 83:1644-1649.
Hernandez, A. & D. L. Germain. 2003. Thyroid hormone de
-iodinases: physiology and clinical disorders. Curr. Opin. Pediatr. 15:416–420. http://dx.doi.org/10.1097/00008480-200308000-00011
Honkavaara, M., E. Rintasalo, J. Ylonen, & T. Pudas. 2003.
Meat quality and transport stress of cattle. Dtsch. Tierarztl. Wochenschr. 110:125-128.
Kannan, G., T. H. Terrill, B. Kouakou, O. S. Gazal, S. Gelaye,
E. A. Amoah, & S. Samake. 2000. Transportation of goats:
effects on physiological stress responses and live weight loss. J. Anim. Sci. 78:1450-1457.
Khan, M. A., M. Ashraf, K. Pervez, H. A. Hashmi, & A. K.
Mah-mood. 2003. Effects of detomidine on blood chemistry and
electrolyte profile in buffalo calves. Int. J. Agri. Biol.
5:308-310.
Kim, C. Y., J. S. Han, T. Suzuki, & S. S. Han. 2005. Indirect
indi-cator of transport stress in hematological values in newly acquired cynomolgus monkeys. J. Med. Primatol. 34:188–
192. http://dx.doi.org/10.1111/j.1600-0684.2005.00116.x
Lampworth, J. W. 2002. Cattle loading strategies for road trans
-port. Department of Primary Industries and Fisheries.
Queensland.
Maheshwari, H., L. Sjahfirdi, P. Astuti, & Yulnawati.2008.
Ra-sio neutrofil dan limfosit (N/L) sebagai indicator stres pada Owa Jawa (Hylobates moloch Audebert 1797) yang dikan
-dangkan. Maj. I. Faal Ind. 7:116-122.
Marai, I. F. M. & A. A. M. Haeeb. 2010. Buffalo’s biological
functions as affected by heat stress a review. Livestock Sci.
127:89–109. http://dx.doi.org/10.1016/j.livsci.2009.08.001
2011. Effects of housing and short-term transportation on hormone and lymphocytereceptor concentrations in beef cattle. Res. Vet. Sci. 90:341–345. http://dx.doi.org/10.1016/ j.rvsc.2010.05.026
Peter, J. M. N., G. A. Persoon, & R. Jaffe. 2003. The buffalo in
ritual, myth and daily life of the Sa’dan Toraja”, Framing Indonesian Realities. KITLV Press, Leiden.
Rajion, M.A., I. M. Saat, I. Zulkifli, & Y. M. Goh. 2001. The
effect of road transportationon some physiological stress measures in goats. Asian-Aust. J. Anim. Sci. 14:1250-1252.
Sulong A., M. Hilmi, & M. R. Jainudeen. 1980. Haematology of
the Malaysian swamp buffalo (Bubalus bubalis). Pertanika
3:66-70.
Tarrant, V. & T. Grandin. 2000. Cattle transport In: T. Grandin
(ed). Livestock Handling and Transport. ACBI Publishing, Wellington UK. p. 151-174. http://dx.doi.org/10.1079/9780
851994093.0151
Todini, L. 2007. Thyroid hormones in small ruminants: effects of
endogenous, environmental, and nutritional factors. Anim.
1:997–1008. http://dx.doi.org/10.1017/S1751731107000262
Zapata, B., J. Gimpel, C. Bonacic, B. A. Gonzalez, J. L. Riveros,
A. M. Ramirez, F. Bas, & D. W. Macdonald. 2004. The ef
-fect of transport on cortisol, glucose, heart rate, leucocytes, and body weight in captive-reared guanacos (Lama guani
-coe). Anim. Welfare. 13:1-6.
Zulkifli, I. , B. Norbaiyah, Y.W. Cheah, A. F. Soleimani, A. Q.
Sazili, M. A. Rajion, & Y. M. Goh. 2010. Physiological
responses in goats subjected to road transportation un
-der the hot, humid, tropical conditions. Int. J. Agric. Biol.