LAMPIRAN A
Hasil Uji Pembuatan Kurva baku
Hari No Konsentrasi (ppm)
Absobansi Persamaan garis
I 1 5,03 0,113 Y= 0,0206x-0,0025
2 15,09 0,294 R2 = 0,9965
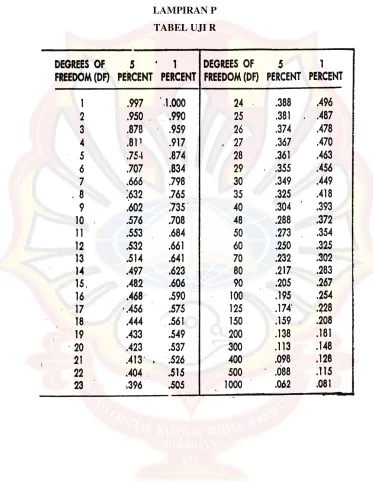
3 25,15 0,500 rhitung/rtabel= 0,9982/0,878 4 35,21 0,752 a = -0,0025 b = 0,0206 5 45,27 0,921 r = 0,9982
II 1 5,01 0,097 y = 0,0193x – 0,0098 2 15,03 0,263 R2 = 0,9960
3 25,05 0,466 rhitung/rtabel= 0,9980/0,878 4 35,07 0,697 a = - 0,0098 b = 0,0193 5 45,09 0,848 r = 0,9980
III 1 5,02 0,115 y = 0,0191x + 0,0113 2 15,06 0,282 R2 = 0,9987
3 25,10 0,497 rhitung/rtabel= 0,9994/0,878 4 35,14 0,691 a = 0,0113 b = 0,0191 5 45,18 0,870 r = 0,9994
LAMPIRAN B
PERHITUNGAN STATISTIK KURVA BAKU
Data Kurva Baku Propranolol HCl dalam Larutan Dapar Fosfat Isotonis pH 7,4 Pengujian I
Konsentrasi (ppm)
Absorbansi X2 Y2 XY
5,03 0,113 25,3009 0,01277 0,56839 15,09 0,294 227,7081 0,08644 4,43646
25,15 0,5 632,5225 0,25 12,575
35,21 0,752 1239,744 0,5655 26,4779 45,27 0,921 2049,373 0,84824 41,6937
∑=4174,649 ∑=1,76295 ∑=85,7514
Data Kurva Baku Propranolol HCl dalam Larutan Dapar Fosfat Isotonis pH 7,4 Pengujian II
Konsentrasi (ppm)
Absorbansi X2 Y2 XY
5,01 0,097 25,1001 0,00941 0,48597
15,03 0,263 225,9009 0,06917 3,95289 25,05 0,466 627,5025 0,21716 11,6733 35,07 0,697 1229,905 0,48581 24,4438
45,09 0,848 2033,108 0,7191 38,2363
∑=4141,517 ∑=1,50065 ∑=78,7923
Data Kurva Baku Propranolol HCl dalam Larutan Dapar Fosfat Isotonis pH 7,4 Pengujian III
Konsentrasi (ppm)
Absorbansi X2 Y2 XY
5,02 0,115 25,2004 0,01323 0,5773
15,06 0,282 226,8036 0,07952 4,24692
25,1 0,497 630,01 0,24701 12,4747
35,14 0,691 1234,82 0,47748 24,2817
45,18 0,87 2041,232 0,7569 39,3066
SSc = ∑ Yc – [( ∑ Xyc)2 / ∑ Xc ]
= 4,8377 – [ 245,4310 / 12474,2320 ] = 4,8181
SSp = SS1 + SS2 + SS3
= 1,7424 + 1,4816 + 1,5547 = 4,7787
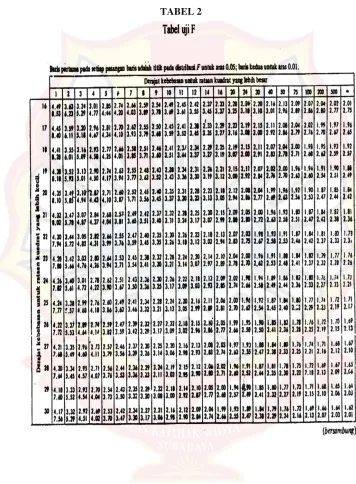
Fhitung = ( SSc SSp / k 1 ) / ( SSp / 12)
= (4,8181 4,7787 / 3 1 ) / (4,7787 / 12) = 0,0495 Fhitung < Ftabel 0,05 ( 2 ; 12 ) =0,0495<3,88
X2 Y2 XY N Ssi RDF
I 4174,649 1,76295 85,7514 5 1,7424 4 II 4141,517 1,50065 78,7923 5 1,4816 4 III 4158,066 1,57414 80,8873 5 1,5547 4
LAMPIRAN C
PERHITUNGAN MOISTURE CONTENT (MC) Formula -1
W (gram) Wp (gram) Wa (gram) MC (%)
0,130 0,109 0,021 19,27
0,117 0,098 0,019 19,39
0,124 0,104 0,020 19,23
Formula a
W (gram) Wp (gram) Wa (gram) MC (%)
0,238 0,180 0,062 32,22
0,220 0,165 0,055 33,33
0,246 0,185 0,061 32,97
Formula b
W (gram) Wp (gram) Wa (gram) MC (%)
0,143 0,119 0,024 20,17
0,112 0,093 0,019 20,43
0,127 0,105 0,022 20,95
Formula ab
W (gram) Wp (gram) Wa (gram) MC (%)
0,269 0,201 0,068 33.83
0,301 0,225 0,076 33,78
0,265 0,198 0,067 33,84
Keterangan : W = berat mula-mula
LAMPIRAN D
Anova: Single Factor SUMMARY
Groups Count Sum Average Variance
Column 1 3 57,89 19,29667 0,006933 Column 2 3 98,52 32,84 0,3207 Column 3 3 61,55 20,51667 0,157733 Column 4 3 101,45 33,81667 0,001033 ANOVA
Source of
Variation SS df MS F P-value F crit
Between
Groups 544,0868 3 181,3623 1491,466 2,5E-11 4,066181 Within
Groups 0,9728 8 0,1216
LAMPIRAN E
TABEL 4.4. HASIL AKURASI DAN PRESISI PENETAPAN KADAR PROPRANOLOL HCL DALAM LARUTAN DAPAR
FOSFATISOTONIS PH 7,4 DALAM FORMULA BLANGKO AB
Rep % Abs FP C(ppm) C(teoritis) % perolehan kembali 1
80 0,466 2,5 59,5157 64,1408 107,7712 100 0,619 2,5 79,5418 80,176 100,7973 120 0,725 2,5 93,4162 96,2112 102,9919 2
80 0,472 2,5 60,3010 64,1408 106,3677 100 0,623 2,5 80,0654 80,176 100,1381 120 0,73 2,5 94,0706 96,2112 102,2755 3
80 0,461 2,5 58,8612 64,1408 108,9695 100 0,625 2,5 80,3272 80,176 99,8117 120 0,712 2,5 91,7146 96,2112 104,9028 Contoh perhitungan :
Dari hasil serapan dimasukan ke dalam persamaan kurva baku terpilih yaitu y = 0,0191x + 0,0113
Dimana: y = Serapan
x = Konsetrasi teramati
Kemudian Hitung % perolehan kembali dengan rumus :
Misal : data replikasi 1 Y= 0,0191x + 0,0113 0,5471 = 0,0191x + 0,0113 x = 70,1335.
LAMPIRAN F
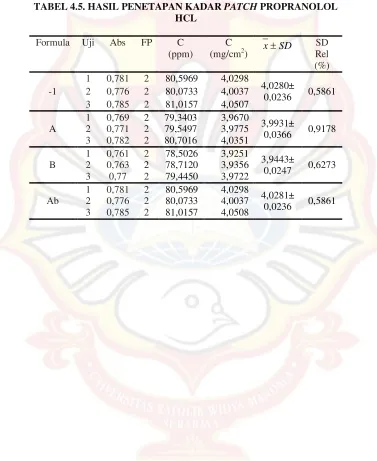
TABEL 4.5. HASIL PENETAPAN KADAR PATCH PROPRANOLOL
HCL
Formula Uji Abs FP C
(ppm)
C
(mg/cm2) xSD
SD Rel (%)
-1
1 0,781 2 80,5969 4,0298
4,0280±
0,0236 0,5861
2 0,776 2 80,0733 4,0037
3 0,785 2 81,0157 4,0507
A
1 0,769 2 79,3403 3,9670
3,9931±
0,0366 0,9178
2 0,771 2 79,5497 3,9775
3 0,782 2 80,7016 4,0351
B
1 0,761 2 78,5026 3,9251
3,9443±
0,0247 0,6273
2 0,763 2 78,7120 3,9356
3 0,77 2 79,4450 3,9722
Ab
1 0,781 2 80,5969 4,0298
4,0281±
0,0236 0,5861
2 0,776 2 80,0733 4,0037
LAMPIRAN G
HASIL UJI AKURASI DAN PRESISI UNTUK UJI PELEPASAN DALAM DAPAR FOSFAT ISOTONIS PH 7,4 DALAM FORMULA
AB
Replikasi % Abs C (ppm) C
(Teoritis)
% Perolehan Kembali 1
50 0,287 14,4345 15,0330 96,0191 75 0,419 21,3455 22,5495 94,6608 100 0,569 29,1989 30,0660 97,1162 2
50 0,284 14,2774 15,0330 94,9743 75 0,421 21,4502 22,5495 95,1252 100 0,576 29,5654 30,0660 98,3352 3
LAMPIRAN H
DATA PELEPASAN PROPRANOLOL HCL
1. Hasil Uji Pelepasan Patch Propranolol Formula -1
Replikasi t(jam) Abs Cn’(ppm)
Qt
(µg/cm2
)
Pengenceran
1
2
3
1 0,22 10,9267 226,1897
1,5 0,244 12,18325 252,201
2 0,33 16,68586 345,408
2,5 0,321 16,21466 335,6538
3 0,39 19,82723 410,4362
4 0,866 44,74869 926,3264
5 0,238 59,34555 1228,491 5x
6 0,258 64,58115 1336,871 5x
1 0,231 11,50262 238,1115
1,5 0,26 13,02094 269,5418
2 0,314 15,84817 328,0672
2,5 0,337 17,05236 352,9946
3 0,461 23,5445 487,3862
4 0,766 39,51309 817,9461
5 0,244 60,91623 1261,005 5x
6 0,286 71,91099 1488,603 5x
1 0,251 11,50262 259,7876
1,5 0,298 13,02094 310,7263
2 0,327 15,84817 342,1566
2,5 0,362 17,05236 380,0897
3 0,429 23,5445 452,7045
4 0,831 39,51309 888,3933
5 0,201 60,91623 1027,987 5x
6 0,263 71,91099 1363,966 5x
2. Hasil Uji Pelepasan Patch Propranolol Formula a
Replikasi t(jam) Abs Cn’(ppm) Qt (µg/cm2 ) 1
2
3
1,5 0,119 5,638743 116,7256
2 0,147 7,104712 147,0721
2,5 0,189 9,303665 192,5918
3 0,202 9,984293 206,6812
4 0,513 26,26702 543,744
5 0,603 30,97906 641,2862
6 0,791 40,82199 845,0412
1,5 0,134 6,424084 132,9826
2 0,185 9,094241 188,2566
2,5 0,2 9,879581 204,5136
3 0,34 17,20942 356,246
4 0,614 31,55497 653,2081
5 0,706 36,37173 752,9179
6 0,852 44,01571 911,1532
1,5 0,148 7,157068 148,1559
2 0,206 10,19372 211,0164
2,5 0,231 11,50262 238,1115
3 0,297 14,95812 309,6425
4 0,412 20,97906 434,2799
5 0,626 32,18325 666,2137
6 0,799 41,24084 853,7116
3. Hasil Uji Pelepasan Patch Propranolol Formula b
Replikasi t(jam) Abs Cn’(ppm) (µg/cmQt 2 ) 1
2
3
0,75 0,15 7,26178 150,3235
1 0,175 8,570681 177,4185
1,5 0,204 10,08901 208,8488
2 0,223 11,08377 229,4411
2,5 0,28 14,06806 291,2179
3 0,321 16,21466 335,6538
4 0,352 17,8377 369,2517
5 0,405 20,61257 426,6932
6 0,583 29,93194 619,6102
0,75 0,125 5,95288 123,2284
1 0,145 7 144,9045
1,5 0,198 9,774869 202,346
2 0,23 11,45026 237,0277
2,5 0,279 14,01571 290,1341
3 0,334 16,89529 349,7432
4 0,365 18,51832 383,3411
5 0,407 20,71728 428,8608
6 0,612 31,45026 651,0405
0,75 0,127 6,057592 125,396
1 0,158 7,680628 158,9939
1,5 0,211 10,4555 216,4355
2 0,246 12,28796 254,3686
2,5 0,301 15,16754 313,9777
3 0,357 18,09948 374,6707
4 0,411 20,9267 433,1961
5 0,459 23,43979 485,2186
6 0,625 32,13089 665,1299
4. Hasil Uji Pelepasan Patch Propranolol Formula ab
Replikasi t(jam) Abs Cn’(ppm) (µg/cmQt 2 )
1
2
3
1,5 0,163 7,942408 164,4129
2 0,224 11,13613 230,5249
2,5 0,318 16,05759 332,4024
3 0,354 17,94241 371,4193
4 0,402 20,4555 423,4418
5 0,448 22,86387 473,2968
6 0,52 26,63351 551,3306
1,5 0,152 7,366492 152,4911
2 0,237 11,81675 244,6143
2,5 0,321 16,21466 335,6538
3 0,363 18,41361 381,1735
4 0,417 21,24084 439,6989
5 0,453 23,12565 478,7158
6 0,551 28,25654 584,9285
1,5 0,132 6,319372 130,815
2 0,225 11,18848 231,6087
2,5 0,299 15,06283 311,8101
3 0,337 17,05236 352,9946
4 0,391 19,87958 411,52
5 0,461 23,5445 487,3862
6 0,517 26,47644 548,0792
LAMPIRAN I
1. Hasil Uji Penetrasi Patch Propranolol Formula -1
Replikasi t(jam) Abs C n’(ppm) (µg/cmQt 2 )
1
1,5 0,153 7,41884 153,5749 2 0,156 7,57591 156,8263 2,5 0,16 7,78534 161,1615 3 0,168 8,20418 169,8319 4 0,169 8,25654 170,9157 5 0,171 8,36125 173,0833 6 0,246 12,2879 254,3686
2
1,5 0,133 6,3717 131,8988 2 0,146 7,0522 145,9883 2,5 0,152 7,3665 152,4911 3 0,168 8,2041 169,8319 4 0,185 9,0942 188,2566 5 0,211 10,4555 216,2566 6 0,254 12,7068 263,039
3
2. Hasil Uji Penetrasi Patch Propranolol Formula a
Replikasi t(jam) Abs C n’(ppm) Qt (µg/cm2 )
1
1,5 0,14 6,73822 139,4854 2 0,165 8,04712 166,5805 2,5 0,166 8,099476 167,6643 3 0,168 8,204188 169,8319 4 0,181 8,884817 183,9214 5 0,202 9,984293 206,6812 6 0,218 10,82199 224,0221
2
1,5 0,136 6,528796 135,1502 2 0,155 7,52356 155,7425 2,5 0,164 7,994764 165,4967 3 0,176 8,623037 178,5024 4 0,197 9,722513 201,2622 5 0,208 10,29843 213,184 6 0,235 11,71204 242,4467
3
3. Hasil Uji Penetrasi Patch Propranolol Formula b Replikasi T
(jam) Abs
C n’ (ppm)
Qt
(µg/cm2
)
1
1,5 0,097 4,486911 92,88192 2 0,102 4,748691 98,30093 2,5 0,156 7,575916 156,8263 3 0,173 8,465969 175,2509 4 0,177 8,675393 179,5862 5 0,194 9,565445 198,0108 6 0,246 12,28796 254,3686
2
1,5 0,092 4,225131 87,4629 2 0,115 5,429319 112,3904 2,5 0,124 5,900524 122,1446 3 0,185 9,094241 188,2566 4 0,197 9,722513 201,2622 5 0,225 11,18848 231,6087 6 0,239 11,92147 246,7819
3
1,5 0,079 3,544503 73,37346 2 0,122 5,795812 119,977 2,5 0,13 6,21466 128,6474
4. Hasil Uji Penetrasi Patch Propranolol Formula ab Replikasi t
(jam) Abs
C n’
(ppm) Qt (µg/cm 2
)
1
2,5 0,116 5,481675 113,4742 3 0,127 6,057592 125,396 4 0,133 6,371728 131,8988 5 0,146 7,052356 145,9883 6 0,185 9,094241 188,2566
2
2,5 0,175 8,570681 177,4185 3 0,182 8,937173 185,0052 4 0,185 9,094241 188,2566 5 0,191 9,408377 194,7594 6 0,215 10,66492 220,7707
3
LAMPIRAN J
DATA PENETRASI BLANKO PROPRANOLOL HCL
Replikasi t
(jam) Abs C n’(ppm)
Qt
(µg/cm2
)
1
2 0 0 0
2,5 0 0 0
3 0,01 -0,0681 -1,4089
4 0,013 0,0890 1,8424
5 0,025 0,7173 14,8481 6 0,040 1,5026 31,1052
2
2 0 0 0
2,5 0 0 0
3 0,012 0,0366 0,7587
4 0,017 0,2984 6,1777
5 0,021 0,5079 10,5129
6 0,32 1,0838 22,4347
3
2 0,015 0,1937 4,0100
LAMPIRAN K
HASIL UJI ANOVA PELEPASAN PROPRANOLOL HCL DENGAN DESAIN FAKTORIAL
Response1 Pelepasan
ANOVA for selected factorial model
Analysis of variance table [Partial sum of squares - Type III] Sum of
Sum of Df Mean
Square F Valu e
p-value Prob > F Model
A-CMC Na B-Tween 60 AB Pure Error Cor Total 56854.34 5071.74 47575.09 4207 1430.92 58285.26 3 1 1 1 8 11 18951.45 5071.74 47575.09 4207.51 178.86 105.9 5 28.36 265.9 8 23.52 < 0.0001 0.0007 < 0.0001 < 0.0013 significant
The Model F-value of 105.95 implies the model is significant. There is only
a 0.01% chance that a "Model F-Value" this large could occur due to noise.
Values of "Prob > F" less than 0.0500 indicate model terms are significant.
In this case A, B, AB are significant model terms.
Values greater than 0.1000 indicate the model terms are not significant. If there are many insignificant model terms (not counting those required to support hierarchy),
model reduction may improve your model.
The "Pred R-Squared" of 0.9448 is in reasonable agreement with the "Adj R-Squared" of 0.9662.
"Adeq Precision" measures the signal to noise ratio. A ratio greater than 4 is desirable. You ratio of 21.634 indicates an adequate signal. This model can be used to navigate the design space.
Coefficient Standard 95% CI 95% CI Factor Estimate df Error Low High VIF Intercept 148.35 1 3.86 139.45 157.25 A-CMC Na -20.56 1 3.86 -29.46 -11.66 1.00 B-Tween 60 -62.97 1 3.86 -71.87 -54.06 1.00 AB 18.73 1 3.86 9.82 27.63 1.00
Final Equation in Terms of Coded Factors:
Pelepasan =
+148.35
-20.56 * A
-62.97 * B
+18.73 * A * B
Final Equation in Terms of Actual Factors:
Pelepasan =
+148.35167
-20.55833 * CMC Na
-62.96500 * Tween 60
+18.72500 * CMC Na * Tween 60
The Diagnostics Case Statistics Report has been moved to the Diagnostics Node.
In the Diagnostics Node, Select Case Statistics from the View Menu. Proceed to Diagnostic Plots (the next icon in progression). Be sure to look at the:
2) Studentized residuals versus predicted values to check for constant error.
3) Externally Studentized Residuals to look for outliers, i.e., influential values.
4) Box-Cox plot for power transformations.
LAMPIRAN L
Sum of Sum of
Squares
Df Mean Square
F Value
p-value Prob > F Model A-CMC Na B-Tween 60 AB Pure Error Cor Total 776.20 137.77 178.6445 9.79 543.24 1319.45 3 1 1 1 8 1 1 258.73 137.77 178.64 459.79 67.91 3.81 2.03 2.63 0.0031 6.77 0.0578 0.1922 0.1435 0.0315 Not significant
The Model F-value of 3.81 implies there is a 5.78% chance that a "Model F-Value"
this large could occur due to noise.
Values of "Prob > F" less than 0.0500 indicate model terms are significant.
In this case AB are significant model terms.
Values greater than 0.1000 indicate the model terms are not significant. If there are many insignificant model terms (not counting those required to support hierarchy),
model reduction may improve your model.
Std. Dev. 8.24
Mean 21.26
C.V. % 38.75
PRESS 1222.29 Adeq Precision 4.224
The "Pred Squared" of 0.0736 is not as close to the "Adj R-Squared" of 0.4339 as one might
normally expect. This may indicate a large block effect or a possible problem with your model
and/or data. Things to consider are model reduction, response transformation, outliers, etc.
"Adeq Precision" measures the signal to noise ratio. A ratio greater than 4 is desirable. Your
Coefficient Standard 95% CI 95% CI
Factor Estimate df Error Low High VIF
Intercept 21.26 1 2.38 15.78 26.75 A-CMC Na -3.39 1 2.38 -8.87 2.10 1.00 B-Tween 60 3.86 1 2.38 -1.63 9.34 1.00 AB -6.19 1 2.38 -11.68 -0.70 1.00
Final Equation in Terms of Coded Factors:
Penetrasi =
+21.26
-3.39 * A
+3.86 * B
-6.19 * A * B
Final Equation in Terms of Actual Factors:
Penetrasi =
+21.26333
-3.38833 * CMC Na
+3.85833 * Tween 60
-6.19000 * CMC Na * Tween 60
The Diagnostics Case Statistics Report has been moved to the Diagnostics Node.
In the Diagnostics Node, Select Case Statistics from the View Menu. Proceed to Diagnostic Plots (the next icon in progression). Be sure to look at the:
2) Studentized residuals versus predicted values to check for constant error.
3) Externally Studentized Residuals to look for outliers, i.e., influential values.
4) Box-Cox plot for power transformations.
LAMPIRAN M
POINT PREDICTION DENGAN DESAIN FAKTORIAL
Factor Name Level Low Level Hight Level Std. Dev Coding
A CMC Na 0.00 -1.00 1.00 0.000 Actual
B Tween 60 0.00 -1.00 1.00 0.000 Actual
LAMPIRAN N
PERHITUNGAN BATAS FLUKS PELEPASAN DAN PENETRASI PADA PATCH DENGAN LUAS 100 cm2
Pelepasan :
Bawah = (80µg/ml x 462 ml/jam)/100 cm2= 369,6 µg/cm2
/jam
Atas = (100µg/ml x 462 ml/jam)/100 cm2= 462 µg/cm2
/jam
Penetrasi :
Bawah = (9µg/ml x 462 ml/jam)/100 cm2= 41,54 µg/cm2
/jam