IMPROVING THE STUDENTS’
READING
COMPREHENSION BY USING PICTOGRAM
(A Classroom Action Research of the Students of X IPA-2 of SMA Kartika III-1 in the Academic Year 2017/2018)
A GRADUATING PAPER
Submitted to the Board of Examiners as a partial fulfillment of the requirements for the degree of Sarjana Pendidikan (S.Pd)
English Education Department of Teacher Training and Education Faculty State Institute for Islamic Studies (IAIN) Salatiga
By:
IZZAH KHOIRI
113 13 151
ENGLISH EDUCATION DEPARTMENT
TEACHER TRAINING AND EDUCATION FACULTY
STATE INSTITUTE FOR ISLAMIC STUDIES (IAIN) SALATIGA
v MOTTO
“IT WOULD BE YOU IF YOU NEVER EVER GIVE UP”
“SETIAP ORANG ITU SPESIAL JIKA KAMU TIDAK SETUJU, BERARTI KURANG
PERHATIAN”
vi
DEDICATION
I hereby dedicate this graduating paper for:
1. My beloved parents to be patient and the best parents, I love you so much
2. My little brother, Mahfud and Harun, for being a good and happy children
3. My big family, Bani Harun and Bani Amat Iman, thanks was support me.
4. Mas Irawan Fuadi,S.TH.I thanks for was waiting for me. It was the most beautiful thing I got from Allah.
vii
ACKNOWLEDGEMENT
Allhamdulillahirobbil „alamin, all praises due to Allah, the Most Gracious
and the Most Merciful Bless and the mercy is upon great prophet Muhammad SAW for his guide is from the darkness the lightness.
However, this paper will not be finished without supports, advices, help, and encouragement from some people and the institution. I would like to say thanks to:
1. Dr. Rahmat Hariyadi, M.Pd as the Rector of States Institute for Islamic Studies Salatiga
2. Suwardi,M.Pd, the Dean of Teacher Training and Education Faculty 3. Noor Malihah, Ph.D, the Head of English Education Department 4. Rr. Dewi Wahyu M,S.S.,M.Pd as my counselor.
5. All of the lecturers 6. All of the staff
7. International class program batch 2013 who was accompany me from the first semester. There is no family like them.
8. LPM DinamikA, thanks a bunch make me more and more be adult person 9. The big family of Ma‟had al-Jami‟ah Putri, Drs. Abdul Syukur,M.Si (the
viii
10.SMA Kartika III-1 Banyubiru as my angel in this last project, Mr. Imam Hidayat and his students, just Allah will give you the best thing you want, thanks for the kindness.
Salatiga, September 16th 2017 The writer
ix ABSTRACT
Khoiri, Izzah. 2017. IMPROVING THE STUDENTS‟ READING COMPREHENSION BU USING PICTOGRAM (A Classroom Action Research of the X IPA-2 of SMA Kartika III-1 in the Academic year 2017/2018). AGraduating Paper, Teacher Training and Education Faculty, English Education Department, State Institute for Islamic Studies (IAIN) Salatiga. Counselor: Rr. Dewi Wahyu Mustikasari.,S.S.,M.Pd. Keywords: Pictogram, reading comprehension, classroom action research.
x
TABLE OF CONTENTS
TITLE ...i
DECLARATION ... ii
ATTENTIVE COUNSELOR’S NOTE ... iii
STATEMENT OF CERTIFICATION ...iv
MOTTO ... v
DEDICATION ...vi
ACKNOWLEDGMENT ... vii
ABSTRACT ...ix
TABLE OF CONTENTS ... x
LIST OF FIGURES ... xiii
LIST OF TABLES ...xiv
CHAPTER I INTRODUCTION A. Background of the Study ... 1
B. Problems of the Study ... 5
C. Objectives of the Study ... 5
D. Significances of the Study ... 5
E. Limitation of the Study ... 7
F. Definitions of the Key Terms ... 7
xi CHAPTER II LITERATURE REVIEW
A. Review of Previous Studies ... 9
B. Educational Technology and Other Teaching Equipment ... 11
C. Pictogram ... 12
1. History of Pictogram ... 12
2. Definition of Pictogram ... 13
3. Classification of Pictogram ... 14
4. Advantages of Pictogram ... 16
5. Pictogram as an Aid in Reading ... 17
D. Reading ... 18
1. Definition of Reading ... 18
2. Purpose of Reading ... 19
3. Techniques of Reading ... 19
E. Reading Comprehension ... 20
1. Definition of Reading Comprehension ... 20
2. Components of Reading Comprehension ... 21
3. Levels of Comprehension ... 21
4. Factor Affecting Students on Reading Comprehension ... 22
5. Strategies for Improving Comprehension Skills ... 23
CHAPTER III METHODOLOGY OF THE STUDY A. Location of the Study ... 24
B. Design of the Study ... 24
xii
D. Schedule of the Study ... 25
E. Techniques of collecting the data ... 26
1. Test ... 26
2. Observation ... 27
3. Interview ... 27
4. Documentation ... 27
F. Cycles of Classroom Action Research ... 28
G. Rubric of Reading Comprehension ... 31
H. Techniques of Analyzing the Data ... 32
1. Qualitative Data ... 33
2. Quantitative Data ... 33
CHAPTER IV DATA ANALYSIS A. Findings ... 33
B. Discussions ... 63
CHAPTER V CLOSURE A. Conclusions ... 65
B. Suggestions ... 67 REFERENCES
xiii
LIST OF FIGURES
Figure 2.1 Representational Pictogram ... 14
Figure 2.2 Abstract Pictogram ... 15
Figure 2.4 Descriptive Pictogram ... 16
Figure 2.7 Pictogram as an Aid in Reading ... 17
xiv
LIST OF THE TABLES
Tables 3.1 Schedule of Study ... 25
Table 3.2 Field note of the teacher‟s activities ... 29
Table 3.3 Field note of the student‟s activities ... 30
Table 3.4 Rubric of Reading Comprehension ... 32
Table 4.1 Students‟ score in the pre-test of the cycle 1 ... 46
Table 4.2 Count of Passing Grade of the Pre-Test in the Cycle 1 ... 48
Table 4.3 Students‟ Score in the Post-Test of the Cycle 1 ... 49
Table 4.4 Count of Passing Grade of the Post-Test in the Cycle 1 ... 50
Table 4.5 Difference square of Pre and Post-Test Score in Cycle 1 ... 51
Table 4.6 Students‟ Score in the Pre-Test of the Cycle 2 ... 55
Table 4.7 Count of Passing Grade of the Pre-Test in the Cycle 2 ... 56
Table 4.8 Students‟ Score in the Post-Test of the Cycle 2 ... 57
Table 4.9 Count of Passing Grade of the Post-Test in the Cycle 2 ... 58
Table 4.10 Difference square of Pre and Post-Test Score in Cycle 2 ... 59
1 CHAPTER I INTRODUCTION
A. Background of the Study
Humans need a language to communicate each other. Along with language, human can express the thing to be conveyed and receive well the things put forward. Language is not only as communication, but also as unifying nation.
Language is a city to the building of which every human being brought a stone. Emerson (1876) as cited in Fromkin (2011, p. 430) states that “Language has built by every human‟s contribution”. So that, it is the
responsibility by each people to have an ability on language.
Harmer (2011, p.1) states that “Although English is not the
language with the largest number of native or „first language‟ speaker, it
has become a lingua franca. A lingua franca can be defined as language is
different from each other‟s and where one or both speakers whose native
languages are different from each other‟s and where one or both speakers
are using it as a „second‟ language.” English will become a priority
language in the future. Even, it has just become lingua franca. But, that is
not change anything because finally people use English as unifying
language.
Learning English is very needed for every people in this era.
2
“English is a number of future possibilities, all of which question the
certainty of English as the number one of the world.” As Graddol says, at
the internet and the World Wide Web, Graddol try to remind people that
most of the communication in the internet use English language. It is
clearly enough that English will be common language in the several
aspects such as: economics, geographies, trades, arts, socials, cultures,
educations, etc. People need English language to make transactions even
just a communication. Moreover, as the students, they have to an ability
and capability in English. At least, students can understanding English a
pieces.
Harmer (1989, p.16) states that “English has four languages skills.
They are reading, listening, speaking, and writing. Speaking and writing
include language production, they are productive skills. On the other hand,
listening and reading involve accepting the message, so they are as
receptive skills.” Students have to learn all of the skills above because
government had been arranged the curriculum of English lesson. But, not
all of them are capable in those skills.
One of those skills above is reading skill. According to Elizabeth
(2013, p. 6-7) “Reading is one of the parts of daily activities. People read
many kinds material of written, such as read message, newspaper, book,
magazine, novels, advertisement, and so on. From reading people can get a
lot of information, knowledge, solution, entertain, and so on. To get all the
3
reading actually is the part of daily activity. Without reading, people
cannot understand something around them.
Students also can start to understand English from reading
comprehension. By reading comprehension, students can understand the
idea or the meaning of the text. As Scanlon et al (2010, p. 276) explained
that “Comprehension is an active, constructive process in which the
ultimate understanding of the content is determined by combination of
what is stated directly in the text and the readers‟ knowledge related to the
topic of the text.”
In the fact, several students did not like reading. As the case in the
SMA Kartika III-1 Banyubiru, some students did not like reading because
feel lazy and too tired to read. Even, the other did not know about the
meaning of vocabularies. That made the students does not find anything in
the text. Moreover, SMA Kartika III-1 is one of military school that
prepared them to be an Indonesian National Armed Forces for students
wants to be.
From the explanation above, the teacher has to find some methods
and equipment that suitable with this condition. To solve the problem in
reading comprehension, the writer proposes to use pictogram to improve
students‟ reading comprehension. Pictogram should be applied in teaching
reading to make the students interested in the text. They also will be ready
than before. Therefore, they will have high motivation in learning English
4
Otsubo (1988, p. 536) explains that “Pictogram is a stylized
figurative drawing that is used to convey information of an analogical or
figurative nature directly to indicate an object or to express an idea.”
Another definition by Noble and Bestley (2003, p. 119) states that
“Pictograms as visual communication design are meant to be easily
understood and modernist design movements such as „De Stijl,
Constructivism, and the Bauhaus endeavored to celebrate functionalism
and rationality under the maxim that „form follows function”. Pictogram
has a simple shape but full of meaning. By pictogram, students can express
their idea widely.
Many people who are mentally retarded learn to read simple
“cementing-words” as they read. If pictogram is supplemented with a
number of such words, the text becomes linguistically correct. Falck
(2001, p. 34) suggest “With new functions in “Write with Pictures”,
pictogram inspires those who are mentally retarded to enjoy some exciting
reading.
By the explanation above, the writer tries to solve those problems
by doing classroom action research there. The writer conducts the study
entitled “Improving the Students Reading Comprehension by Using
Pictogram (A Classroom Action Research of the students of X IPA-2 in
5 B. Problems of the Study
Based on the background of the study, there are some problems of the study are as follows:
1. How is the implementation of Pictogram to improve the students‟ reading comprehension of the students of X IPA-2 of SMA Kartika III-1 in the academic year of 20III-17/20III-18?
2. How far is the improvement of the students‟ reading comprehension of the students of X IPA-2 of SMA Kartika III-1 in the academic year of 2017/2018 after being taught by using pictogram?
C. Objectives of the Study
According to the problems above, the objectives of the study are as follows:
1. To describe the implementation of using Pictogram to improve the students‟ reading comprehension of the students of X IPA-2 of SMA
Kartika III-1 in the academic year of 2017/2018.
2. To identify how far the improvement of the students‟ reading comprehension of the students of X IPA-2 of SMA Kartika III-1 in the academic year of 2017/2018 after being taught by using pictogram. D. Significances of the study
This study is expected to be used theoretically and practically: 1. Theoretically
6
it can be used by other writer as a reference for those who want to conduct a study in English teaching and learning process.
2. Practically
The result of this study is expected to be useful for the students, English teachers, and institution:
a. Students
The finding of this study can motivate the students in order to involve them in learning process actively. Another finding is hoped to improve their reading comprehension especially by using pictogram.
b. English teachers
The finding of this study can be a new knowledge for the English teachers in teaching reading comprehension. The writer hopes the teachers know the importance of Pictogram to improve the students‟ reading comprehension. The teachers can improve
their capability through many ways to develop the new methods of language learning to increase the knowledge about reading comprehension.
c. Institution
7 E. Limitation of the Study
In this study, the writer only focuses on the use of pictogram to improve reading comprehension. The aspects of reading comprehension are the completeness of answer, understandable contain, and clear information.
F. Definition of The Key Terms
To avoid misinterpretation and make easy to understand the title of this study, the writer clarify and explain the terms used in this study as follows:
1. Pictogram
“Pictogram is a stylized figurative drawing that is used to convey
information of an analogical or figurative nature directly to indicate an object or to express an idea” (Otsubo , 1998, p.536)
2. Reading Comprehension
Arthur (2007, p. 5-6) states that “Reading is exceptionally performance one of considers the number of levels and component that be mastered. Comprehension is an active process in arrange of meaning. Reading comprehension is a cognitive action that is contextual condition. With the purpose of improve aspect of comprehension.”
G. Graduating Paper Outline
8
9 CHAPTER II
LITERATURE REVIEW
A. Review of Previous Studies
In this study, the writer takes three previous studies from previous researches. Firstly, a graduating paper by Tugiyarti (2016) with the topic: improving students reading comprehension by using Lectora Inspire. This research is aimed to improve the students‟ reading comprehension through Lectora Inspire. Tugiyarti gave the treatment by using Lectora Inspire to the students by two cycle, cyle I and cycle II. Each cycle was containing pre-test and post-test. The result showed that students reading comprehension improves significantly. The T-calculation result showed that T-calculation of cycle I is 4, 87 and T-calculation of cycle II is 9, 69.
10
definitely a way to reach a larger audience, while at the same time altering gameplay enough to be exciting, but not changing the fundamental feeling of console gaming that has been recognized and loved since the 1980‟s.
The last is a dissertation by Scott (201opics 0). Scott use PicTopics (an educational tool presented as a set of card and each card has different pictograph or pictogram) the objectives of this research to find PicTopics could trigger and cultivated storytelling, enable engagement between people and opened communication channels between the educator and students. The writer used pictures of objects and people interpreted in a graphic style that the writer saw every day to facilitate creativity and story-telling, made perfect sense. So that, the writer made his own PicTopics to encourage the reader to use the PicTopics in any way that would be of benefit to learning process. The result were the PicTopics could be used as way to encourage a creative approach to teaching and learning and the cards could play a transformational role. It was demonstrated by the stories documented at the artSpace Gallery, and by the storied performances of the DUT drama students.
11
B. Educational Technology and Other Teaching Equipment
Harmer (2011, p. 134) said that a language teachers used a variety of teaching language to understand the meaning or the construction, made the students feel interested in the whole activity. Some of that variety could be helpful both for practical and for motivational reasons, such as: 1. Pictures and images
Students were already familiar with some pictures in their daily activity. So that, the teachers could use picture or image to use in the teaching language. The picture or image could take from books, newspapers and magazines, or photographs. Picture also could be in the form of flashcards (a card that made the students easy to learn), large wall pictures (another picture with more big size), cue cards (a small cards that could be used by pairwork), photographs, or illustrations (typically in a textbook). Furthermore, images could be from slides or drawn by the teacher at the white board.
Another picture or image could be a pictogram. Because Fromkin (2011, p. 542) explained that “Pictograms are clearly „picture writing‟.
Unlike modern writing systems, each picture or pictogram is a direct image of the object it represents.” By pictogram, students actually
12 writing were the early drawings made by ancient humans, cave art, called petroglyphs, such as those found in the Altamira cave in northern Spain, created by humans living more than 20.000 years ago, can be „read‟ today” (Fromkin, 2011, p.542)
Meanwhile, people were not using pictogram at the time. They need a process to arrive in the pictogram era. Abdullah and Hubner (2006) as cited in Scott (2011, p. 62) said that the system of pictograms developed by Viennese educator and philosopher Otto Neurath (1882-1945) and illustrator Gerd Armtz (1900-1988) was developed as the International System of Typographic Picture Education (ISOTYPE).
According to Paramita (2011, p.2) “The first used of
13
that, pictogram was used for make the communication easier. Lupton (1989) as cited in Scott (2011, p. 63) stated that Neurath hoped to establish a “global standard for education and to unite
humanity through one ordered, universality readable language of vision. Furthermore, the use of pictogram was advanced by degrees.
2. Definition of Pictogram
There are many definitions of pictograms like Abdullah and Hubner (2006) as cited in Scott (2011, p. 63) said that pictogram is a pictorial representations, ISOTYPE, an iconic sign which represents complex facts through visual carriers of meaning. Pictograms are used to warn, guide, or protect and need to be immediately decipherable. According to Noble and Bestley, (2003, p.119) “Pictograms as visual communication design are meant to be easily understood and modernist design movements such as „De Stijl, Constructivism, and the Bauhaus endeavored to celebrate functionalism and rationality under the maxim that „form follows
function”. Although pictogram contained some complex meaning,
it has a simple shape until used in the daily activity. It means that pictogram was very easy to understand by the people.
14
From that explanation, it can conclude that pictograms are one of the ways to communicate each other by using picture or symbol which has a meaning.
3. Classification of pictograms
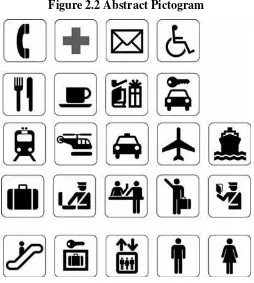
Pictogram has some classification that provided by Dreyfus as cited in Davies et al (1972, p. 6) Collect and reviewed twenty thousand graphic symbols and developed three categories, such as: representational, abstract, and arbitrary. But, this study just used representational and abstract.
a. Representational
Representational is a simple pictogram that contains of picture or symbol briefly. It was used to representation of the objects.
Figure 2.1 Representational Pictogram
Source: www.conceptdraw.com b. Abstract
15
elements to inform the message into graphic terms. Abstract showed a resemblance of activity.
Figure 2.2 Abstract Pictogram
Source: www.raleighgreeninc.com
Pictogram not only has a classification, but also content of a sign. Easterby and Hakiel (1977) as cited in Davies, et, al (1972, p. 6) described:
a. Descriptive
16
Figure 2.4 Descriptive Pictogram
Source: www.conceptdraw.com
4. Advantages of Pictogram
Pictogram has some advantages in the daily activity according to Ismagilova. The writer use some advantages related to the study such as:
a. Pictograms are the more quickly and accurately interpreted than words. By using pictogram, students could translate the meaning to their own language. Because some of them did not understand every vocabulary they got.
b. Pictograms could improve understanding of warnings by visual or literacy difficulties.
c. Pictograms could compare by textual information to make the readers‟ understanding easily. In this study, the writer compared the text and pictogram to build the students‟ reading
17
5. Pictogram as an Aid in Reading
Many people who are mentally retarded learn to read simple “cementing-words” as they read. If pictogram is supplemented with a
number of such words, the texts becomes linguistically correct. Falck (2001: 34) suggested “With new functions in “Write with Pictures”, pictogram inspires those who are mentally retarded to enjoy some exciting reading”. It means that pictogram could compare by the
information text as an aid in reading. The writer applied this way in the treatment and post-test of cycle 2. The writer compared pictogram and narrative text.
Figure 2.7 Pictogram as an Aid in Reading
18
skills, listening, speaking, and writing. Specially, reading is a process of reconstructing from the printed pattern on the page, ideas, and information intended by author”. Even, reading became a part of daily
activity. So that, students has to be able to read anything around them. Harmer (2001, p. 68) explained “Reading is useful for other purpose too: any exposure to English (present the students understand it more or less) is a good thing for language pupils. Reading text also provides good models for writing, and the opportunities to study language: vocabulary, grammar, punctuations, the way make sentences, paragraph, and text”. The explanation means that reading was important in the several of sector.
“Reading is also a language and communication process, it means
19
window of the world. It is process to understand the text even the structure, the semantic, and the pragmatic of the sentences.
2. Purpose of Reading
Reading has several purpose according to Grabe (2009, p. 8-10). There are several purpose related with this study such as:
a. Reading for information
Students actually search information by reading. Sometimes students understand what they looking for but the other was not. b. Reading to learn
Another purpose of reading was to learn. Students read the text then answered the question. They try to remember the main ideas and pull down the information as needed.
c. Reading for general comprehension
Reading for general comprehension is the most general purpose for reading range from fluent readers, and it is the dereliction judgments for the term reading comprehension
d. Techniques of Reading
There was several technique of reading by Wright (1989, p.159). In this study, the writer use:
a. Intensive reading
20 E. Reading Comprehension
1. Definition of Reading Comprehension
“Reading comprehension involves abilities to recognize words
rapidly and efficiently, develop, and use a very large introduction vocabulary, process sentence to build comprehension, use a row of strategic process and underlying cognitive skills, interpretation meaning in relation to background knowledge, and evaluate texts in line with the reader goals, and process texts fluently” (Grabe, 2009, p. 8). Reading comprehension was a series of process to make the readers understanding well. By reading comprehension, students not only get the information but also understand the text.
According to Scallon et al (2010, p. 276), “Comprehension is an active, constructive process in which the ultimate understanding of the content is determined by combination of what is stated directly in the text and the readers knowledge related to the topic of the text.” It means that comprehension was mastered all of the meaning even the topic outside related by the text.
21
understand the meaning of the larger idea. From the explanation above, it can be concluded that reading comprehension was a phase to build an understanding of idea that can express it by the readers‟ language and give some benefits for others.
2. Components of Reading Comprehension
Some of componets of reading comprehension by Davis as cited in Heilman et al (1961, p. 241) become five skills. The component used by the writer such as:
a. Recalling word meaning (vocabulary knowledge)
The writer was recalling word meaning in the treatment of cycle 1 and 2. Even, several question related to the material also used.
3. Levels of Comprehension
The readers may have different types or levels of thinking. Following to Heilman, Blair, and Rupley (1961, p. 246), there are three levels of comprehension. The writer used the levels of comprehension in this study such as:
a. Literal Comprehension
Literal comprehension is an understanding the ideas and information clearly whole in the passage. The abilities are following:
22
2) Recall of details directly stated and paraphrased in own words.
3) Considering of main idea explicitly stated.
4) Ability of ordering information presented in passage.
This study was focused in the literal comprehension. It was the based levels of comprehension because the ability of the students was appropriate with this level.
4. Factor Affecting Students on Reading Comprehension
The teachers have to understand the factors that influence comprehension. So that, Dallman, et al (1982, p. 25) stated that there were some factor affecting students on reading comprehension. But the factor influenced this study such as:
a. Difficulty of material
The students always thinking that the material gave by the teacher are difficult. That was why the students pessimistic to read the material
b. Intelligence
Some of intelligence among students was different. It made the ability of reading the text was different too.
c. Environment
Environment absolutely influenced the reading comprehension each students.
23
5. Strategies for Improving Comprehension Skills
Many strategies can be used effectively to develop comprehension skill. Some are important to build background, others useful for teaching the technical comprehension skills, and overcoming specific difficulties.
There are general principles of instruction which can be used as guides in implementing programs to develop the abilities which make up the specific skills of comprehension. Following to Kennedy (1984, p. 197-198), there are the strategies that could be used profitably in most classroom. But in this study, the writer used:
a. Providing practice in reading easy material
Practice is the best facility to development comprehension. Systematic exercise should involve reading materials that are within the experience and achievement formation of reader. The writer used practice in the easy material. According to the writer, pictogram was the practice and easy material to be applied in this study.
24 CHAPTER III
METHODOLOGY OF THE STUDY
A. Location of the study
The writer conducted classroom action research in SMA Kartika III-1 Banyubiru. It is a military school. It is located on Jl. Raya Muncul KM 4 Banyubiru, Semarang. Now, the total number of students of SMA Kartika III-1 in academic years of 2017/2018 is 482 students from two majors: IPA and IPS. The headmaster of this school is Dra. Winarni.
B. Design of the Study
In this study, the writer used classroom action research. There were some definitions of action research from experts. According to Watt (2007, p.1) as cited in Paizaluddin and Emalinda (2014, p.8), “Action research is a process in which participants their own
educational practice systematically and carefully using the techniques of research.” Lodico, et al (2006, p.282) as cited in Wijaya (2016, p. 45) stated “Action research is research conducted by practitioners in
25
in the class. To implemented classroom action research, teacher and participant need to work together.
C. Subject of the Study
The study was applied for the students of second year of the students of X IPA-2. There were 32 students in total. Based on the writer‟s observation, this class has low score in English term,
especially in reading comprehension. The students have some difficulties to understand how to read and how the teacher used Bahasa to explain English lesson.
D. Schedule of the Study
The classroom action study was started from July 2017 and finished on September 2017. The schedule of study can be explained in the table below:
Tables 3.1 Schedule of Study
No. Activities Date Facilitator
1. Interviewed the students and the teacher to find problems that happen in
the class.
July, 2017 The writer
2. Conducted pre-test for cycle 1
August, 2017 The teacher
3. Gave treatment and conducted post-test for
cycle 1
August, 2017 The teacher
26 5. Gave treatment and
conducted post-test cycle 2
September, 2017 The teacher
E. Techniques of Collecting Data
To carry out the study, the writer had several techniques of collecting the data. The techniques of collecting the data could be test, observation, interview, and documentation. In this study, the writer used test as the main method and observation to get the data.
1. Test
a. Pre-Test
Before conducting the cycle 1 and cycle 2, the writer give the pre-test for each cycle. The purpose tried to know the reading comprehension of the students before they got treatment in the cycle 1 and cycle 2. The students needed to answer the question based the text. The writer observed the pre-test to get data analysis.
b. Post-Test
27
students‟ reading comprehension after they were given
treatments.
2. Observation
According to Kothari (as cited in Wijaya, 2016, p. 48) has argue that “The observation method is the most commonly used
method especially in studies relating to behavioral sciences.” Therefore, in this study, the writer observed the study using observational checklist. The writer collaborate the study with the observer. There two kinds of observational checklist. Those were observational checklist for the teacher and students.
3. Interview
The writer used interview method to know the problems and the issues happening in the class. Before conducting classroom action research, the writer interviewed the students as well as the teacher to look for the problems.
4. Documentation
28
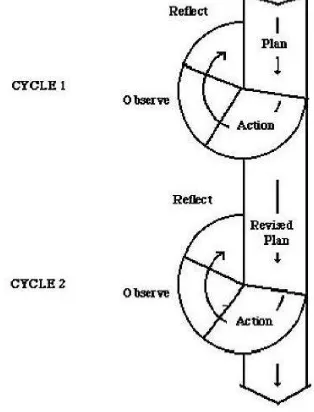
F. Cycles of Classroom Action Research
According to Kusuma and Dwigatama (as cited in Tugiyarti 2016, p. 37) , “Classroom Action Research is research that doing by teacher in their classroom with the method planning, implementation, and reflection the action in a collaborative and participative with the purpose to repair their work as a teacher, so can improve the student achievement in learning.”
The writer organized the research in two cycles, cycles 1 and cycles 2 have similar steps. There were four steps in every cycle:
1. Planning
The writer was needed to draw up instrument which is support in teaching learning process, as:
a. Made schedule of the action research.
b. Prepared material and lesson plan.
c. Designed the steps doing the action.
d. Made an observation sheet.
e. Made Pre-Test and Post-Test to each cycle.
f. Prepared list of the students‟ name and scoring.
2. Action
29
b. Studied English lesson in reading by using Pictogram.
c. Gave Post-Test.
3. Observation
Observation is implementation of observation by the writer. In the observation, the writer was analyze the result of the cycles before, and analyze the result of exercise to detect whether the students‟ reading comprehension improve or not.
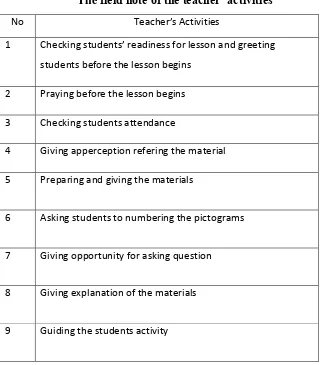
Table 3.2
The field note of the teacher’ activities
No Teacher’s Activities
1 Checking students’ readiness for lesson and greeting
students before the lesson begins
2 Praying before the lesson begins
3 Checking students attendance
4 Giving apperception refering the material
5 Preparing and giving the materials
6 Asking students to numbering the pictograms
7 Giving opportunity for asking question
8 Giving explanation of the materials
30
10 Giving feedback after the lesson
11 Giving motivation for students
12 Asking students to summarize the lesson
13 Informing next material for next meeting
14 Closure
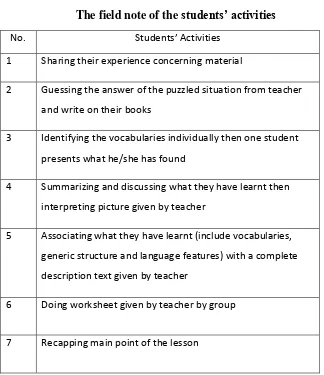
Table 3.3
The field note of the students’ activities
No. Students’ Activities
1 Sharing their experience concerning material
2 Guessing the answer of the puzzled situation from teacher and write on their books
3 Identifying the vocabularies individually then one student presents what he/she has found
4 Summarizing and discussing what they have learnt then interpreting picture given by teacher
5 Associating what they have learnt (include vocabularies, generic structure and language features) with a complete description text given by teacher
6 Doing worksheet given by teacher by group
31 4. Reflecting
The writer proposes once again what has done. Explained what happened in observation and that evaluated, whether the method can be problem solving to improve reading
comprehension.
Figure 3.1 Cyclical Action Research model based on Kemmis and McTaggart (1998).
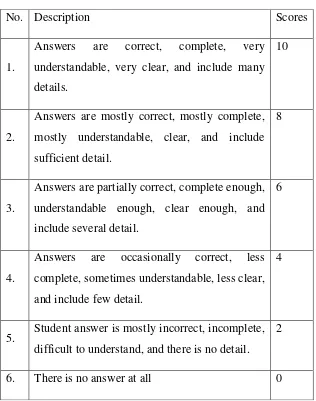
G. Rubric of Reading Comprehension
32
reading comprehension in term of general understanding. The rubric of reading comprehension is presented below.
Table 3.3 Rubric of Reading Comprehension
H. Techniques of Analyzing Data
In this study, the writer used mixed-methods. It used qualitative and quantitative research. According to Lodico, Spaulding, and Voegtle (2006, p. 282), “Mixed-methods research design are approaches involving well-developed procedures for collecting and
No. Description Scores
1.
Answers are correct, complete, very understandable, very clear, and include many details.
10
2.
Answers are mostly correct, mostly complete, mostly understandable, clear, and include sufficient detail.
8
3.
Answers are partially correct, complete enough, understandable enough, clear enough, and include several detail.
6
4.
Answers are occasionally correct, less complete, sometimes understandable, less clear, and include few detail.
4
5. Student answer is mostly incorrect, incomplete, difficult to understand, and there is no detail.
2
33
analyzing both quantitative and qualitative data that are used primarily by the professional researchers and program evaluator.” Therefore, this study used qualitative and quantitative methods. The writer got the total of number data from quantitative method and informed the reason of the quantitative data by using qualitative method.
1. Qualitative Data
According to Kothari (2004, p.3), “Qualitative research is especially important in the behavioral sciences where the aim is to discover the underlying motives of human behavior.” By
qualitative data, this study was represented the result of the study. 2. Quantitative Data
To measure the data quantitatively, the writer used the following formulas:
a. Mean of Pre-test and Post-test
M =
Explanation:
M = Mean of the students‟ score
∑X = Sum of the students‟ score
N = Total number of the students.
34 MD =
Explanation:
MD = Mean of Difference
∑D = Total of difference between pre- and post-test
c. Standard Deviation Calculation
SDD = 2
Explanation:
SDD = Standard Deviation
D = Difference between pre- and post-test
N = Number of the students
d. Standard error for the mean difference
SEMD =
Explanation:
SEMD = The standard error for the mean difference.
SDD = Standard Deviation.
35 d.f = N-1
e. Looking for T0 by using the following formula:
T0 =
Explanation:
t0 = MD / SEMD
T0 = T-test
MD = Mean of difference
SEMD = Standard error of mean difference
d.b. = N-1
36
CHAPTER IV
FINDINGS AND DISCUSSION
A. Findings
1. Implementation of using pictogram to improve the reading comprehension of the students X IPA-2 of SMA Kartika III-1 Banyubiru
In this chapter, the writer would like to analyze the data from the action study activities. The data was obtained from teaching learning process and evaluation. The data analysis was function to measure improving the students‟ reading comprehension by
“Pictogram”.
In this study, the data consisted of the field note, result of pre-test and post-pre-test. There were two cycles in this study, cycle I and cycle II. For the whole stages of each cycle is explained in the description below:
a. Cycle 1
1) Planning
37
sheets of the lesson plan and syllabus. The writer also discussed the lesson plan with the teacher to improve the quality, validated the lesson plan and the syllabus with the teacher, prepared observation sheet to observe the teacher and the students activities, prepared camera for documentation, prepared the students attendance list as well as the students scoring list.
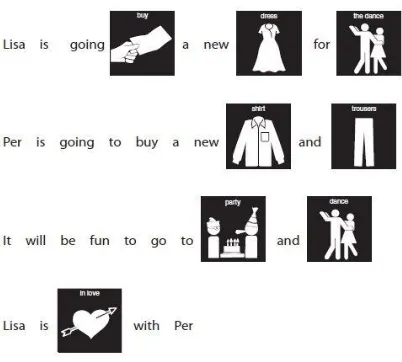
The writer used “The Four Season” text and the pictogram. The teacher would assess the students from the completeness, understandable, very clear, and include many details at the answer. The range of the score was 0-10 each number. The text used in the pre-test was descriptive text of “Huntington Beach California”. Meanwhile, the text used in the
post-test was “Safari Park” and “Taj Mahal” descriptive text.
2) Implementation of the action
The cycle 1 started from 23, 28, 30 July 2017. This cycle divided into three parts. The first parts, the writer conducted test on 23 July 2017. The text used in the pre-test was “Huntington Beach California”. The writer gave the
text and the question.
38
greeting the students, the teacher was not leading the students to pray because the lesson in the middle of the day, not in the morning. The teacher also was not checking the students‟ attendance list because already checked by previous teacher. Then, teacher was giving apperception referring the material by asking question and some students trying to answer it.
After that, the teacher was prepared and gave the material about pictogram by descriptive text. First, the teacher explained about descriptive text, generic structure, and the language features, and Wh question. Then, teacher discussed the descriptive text by using pictogram entitled “The Four
Season”. Teacher showed several pictograms as represented the
text and the students try to guess the number. After they discussed about the pictograms, teacher discussed the text and gave the question about descriptive text to the students as several groups.
39
In the end of meeting, teacher gave feedback related to the material and discussed it with the students. Meanwhile,
The writer observed the teacher as well as the students. The writer observed the teacher activities about how he applied the lesson plan and the student‟s activities were also observed. The data of observation were recorded in the field notes. There were so many aspects of the teacher activities which were observed by the writer such as checking students‟ readiness for
lesson before beginning the teaching and learning process, giving apperception referring the material, preparing and giving the materials, asking students to numbering the pictograms (Picture and picture method), giving opportunity for asking question, giving explanation of the materials, giving feedback after the lesson, and informing next material for next meeting.
There were also so many aspects of the students‟
40
the puzzled situation from the teacher and writing on their books, summarizing and discussing what they have learnt then interpreting picture given by teacher, associating what they have learnt (include vocabularies, generic structure, language features) with a complete description text by teacher, and doing worksheet given by teacher by group. For more complete data about the field notes in the cycle 1, the writer had already attached it in in the appendix.
4) Reflection
The teacher along with the writer reflected the lesson plan and the action. The students‟ score and the field notes
were used to make proper reflection. The passing grade (KKM) for English subject is 75 but the students‟ scores of the post-test
show that there only 54% of the students who get score higher than KKM. In the pre-test, the students‟ scores show that there are 9,4% or less than 10% of the students who get score higher than KKM. It means that although there is an improvement, the writer and the teacher have to conduct the next cycle because there must be at least 75% of the students who get score higher than KKM.
After analyzing the students‟ score, the students‟
41
writer found that there was improvement on general understanding as well as accuracy in the students‟ answers of
the post-test but the teacher and the writer also got reflection that the students who got score lower than 75 in the post test were still confused in answering questions. They did not understand well about how to answer completely, the meaning of the question, and lack of vocabularies. Students also not had given yet a guiding very well. That was why their answers in the post-test were not complete or not detail.
The teacher along with the writer produced reflection. The teacher had to add additional activities in lesson plan to overcome those problems. The first additional activity was explaining to the students how to answer completely. The teacher also had to give explanation to the students about the meaning of the questions which were contained in the post-test. The second activity was discussing some vocabulary related the materials. For next cycle, the teacher along with the writer had changed the method.
b. Cycle 2
1) Planning
42
prepared the pre-test and the post-test for the cycle 2 based on the indicators of the lesson plan, prepared validation sheets of the lesson plan and the syllabus. The researcher also discussed the lesson plan with the teacher to improve its quality, validated the lesson plan and the syllabus with the teacher, revised the observation sheet to observe the teacher and the students‟ activities, prepared camera for documentation,
prepared the students attendance list as well as the students scoring list.
The teacher and the writer changed the new text and the new method for the cycle 2. The text is narrative text entitled “The Gingerbread man”. In this cycle, the teacher used reading
method. Then, the teacher had chosen the students to read the text one by one. In that text, students try to read and understand pictogram very well.
2) Implementation of the Action
43
faced by the students in the post-test of the cycle 1. They could not answer the questions completely.
The action in the cycle 2 was implemented on 27th 2017. After checked students‟ readiness for lesson and started the meeting before the lesson, leading the students to pray together, checked students‟ attendance, and gave apperception referring the material. The students also shared their experience related with the material.
After that, the teacher prepared and gave the materials by power point presentation (PPT) and sound system. Then, the teacher asked students to reading the text randomly, in the middle of discussing the text, the teacher played the audio related the text in order to make the students can hear the pronunciation clearly.
The next activity gave opportunity to the students for asked question. Some students feel interested to ask the meaning of pictogram in the text. Then the teacher gave explanation related to the question. After that, the teacher gave some question related to the text and guides the students‟
activity.
44
lesson but the teacher also informed next material for the next meeting. The last, the teacher dismissed the class by praying together.
3) Observation
The writer observed the teacher as well as the students. The writer observed the teacher activities about how he applied the revised lesson plan and the students‟ activities
45
There were also many aspects of the students‟
activities which were observed by the writer such as answered the greetings, prayed together, shared their experience concerning material. The students also guessed the answer of the puzzled situation from teacher and write on their books. After that, they identify the vocabularies individually then one student presents what he/ she have found. After that, they also read the text given by the teacher, associated what they have learnt (include vocabularies, generic structure, and language features) with a complete description text given by teacher, guessed the meaning of pictogram in the text, do worksheet by group, and recapped main point of the lesson.
4) Reflection
The teacher along with the writer reflected the revised lesson plan and the action of the cycle 2. The students‟ score and the field notes were used to make proper reflection. The passing grade (KKM) for English subject is 75. The students‟ scores in the post-test of the cycle 2 showed that there are 86 % of the students who get score higher than KKM. The students‟
46
the students who get score higher than KKM. It means that, after reflection from the cycle 1 was applied in the acting of the cycle 2, the students‟ scores improve as many as 45% in the post-test of the cycle 2. The teacher and the writer stop the cycle because 86% of the students have already passed the passing grade
2. Improvement of the students’ reading comprehension by using
pictogram.
The teacher and the writer gave score to the students based on the rubric of reading comprehension. Each answer of a question was given point. The highest point was 10 point and the lowest point was 0 point. The writer and the teacher processed those scores mathematically and statistically to ensure whether the use of pictogram to improve the students‟ reading comprehension or not.
Those score are presented as follows:
a. Cycle 1
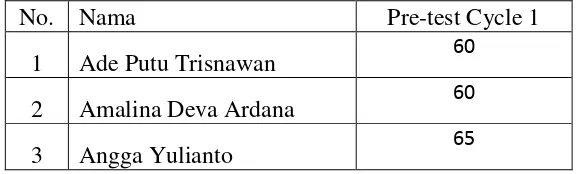
1) Pre-test
Table 4.1 Students’ score in the pre-test of the cycle 1
No. Nama Pre-test Cycle 1
1 Ade Putu Trisnawan 60
2 Amalina Deva Ardana 60
47
4 Anung Syarif Hidayat 70
5 Bungsu Satrio Wibowo 60
6 Devrio Andree Saputra 75
7 Dhio Adhi Santosa 75
8 Endra Julianto 81
9 Fariz Rahmanda Fitrah 75
10 Feri Febrianto 69
11 Garis Natas Pamungkas 68
12 Ilham Nascha 75
13 Isha Sahrul Mahendra 77
14
21 Nuning Rahayuningtyas 60
22 Nur Arifin 77
23 Nur Janah 60
24 Prasetyo Ginanjar 65
25 Rafy Abrian Tamtomo 60
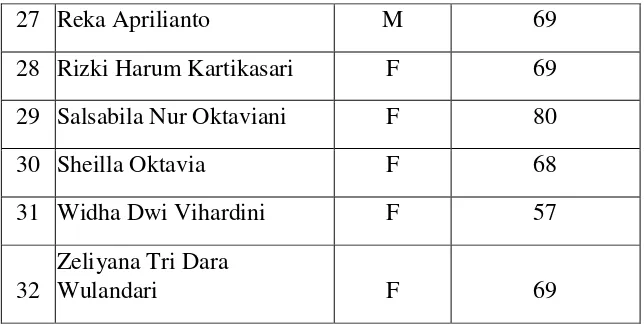
26 Ramadhany Ade T. P. 60
27 Reka Aprilianto 59
28 Rizki Harum Kartikasari 58
29 Salsabila Nur Oktaviani 60
48
31 Widha Dwi Vihardini 60
32
Zeliyana Tri Dara
Wulandari 55
From the students‟ score in the pre-test of the cycle 1 above,
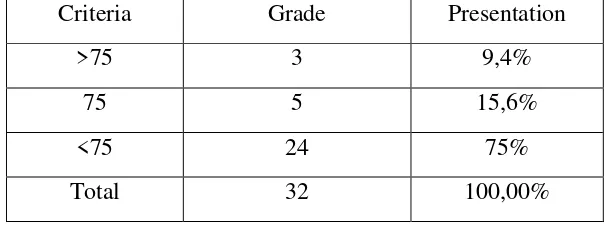
the writer and the teacher can calculate the number of the students who passes the passing grade. It can be seen on the table 4.2.
Table 4.2 Count of Passing Grade of the Pre-Test in the Cycle 1
Criteria Grade Presentation
>75 3 9,4%
75 5 15,6%
<75 24 75%
Total 32 100,00%
From the data above, the writer and teacher know that there was only 9,4% of the students who get score higher than the passing grade. The passing grade of English lesson in SMA Kartika III-1 Banyubiru is 75. The teacher and writer expect that there at least 75% of the students who pass the passing grade. Therefore, the presentation of the passing grade in the pre-test of the cycle 1 was not achieved.
2) Post-Test
Table 4.3 Students’ Score in the Post-Test of the Cycle 1
50 students who passes the passing grade. It can be found on the table 4.4.
Table 4.4 Count of Passing Grade of the Post-Test in the Cycle 1
Criteria Grade Presentation
>75 17 54%
75 3 9,5%
<75 12 37,5%
Total 32 100,00%
51
many as 44,5% of the students pass the passing grade. Then, the teacher and the writer conducted the cycle 2.
3) Calculation of Mean
Table 4.5 Difference square of Pre and Post-Test Score in Cycle 1
52
5) Mean of the Post-Test
M =
=
53
In the cycle 1, the mean of the pre-test is 71, 28 and the mean of the post-test is 75, 93. It means that the mean of the post test is bigger than the mean of pre-test. It can be concluded that there is significant improvement of the students‟ reading
comprehension after being taught by using pictogram. 6) Calculation of the Mean of Difference
MD =
=
=
10, 97) Calculation of the Standard Deviation
SDD = 2
= 2
= 2
=
= = 6, 86
8) Standard Error for the Mean Difference
SEMD =
54
=
=
= 4,03
9) Calculation of T-test
T0 =
=
= 2, 7
From the data of the cycle 1 above, the writer and teacher found that the T-test is 2, 7 and the T-table with N-1 is 2,039. The significant level was 5%. Therefore, the teacher and writer conclude that the result of the cycle 1 is really significant. However, the teacher and writer conducted the cycle 2 because the students who passed the passing grade were less than 75%.
b. Cycle 2 1) Pre-Test
Table 4.6 Students’ Score in the Pre-Test of the Cycle 2
No. Nama Score
55
2 Amalina Deva Ardana 68
3 Angga Yulianto 78
4 Anung Syarif Hidayat 58
5 Bungsu Satrio Wibowo 60
6 Devrio Andree Saputra 78
7 Dhio Adhi Santosa 75
8 Endra Julianto 58
9 Fariz Rahmanda Fitrah 60
10 Feri Febrianto 85
11 Garis Natas Pamungkas 60
12 Ilham Nascha 60
13 Isha Sahrul Mahendra 78
14 M. Sugeng Bagus Mahendra 75
15 M. Eka Nur Surahman 73
21 Nuning Rahayuningtyas 76
22 Nur Arifin 78
23 Nur Janah 78
24 Prasetyo Ginanjar 70
25 Rafy Abrian Tamtomo 55
26 Ramadhany Ade T. P. 73
27 Reka Aprilianto 85
56
29 Salsabila Nur Oktaviani 76
30 Sheilla Oktavia 68
31 Widha Dwi Vihardini 75
32 Zeliyana Tri Dara Wulandari 50
From the students‟ score in the pre-test of the cycle
2 above, the writer and teacher can calculate the number of the students who passes the passing grade. It is as follow on table 4.7
Table 4.7 Count of Passing Grade of the Pre-Test in the Cycle 2
Criteria Grade Presentation
>75 13 40,6%
75 3 9,4%
<75 16 50%
Total 32 100,00%
57
the passing grade. Therefore, the presentation in the pre-test of the cycle 2 is not achieved.
2) Post-Test
Table 4.8 Students’ Score in the Post-Test of the Cycle 2
No. Nama Score
1 Ade Putu Trisnawan 70
2 Amalina Deva Ardana 86
3 Angga Yulianto 85
4 Anung Syarif Hidayat 74
5 Bungsu Satrio Wibowo 94
6 Devrio Andree Saputra 88
7 Dhio Adhi Santosa 75
8 Endra Julianto 96
9 Fariz Rahmanda Fitrah 73
10 Feri Febrianto 88
11 Garis Natas Pamungkas 75
12 Ilham Nascha 85
13 Isha Sahrul Mahendra 100
14 M. Sugeng Bagus Mahendra 80
15 M. Eka Nur Surahman 100
58
22 Nur Arifin 85
23 Nur Janah 100
24 Prasetyo Ginanjar 85
25 Rafy Abrian Tamtomo 75
26 Ramadhany Ade T. P. 88
27 Reka Aprilianto 90
28 Rizki Harum Kartikasari 86
29 Salsabila Nur Oktaviani 84
30 Sheilla Oktavia 88
31 Widha Dwi Vihardini 75
32 Zeliyana Tri Dara Wulandari 80
From the students‟ score in the post-test of the cycle
2 above, the writer and teacher can calculate the number of students who passes the passing grade. The following table informed it.
Table 4.9 Count of Passing Grade of the Post-Test in the Cycle 2
Criteria Grade Presentation
>75 25 79%
75 4 12%
<75 3 9%
Total 32 100,00%
pre-59
test of the cycle 2 is 40,6% and the presentation for the post-test of the cycle 2 is 79%. It means that the expectation was successfully achieved. Therefore, the teacher and writer did not need to conduct the next cycle.
3) Calculation of Mean
Table 4.10 Difference square of Pre and Post-Test Score in Cycle 2
11 Garis Natas Pamungkas 60 75 15 225
60
19 Najwa Azizatun N. 75 88 13 169
20 Nawa Safira 80 88 8 64
21 Nuning Rahayuningtyas 76 90 14 196
22 Nur Arifin 78 85 7 49
28 Rizki Harum Kartikasari 50 86 36 1296
29 Salsabila Nur Oktaviani 76 84 8 64
30 Sheilla Oktavia 68 88 20 400
31 Widha Dwi Vihardini 75 75 0 0
32
Zeliyana Tri Dara
Wulandari 50 80 30 900
Total 1 1 D D2
5) Mean of the Post-Test
M =
61 = 85, 84
In this cycle 2, the mean of the pre-test is 70, 09 and the mean of the post-test is 85, 84. It means that the mean of the post-test is bigger than the mean of the pre-test. It can be conclude that there is a significant improvement of the students‟ reading comprehension after being taught by using
pictogram.
6) Calculation of the Mean of Difference
MD =
=
=
15, 757) Calculation of the Standard Deviation
SDD = 2
= 2
= 2
=
= = 4, 9
8) Standard Error for the Mean Difference
62 =
=
=
= 2, 88
9) Calculation of T-test
T0 =
=
= 5, 46
From the data of the cycle 2 above, the writer and teacher found that the T-test was 5, 46 and the T-table with N-1 is 2, 039. The significant level is 5%. The value of T-test is bigger than the value of the T-table. Therefore, the writer and teacher conclude that the result of the cycle 2 is really significant. Finally, the teacher and writer successfully conduct this research. It also means that pictogram could improve the students‟ reading comprehension of the students of X IPA-2 of
63 B. Discussions
After analyzing the students‟ score in the cycle 1 and
the cycle 2, the writer conclude that there was significant improvement of the students‟ reading comprehension by using
pictogram. The improvement can be seen as follows: Table 4.11 Table of Data Analysis
No. Analysis Cycle 1 Cycle 2
64
Based on the result above, the writer concludes that using pictogram can improve the students‟ reading comprehension. It supported the theory of Scott (2010, p. ii) that “PicTopics enable engangement between people and
65
CHAPTER V
CLOSURE
A. Conclusion
1. Implementation of using pictogram to improve students’ reading comprehension at the X IPA-2 of SMA Kartika III-1 Banyubiru.
After conducted this research, the writer conclude that the implementation of using pictogram to improve the students‟ reading comprehension at the X IPA-2 SMA Kartika III-1 Banyubiru was successful. Using pictogram can improve the students‟ reading
comprehension. It can be seen from their scores of the pre-test and the post-test. In the cycle 1, the writer and the teacher got reflection that some students did not understand about Wh question and how to answer it, they also did not well understand about the meaning of each question in the test. They had lack vocabularies to answer the questions. They also did not understand yet the meaning of pictogram. After those reflections were applied in the acting of the cycle 2.The improvement of the students‟ reading comprehension become much
better.
66
passing grade (KKM) improvement much better because it was helped by the reflection from the cycle 1.
2. Improvement of the students’ reading comprehension after being
taught by using pictogram.
After analyzing the students‟ score in each cycle, the writer
concludes that there was significant improvement of the students‟ reading comprehension after taught by using pictogram.
In the cycle 1, the mean of the pre-test is 65, 46 and the mean of the post-test is 75, 93. The number of the students who pass the passing grade (KKM) in the pre-test is 9,5%. In the post-test 54% of the students successfully pass the passing grade. The mean of post-test is higher than the mean of the pre-post-test. It means that there is significant improvement. In this research, the writer uses the significant level as many 5%. The value of T-table is 2,039. After calculating the students‟ score, the writer finds that the value of T-test
67 After calculating the students‟ score, the writer finds that the value of
T-test is 5, 4 the value of T-test is higher than T-table. Moreover, the writer finds that the value of the T-test in the cycle 2 is higher than the value of T-test in the cycle 1. Moreover, the writer concluded that using pictogram can improve the students‟ reading comprehension of the students of X IPA-2 of SMA Kartika III-1 Banyubiru. Finally, the writer stops the cycle because the numbers of the students who pass the passing grade are more than 75%.
B. Suggestions
Based on the classroom study result, the writer would be like to give some suggestions:
1. To the teacher
68
in the classroom. Moreover, using pictogram in teaching and learning process is very easy to be applied. Teachers can get pictogram easily in the books or internet.
2. To the student
The students can use pictogram to improve their reading comprehension. By using pictogram, readings feel interesting and more understanding. Students can understand the meaning although did now understand the vocabulary.
3. To the other writer
The writer suggests the other writer to conduct classroom action research about the use pictogram to improve students‟ reading comprehension. It can be in term of speaking
REFERENCES
Edition). New York: CBS College Publishing.Davies. S. Haines, H M., Norris, B. J. (2000). The Role of Pictograms in the Conveying of Consumer Safety Information. Nottingham: University of Nottingham.
Dechan, V. (1982). Improving The Teaching Reading: Third Edition. New Jersey: Prentice Hall.
Pang, S. Elizabeth. (2013). Teaching Reading International. Academic of Education.
Falck, Kerstin. (2001). The Practical Application of Pictogram. Swedish: Institute for Special Needs Education.
Fromkin., V. Rodman., R. Hyams., N. (2011). An Introduction to Language 9e. Boston: Wadsworth Cengage Learning.
Grabe, William. (2009). Reading in A Second Language (Moving Fro Theory To Practice). Cambridge: Cambridge University Press.
Harmer, J. (2011). The Practice of English Language Teaching: Third Edition. London: Longman.
Heilman. Blair. Rupley. (1961). Principle and Practices of Teaching Reading. Ohio: Charles E. Merrill Publishing Co.
Kennedy, Edie c. (1981). Methods in Teaching Development Reading: Second Edition. New York: F.E Peacock Publishers,Inc.