Statistik Peterna kan da n Keseha tan Hewa n 2015
STATISTIK PETERNAKAN DAN KESEHATAN HEWAN 2015
Livestock and Animal Health Statistics 2015
ISBN : 978-979-628-031-5
Ukuran Buku : 21 x 29,7 cm
Jumlah Halaman : 238 Halaman
Penerbit :
Direktorat Jenderal Peternakan dan Kesehatan Hewan
Statistik Peterna kan da n Keseha tan Hewa n 2015
KATA PENGANTAR
Ketersediaan data merupakan komponen penting dalam proses penyelenggaraan pembangunan, karena
akan m endukung dalam pengambilan kebijakan/keputusan, alat kontrol untuk mencegah terjadinya
kesalahan serta m endukung penyelenggaraan pemerintahan yang transparan, akuntabel dan partisipatif.
Sesuai dengan amanat Undang-Undang Nomor 25 Tahun 2004 Tentang Sistem Perencanaan
Pembangunan Nasional, perencanaan pembangunan harus didasarkan pada data dan informasi yang
akurat dan dapat dipertanggungjawabkan.
Penyusunan Buku Statistik Peternakan dan Kesehatan Hewan Tahun 2015 ini merupakan publikasi
pertama dalam tahapan Rencana Pembangunan Jangka Menengah Nasional 2015-2019. Hal ini juga
merupakan komitm en Direktorat Jenderal Peternakan dan Kesehatan Hewan dalam rangka pelaporan
kinerja pembangunan peternakan dan kesehatan hewan melalui penyajian data dan informasi yang
dapat digunakan oleh seluruh pemangku kepentingan. Dalam buku ini disajikan data terkini terkait
dengan pembangunan peternakan dan kesehatan hewan, mencakup populasi, produksi, pengeluaran
dan pemasukan ternak, pemotongan ternak, serta data lainnya yang terkait dengan pembangunan
peternakan.
Ucapan terima kasih disam paikan kepada semua pihak yang telah terlibat dalam penyusunan Buku
Statistik Peternakan dan Kesehatan Hewan Tahun 2015. Kami menyadari, tidak tertutup kem ungkinan
adanya berbagai ketidaksempurnaan dalam penyajian. Oleh karena itu kritik dan saran dari sem ua pihak
sangat diharapkan dalam rangka perbaikan Buku Statistik Peternakan di tahun yang akan datang.
Semoga data dan informasi yang tersaji dalam buku ini dapat memberikan manfaat dan memenuhi
harapan para pengguna.
Jakarta, Agustus 2015
DIREKTUR JENDERAL PETERNAKAN DAN
KESEHATAN HEWAN
Dr.Ir. Muladno, MSA
Statistik Peterna kan da n Keseha tan Hewa n 2015
PREFACE
Data availability is an important component in the development implementation process, because it will
support in policy/decision making, serve as a control tool to prevent errors from occurring and support
transparent, accountable and participative governance. As mandated by Law Number 25 of 2004 On
National Development Planning System , development planning should be based on the data and
information that is accurate and accountable
Preparation of this Statistic Book on Livestock and Animal Health of 2015 is the first publication in the
stages of the National Medium Term Development Plan 2015-2019. It is also a commitment of the
Directorate General of Livestock and Animal Health Services in order to report the development
performance of livestock and animal health through presentation of data and information that can be used
by all stakeholders. This book presents the latest data relating to livestock and animal health
development, including population, production, export and import of livestock, livestock slaughtering, and
other data related to the livestock developm ent.
We grateful to all parties for their involvement in compilation of this Statistic Book on Livestock and
Animal Health of 2015. We realize, there certainly be possibilities for many imperfections in presentation.
Therefore, we will appreciate any criticisms and advices from all parties for improvement of the Statistic
Book on Livestock in the years to come. Hopefully the data and information presented in this book may
be useful and meeting expectation of the users.
Jakarta, August 2015
THE DIRECTOR GENERAL OF LIVESTOCK AND
ANIMAL HEALTH SERVICES
Dr.Ir. Muladno, MSA
Statistik Peterna kan da n Keseha tan Hewa n 2015
iii
1 Produk Domestik Bruto (PDB) Dan Produk Domestik Regional Bruto (PDRB)……… 1
Statistik Peterna kan da n Keseha tan Hewa n 2015
1.1 Nilai PDB (Rp Milyar) Sektor Pertanian Tahun 2014**) Atas Dasar Harga Berlaku ...
7
GDP Value (Billion Rupiahs) of Agriculture Sector Year 2014**) At Current Market Price
1.2 Nilai PDB (Rp Milyar) Sektor Pertanian Tahun 2014**) Atas Dasar Harga Konstan ...
7
Indeks Harga Yang Diterima Petani (IT), Indeks Harga Yang Dibayar Petani (IB) Dan Nilai Tukar Petani Peternakan (NTPP) Tahun 2012-2014 ………..
35
Statistik Peterna kan da n Keseha tan Hewa n 2015
v
1.1 Produk Domestik Bruto Tahun 2010 - 2014 (Atas Dasar Harga Berlaku) 25
Gross Domestic Product 2010 - 2014 (At Current Market Price)
1.2 Produk Domestik Bruto Tahun 2010 - 2014 (Atas Dasar Harga Konstan 2010) 26
Gross Domestic Product 2010 - 2014 (At Constant Market Price 2010)
1.3 PDRB Tahun 2010 - 2014 (Atas Dasar Harga Berlaku) Menurut Provinsi 27
GRDP 2010- 2014 (At Current Market Price) By Province
1.4 PDRB Tahun 2010 - 2014 (Atas Dasar Harga Konstan 2010) Menurut Propinsi 28
GRDP 2010 - 2014 (At Constant Market Price 2010) By Province
1.5 PDRB Pertanian Tahun 2010-2014 (Atas Dasar Harga Berlaku) Menurut Provinsi 29
GRDP Of Agriculture 2010- 2014 (At Current Market Price) By Province
1.6 PDRB Pertanian Tahun 2010-2014 (Atas Dasar Harga Konstan Tahun 2010) Menurut Provinsi 30
GRDP Of Agriculture 2010 - 2014 (At Constant Market Price 2010) By Province
1.7 PDRB Peternakan Tahun 2010 - 2014 (Atas Dasar Harga Berlaku) Menurut Provinsi 31
GRDP Of Livestock 2010 - 2014 (At Current Market Price) By Province
1.8 PDRB Peternakan Tahun 2010 - 2014 (Atas Dasar Harga Konstan 2010) Menurut Provinsi 32
GRDP Of Livestock 2010 - 2014 (At Constant Price 2010) By Province
Indeks Harga Yang Diterima Petani (IT), Indeks Harga Yang Dibayar Petani (IB), Dan Nilai Tukar Petani Peternakan (NTPT) Tahun 2012 (2007=100)
36
Statistik Peterna kan da n Keseha tan Hewa n 2015
vi
3.2
Indeks Harga Yang Diterima Petani (IT), Indeks Harga Yang Dibayar Petani (IB), Dan Nilai Tukar Petani Peternakan (NTPT) Menurut Provinsi Tahun 2012 (2007=100)
37
Indices Of Prices Received By Farmers, Indices Of Prices Paid By Farmers And Animal Husbandry Farmers Terms Of Trade (AFTT) By Province Year 2012 (2007=100)
3.3
Indeks Harga Yang Diterima Petani (IT), Indeks Harga Yang Dibayar Petani (IB), Dan Nilai Tukar Petani Peternakan (NTPT) Tahun 2013 (2007=100)
38
Indices Of Price Received By Farmers, Indices Of Prices Paid By Farmers And Animal Husbandry Farmers Terms Of Trade (AFTT) Year 2013 (2007=100)
3.4
Indeks Harga Yang Diterima Petani (IT), Indeks Harga Yang Dibayar Petani (IB), Dan Nilai Tukar Petani Peternakan (NTPT) Menurut Provinsi Tahun 2013 (2007=100)
39
Indices Of Prices Received By Farmers, Indices Of Prices Paid By Farmers And Animal Husbandry Farmers Terms Of Trade (AFTT) By Province Year 2013 (2007=100)
3.5
Indeks Harga Yang Diterima Petani (IT), Indeks Harga Yang Dibayar Petani (IB), Dan Nilai Tukar Petani Peternakan (NTPT) Tahun 2014 (2012=100)
40
Indices Of Price Received By Farmers, Indices Of Prices Paid By Farmers And Animal Husbandry Farmers Terms Of Trade (AFTT) Year 2014 (2012=100)
3.6
Indeks Harga Yang Diterima Petani (IT), Indeks Harga Yang Dibayar Petani (IB), Dan Nilai Tukar Petani Peternakan (NTPT) Menurut Provinsi Tahun 2014 (2012=100)
41
Indices Of Prices Received By Farmers, Indices Of Prices Paid By Farmers And Animal Husbandry Farmers Terms Of Trade (AFTT) By Province Year 2014 (2012=100)
4.4 Neraca Ekspor dan Impor Sub Sektor Peternakan Tahun 2012 - 2014 52
Balance Of Export and Import Of Livestock Sub Sector Year 2012 - 2014
Tenaga Kerja/Labors
5.1 Penduduk 15 Tahun Ke Atas Yang Bekerja Menurut Lapangan Pekerjaan Utama 2012 - 2014 59
Population 15 Years Of Age And Over Who Worked By Main Industry 2012 - 2014
5.2 Jumlah Tenaga Kerja Pertanian Tahun 2012 - 2014 (Per Provinsi) 60
Number Of Agriculture Employes 2012 - 2014 (By Province)
5.3 Tenaga Kerja Menurut Sub Sektor Pertanian Dan Jenis Kelamin Tahun 2012 - 2014 61
Employment By Agriculture Sub Sector And Sex Year 2012 - 2014
5.4 Tenaga Kerja Sub Sektor Peternakan Per Provinsi Tahun 2012 - 2014 62
Employment Of Livestock Sub Sector Per Provence Year 2012 - 2014
5.5 Tenaga Kerja Menurut Pendidikan Akhir Sub Sektor Peternakan Tahun 2012 - 2014 63
Employment By Graduated Of Livestock Sub Sector Year 2012 - 2014
5.6 Tenaga Kerja Menurut Umur Sub Sektor Peternakan Tahun 2012 - 2014 63
Employment By Age Of Livestock Sub Sector Year 2012 - 2014
5.7 Tenaga Kerja Menurut Status Pekerjaan Utama Sub Sektor Peternakan Tahun 2012 - 2014 64
Employment By Main Job Status Of Livestock Sub Sector Year 2012 - 2014
Konsumsi/Comsuption
6.1 Konsumsi Produk Peternakan Per Kapita Per Minggu 2010 - 2014 69
Statistik Peterna kan da n Keseha tan Hewa n 2015
vii
6.2 Konsumsi Produk Peternakan Per Kapita Per Tahun 2010 - 2014 70
Livestock Products Consumption Per Capita Per Year 2010 - 2014
6.3
Rata Rata Konsumsi Kalori Dan Protein Per Kapita Sehari Menurut Kelompok Makanan
2010 - 2014 71
Average Daily Per Capita Consumption Of Energy And Protein By Food Group 2010 - 2014
6.4 Pengeluaran Rata-Rata Per Kapita Sebulan Menurut Kelompok Barang 2010 - 2014 72
Monthly Average Expenditure Per Capita By Commodity Group 2010 - 2014
7.10 Populasi Ayam Ras Petelur Tahun 2011 - 2015 (Per Provinsi) 88
Statistik Peterna kan da n Keseha tan Hewa n 2015
9.1 Produksi Daging, Telur, Dan Susu Tahun 2011 - 2015 (Indonesia) 111
Meat, Egg, And Milk Production 2011 - 2015 (Indonesia)
9.10 Produksi Daging Ayam Ras Petelur 2011 - 2015 (Per Provinsi) 120
Layer Chicken Meat Production 2011 - 2015 (By Province)
9.11 Produksi Daging Ayam Ras Pedaging Tahun 2011 - 2015 (Per Provinsi) 121
Broiler Meat Production 2011 - 2015 (By Province)
9.12 Produksi Daging Itik Tahun 2011 - 2015 (Per Provinsi) 122
Duck Meat Production 2011 - 2015 (By Province)
9.13 Produksi Daging Kelinci Tahun 2011 - 2015 (Per Provinsi) 123
Statistik Peterna kan da n Keseha tan Hewa n 2015
ix
9.14 Produksi Daging Burung Puyuh Tahun 2011 - 2015 (Per Provinsi) 124
Quail Meat Production 2011 - 2015 (By Province)
9.15 Produksi Daging Merpati Tahun 2011 - 2015 (Per Provinsi) 125
Pigeon Meat Production 2011 - 2015 (By Province)
9.16 Produksi Daging Itik Manila Tahun 2011 - 2015 (Per Provinsi) 126
Muscovy Production 2011 - 2015 (By Province)
9.17 Produksi Telur Tahun 2011 - 2015 (Per Provinsi) 127
Egg Production 2011 - 2015 (By Province)
9.18 Produksi Telur Ayam Buras Tahun 2011 - 2015 (Per Provinsi) 128
Native Chicken Egg Production 2011 - 2015 (By Province)
9.19 Produksi Telur Ayam Ras Petelur Tahun 2011 - 2015 (Per Provinsi) 129
Layer Egg Production 2011 - 2015 (By Province)
9.20 Produksi Telur Itik Tahun 2011 - 2015 (Per Provinsi) 130
Duck Egg Production 2011 - 2015 (By Province)
9.21 Produksi Telur Puyuh Tahun 2011 - 2015 (Per Provinsi) 131
Quail Egg Production 2011 - 2015 (By Province)
9.22 Produksi Telur Itik Manila Tahun 2011 - 2015 (Per Provinsi) 132
Statistik Peterna kan da n Keseha tan Hewa n 2015
10.B11 Pemasukan Telur Itik Tahun 2011 - 2015 (Per Provinsi) 162
Statistik Peterna kan da n Keseha tan Hewa n 2015
xi
Parameter Kelahiran Dan Kematian Sapi Potong, Sapi Perah , Kerbau, Kambing Dan Domba
2008 180
Convercy Bird And Deat Of Beff Cattle, Daiiry Cattle, Buffalo, Goat And Sheep 2008
11.13
Parameter Kelahiran Dan Kematian Babi, Kuda, Atyam Buras, Ayam Ras Petelur, Ayam Ras
Pedaging Dan Itik 2008 181
Convercy Bird And Deat Of Pig, Horse, Native Chichen, Layer, Broiler And Duck 2008
Daftar Alamat/List Of Address
12.1
Daftar Alamat Pejabat Eselon I Dan II Lingkup Direktorat Jenderal Peternakan Dan Kesehatan
Hewan 185
Addresses Of Echelon I Dan II Directorate General Of Livestock And Animal Health Services
12.2 Daftar Alamat Kepala Dinas Peternakan Provinsi 186
Statistik Peterna kan da n Keseha tan Hewa n 2015
1.
Produk Domestik Bruto (PDB) Dan Produk
Domestik Regional Bruto (PDRB)
Statistik Peterna kan da n Keseha tan Hewa n 2015
3
1. PRODUK DOMESTIK BRUTO (PDB) DAN PRODUK DOMESTIK REGIONAL BRUTO (PDRB)A. PRODUK DOMESTIK BRUTO TAHUN 2010-2014
Produk Domestik Bruto atas dasar harga berlaku pada tahun 2012 sebesar Rp 8.616 triliun atau meningkat sebesar 10,01 persen dari tahun 2011 yang sebesar Rp 7.832 triliun. Produk Domestik Bruto atas dasar harga konstan pada tahun 2012 sebesar Rp 7.727 triliun atau meningkat sebesar 6,03 persen dari tahun 2011 yang sebesar Rp 7.288 triliun (angka tetap). Produk Domestik Bruto atas dasar harga berlaku pada tahun 2014**) sebesar Rp 10.543 triliun atau meningkat sebesar 10,69 persen dari tahun 2013*) yang sebesar Rp 9.525 triliun. Produk Domestik Bruto atas dasar harga konstan pada
tahun 2014**) sebesar Rp 8.568 triliun atau meningkat sebesar 5,02 persen dari tahun 2013*) sebesar Rp
8.158 triliun (angka sementara).
Distribusi PDB atas dasar harga berlaku tahun 2010-2014**) menurut lapangan usaha, yang memberikan
kontribusi terbesar adalah sektor industri pengolahan yang menempati urutan pertama sedangkan sektor pertanian, kehutanan dan perikanan serta sektor perdagangan besar dan eceran; reparasi mobil dan sepeda motor memberikan kontribusi kedua dan ketiga terbesar bagi PDB Indonesia.
Berdasarkan perhitungan PDB atas dasar harga konstan, PDB Nasional pada tahun 2012 bertumbuh sebesar 6,03 persen dibandingkan tahun 2011. Pertumbuhan ini lebih rendah dibandingkan pertumbuhan PDB tahun 2011 sebesar 6,17 persen jika dibandingkan dengan PDB tahun 2010. Laju
pertumbuhan PDB Nasional Indonesia pada tahun 2014**) mengalami penurunan dibandingkan dengan
tahun 2013*). Berdasarkan perhitungan PDB atas harga konstan, laju pertumbuhan ekonomi nasional
tahun 2014**) sekitar 5,02 persen dan pada tahun 2013*) sebesar 5,58 persen (angka sementara).
B. PRODUK DOMESTIK BRUTO PERTANIAN DAN PETERNAKAN
Nilai PDB pertanian pada tahun 2012 atas dasar harga konstan sebesar Rp.1.039,4 triliun, meningkat sebesar 4.59 persen dari tahun 2011 sebesar Rp.993,9 triliun. Sedangkan nilai PDB sub sektor peternakan pada tahun 2012 sebesar Rp 119,2 triliun, meningkat sebesar 4,97 persen dari tahun 2011
sebesar Rp.113,6 triliun (angka tetap). Nilai PDB pertanian pada tahun 2014**) atas dasar harga konstan
sebesar Rp.1.128,4 triliun, atau meningkat sebesar 4,2 persen dari tahun 2013*) sebesar Rp.1.083,1 triliun. Sedangkan nilai PDB sub sektor peternakan pada tahun 2014**) sebesar Rp 132,1 triliun, atau
meningkat sebesar 5,44 persen dari tahun 2013*) sebesar Rp 125,3 triliun (angka sementara).
Laju pertumbuhan PDB pertanian Indonesia pada tahun 2012 relatif meningkat dibandingkan dengan tahun 2011. Berdasarkan perhitungan PDB atas harga konstan, laju pertumbuhan sektor pertanian tahun 2012 sebesar 4,59 persen, dan pada tahun 2011 sebesar 3,95 persen. Sedangkan laju pertumbuhan sub sektor peternakan pada tahun 2012 sebesar 4,97 persen, lebih tinggi dibandingkan pertumbuhan tahun 2011 sebesar 4,80 persen (angka tetap). Laju pertumbuhan PDB Pertanian Indonesia pada tahun 2014**) mengalami penurunan dibandingkan dengan tahun 2013*). Berdasarkan
perhitungan PDB atas harga konstan laju pertumbuhan PDB Pertanian tahun 2014**) sebesar 4,18
persen dan pada tahun 2013*) sebesar 4,20 persen. Sedangkan laju pertumbuhan sub sektor
peternakan pada tahun 2014**) sebesar 5,44 persen, mengalami peningkatan dibandingkan tahun 2013*)
sekitar 5,08 persen (angka sementara).
Peranan PDB menurut lapangan usaha pada tahun 2011-2012 (angka tetap) sektor pertanian, kehutanan dan perikanan bila dibandingkan dengan sektor lain memberi peran sebesar 13,51 persen (tahun 2011) dan 13,37 persen (tahun 2012). Peranan PDB menurut lapangan usaha pada tahun 2013*)-2014**) (angka sementara) sektor pertanian, kehutanan dan perikanan bila dibandingkan dengan
sektor lain memberi peran sebesar 13,39 persen pada tahun 2013*) dan menurun menjadi 13,38 persen
Statistik Peterna kan da n Keseha tan Hewa n 2015
4
C. PRODUK DOMESTIK REGIONAL BRUTO (PDRB)
Berdasarkan data PDRB tahun 2012 atas dasar harga berlaku (angka tetap) di 33 provinsi seluruh Indonesia yang mempunyai Nilai PDRB terbesar adalah Provinsi DKI Jakarta yaitu sebesar 1.369,43 triliun. Sedangkan yang terendah adalah Provinsi Maluku Utara yaitu sebesar Rp.19,34 triliun dari total 33 provinsi sebesar Rp. 8.672,95 triliun. Berdasarkan data PDRB tahun 2012 atas dasar harga konstan (angka tetap) di 33 provinsi seluruh Indonesia, yang mempunyai Nilai PDRB terbesar adalah Provinsi DKI Jakarta yaitu sebesar 1.222,53 triliun. Sedangkan provinsi yang terendah yaitu Prov insi Maluku Utara yaitu sebesar Rp.17,12 triliun dari total 33 provinsi sebesar Rp. 7.735,79 triliun.
Laju Pertumbuhan PDRB tahun 2012 (angka tetap) atas dasar harga konstan di 33 propinsi seluruh Indonesia dengan pertumbuhan yang pesat adalah Provinsi Sulawesi Tenggara yaitu sebesar 11,65 persen. Sedangkan provinsi yang terendah yaitu Provinsi Nusa Tenggara Barat sebesar -1,54 persen.
PDRB sub sektor peternakan tahun 2012 (angka tetap) atas dasar harga berlaku di 33 provinsi seluruh Indonesia yang mempunyai PDRB terbesar adalah Provinsi Jawa Timur yaitu sebesar Rp.33,74 triliun dari jumlah total di 33 propinsi sebesar Rp 130,77 triliun. Peranan PDRB sub sektor peternakan Provinsi Jawa Timur terhadap PDRB sub sektor peternakan di 33 provinsi memberikan kontribusi yang cukup besar yaitu mencapai 25,80 persen. Provinsi yang mempunyai PDRB sub sektor peternakan terendah adalah Provinsi DKI Jakarta yaitu sebesar Rp.0,07 triliun. Peranan PDRB sub sektor peternakan Prov insi DKI Jakarta terhadap PDRB sub sektor peternakan di 33 provinsi memberikan kontribusi yang cukup rendah, sebesar 0,06 persen.
PDRB sub sektor peternakan tahun 2012 (angka tetap) atas dasar harga konstan di 33 provinsi seluruh Indonesia yang mempunyai PDRB terbesar adalah Provinsi Jawa Timur yaitu sebesar Rp.29,06 triliun dari jumlah total di 33 provinsi sebesar Rp.119,18 triliun. Disamping itu juga peranan PDRB sub sektor peternakan Provinsi Jawa Timur terhadap PDRB sub sektor peternakan di 33 provinsi memberikan kontribusi yang cukup besar yaitu mencapai 24,38 persen. Provinsi yang mempunyai PDRB sub sektor peternakan terendah adalah Provinsi DKI Jakarta yaitu sebesar Rp.0,068 triliun. Peranan PDRB sub sektor peternakan Provinsi DKI Jakarta terhadap PDRB sub sektor peternakan di 33 provinsi memberikan kontribusi yang cukup rendah 0,06 persen.
PENJELASAN TEKNIS
1. Data PDB dan PDRB diperoleh dari Badan Pusat Statistik.
2. Perhitungan statistik neraca nasional yang digunakan mengikuti buku petunjuk yang diterbitkan oleh Perserikatan Bangsa Bangsa dikenal dengan ”Sistem Neraca Nasional”.
3. Produk Domestik Bruto (PDB) pada tingkat nasional serta Produk Domestik Regional Bruto (PDRB) pada tingkat regional (provinsi) yang menggambarkan kemampuan suatu wilayah untuk menciptakan output (nilai tambah) pada waktu tertentu.
4.
PDB disajikan dalam dua versi penilaian, yaitu atas dasar ”harga berlaku” dan atas dasar ”harga konstan”.Disebut sebagai harga berlaku karena seluruh agregat dinilai dengan menggunakan harga pada tahun berjalan. Sedangkan harga konstan penilaiannya berdasarkan pada harga suatu tahun dasar tertentu.
Statistik Peterna kan da n Keseha tan Hewa n 2015
5
1. GROSS DOMESTIC PRODUCT (GDP)AND GROSS REGIONAL DOMESTIC PRODUCT (GRDP)A. GROSS DOMESTIC PRODUCT 2010-2014
Gross Domestic Product at current prices in 2012 is Rp 8,616 trillion or increasing by 10.01 percent from the 2011 amounting to Rp 7,832 trillion. Gross Domestic Product at constant prices in 2012 is Rp 7,727 trillion or increasing by 6.03 percent from the 2011 amounting to Rp 7,288 trillion (final figures). Gross Domestic Product based on the current price in 2014**) is Rp 10,543 trillion or increasing by 10.69 percent from the 2013*) amounting to Rp 9,525 trillion. Gross Domestic Product at constant prices in 2014**) amounts to Rp 8,568 trillion or increasing by 5.02 percent from the 2013*) amounting to Rp 8,158 trillion (provisional figures).
GDP Distribution at current prices in 2010-2014**) by business fields, that gave largest contribution is the processing industry sector that places the first rank, whereas the agricultural, forestry and fishery sectors and wholesale and retail trades; repair of motor v ehicles and motorcycles gave the second and third largest contribution to the Indonesian GDP.
Based on GDP calculation at constant prices, the National GDP in 2012 grew by 6.03 percent compared to in 2011. This growth is lower than the GDP growth in 2011 by 6.17 percent in comparison to the GDP
2010. The Indonesian National GDP growth rate in 2014**) has experienced the decrease compared to in
2013*). Based on GDP calculation at constant price, the national economic growth rate in 2014**) is around 5.02 percent and in 2013*) is around 5.58 percent (provisional figures).
B. GROSS DOMESTIC PRODUCT OF AGRICULTURE AND LIVESTOCK
The agricultural GDP value in 2012 at constant prices was Rp 1,039.4 trillion, increasing by 4.59 percent from the year 2011 amounting to Rp 993.9 trillion. While the GDP value of the livestock sub-sector in 2012 amounted to Rp 119.2 trillion, increasing by 4.97 percent from the year 2011 amounting to Rp 113.6 trillion (final figures). Agricultural GDP value in 2014**) at constant prices amounted to Rp 1,128.4 trillion, or increasing by 4.2 percent from the year 2013*) amounting to Rp 1,083.1 trillion. While the GDP value of livestock sub-sector in 2014**) amounted to Rp 132.1 trillion, or increasing by 5.44 percent from the year 2013*) amounting to Rp 125.3 trillion (provisional figures).
Indonesian agricultural GDP growth rate in 2012 relatively increased compared to in 2011. Based on GDP calculation at constant price, agricultural economic growth rate in 2012 was around 4.59 percent, and in 2011 amounted to 3.95 percent. W hile the livestock sub-sector growth rate in 2012 was 4.97 percent, higher than the growth in 2011 amounting to 4.80 percent (final figures).
Indonesia agricultural GDP growth rate in 2014**) decreased compared to the year 2013*). Based on the calculation of GDP at constant price, the agricultural GDP growth rate in 2014**) was around 4.18 percent and in 2013*) was 4.20 percent. While livestock sub-sector growth rate in 2014**) was 5.44
percent, increasing compared to the year 2013*) of approximately 5.08 percent (provisional figures).
Role of GDP by business field in 2011-2012 (final figures), the agricultural, forestry and fishery sectors, when compared to other sectors, have contributed at 13.51 percent (2011) and 13.37 percent (2012). Role of GDP by business field in 2013*)-2014**) (provisional figures), the agricultural, forestry and fishery sectors, when compared to other sectors, hav e contributed at 13.39 percent in 2013*) and decreased to 13.38 percent in 2014**).
Statistik Peterna kan da n Keseha tan Hewa n 2015
trillion. Whereas the province with lowest GRDP value is North Maluku Province, namely amounting to Rp 17.12 trillion of total of 33 provinces amounting to Rp 7,735.79 trillion.GRDP growth rate in 2012 (final figures) at constant prices in 33 provinces throughout Indonesia, the province with rapid growth is South east Sulawesi Province namely at 11.65 percent. While the slowest growing prov ince is West Nusa Tenggara, namely at -1.54 percent.
GRDP of liv estock sub-sector in 2012 (final figures) at current prices in 33 provinces throughout Indonesia, the province with the highest GRDP is the East Jav a Province namely amounting to Rp 33.74 trillion of the total 33 Provinces amounting to Rp 130.77 trillion. The role of GRDP of livestock sub-sector in East Java Province to the GRDP of livestock sub-sector in the 33 provinces gav e a considerable large contribution, namely reaching 25.80 percent. The Province with the lowest GRDP in the livestock sub-sector is DKI Jakarta Province namely amounting to Rp 0.07 trillion. The role of GRDP of livestock sub-sector of DKI Jakarta Province to the GRDP of livestock sub-sector in 33 provinces gav e a considerable low contribution, 0.06 percent.
GRDP of livestock sub-sector in 2012 (final figures) at constant prices in 33 provinces throughout Indonesia, the province with the highest GRDP is East Jav a Province namely amounting to Rp 29.06 trillion of the total 33 provinces amounting to Rp 119.18 trillion. In addition, the role of GRDP of livestock sub-sector of East Java province to the GRDP of livestock sub-sector in 33 provinces gave a considerable large contribution, namely reaching 24.38 percent. The province with the lowest GRDP in the livestock sub-sector is DKI Jakarta Province namely amounting to Rp 0.068 trillion. The role of GRDP of livestock sub-sector of DKI Jakarta Province to the GRDP of livestock sub-sector in 33 provinces gav e a considerable low contribution, 0.06 percent.
TECHNICAL EXPLANATION
1. GDP and GRDP data have been obtained from the Central Bureau of Statistics.
2. The calculation of national account statistic was used to follow the manual issued by the United Nations, known as the "System of National Accounts".
3. Gross Domestic Product (GDP) at the national level and Gross Regional Domestic Product (GRDP) at the regional (provincial) lev elthat depict the ability of a region to create output (value added) at any given time.
4. GDP is presented in two assessment versions, namely, one is based on "current prices" and the other one is based on "constant prices". It is called as current price because all of the aggregates are assessed by using the prices in current year. Whereas, the assessment of constant prices is based on price of a certain base year.
5. GDP growth rate is obtained by subtracting the GDP value in year n from the value in year n-1 (previous year), and then multiplied by 100 percent. The growth rate indicates the dev elopment of aggregate income from time to time.
Statistik Peterna kan da n Keseha tan Hewa n 2015
Grafik1.1 Nilai PDB (Rp Milyar) Sektor Pertanian Tahun 2014**) Atas Dasar Harga Berlaku
Graph GDP Value (Billion Rupiahs) of Agriculture Sector Year 2014**) At Current Market Price
Grafik
1.2 Nilai PDB (Rp Milyar) Sektor Pertanian Tahun 2014**) Atas Dasar Harga Konstan
Graph GDP Value (Billion Rupiahs) of Agriculture Sector Year 2014**) At Constant Market Price
Statistik Peterna kan da n Keseha tan Hewa n 2015
8
Grafik
1.3 PDB Peternakan Atas Dasar Harga Berlaku Dan Harga Konstan Tahun 2010-2014** (Rp Milyar)
Statistik Peterna kan da n Keseha tan Hewa n 2015
9
Tabel
1.1 Produk Domestik Bruto Tahun 2010 - 2014 (Atas Dasar Harga Berlaku)
Table Gross Domestic Product 2010 - 2014 (At Current Market Price)
(Rp Milyar/Billion rupiahs)
No. Lapangan Usaha/Industrial Or igin Tahun/Year
2010 2011 2012 2013* ) 2014* *)
(1) (2) (3) (4) (5) (6) (7)
A Pert anian, Kehut anan, dan Perikanan 956.119,7 1.058.245,3 1.152.262,1 1.275.048,4 1.410.657,1 Agriculture, Forestry And Fishery
1. Pert anian, Peternakan, Perburuan dan Jas a Pertanian 754.434,4 832.513,6 902.125,9 994.778,4 1.088.944,9 Agriculture, Lives tock, Hunting and Agriculture Servic es
a. Tanaman Pangan 253.326,6 270.977,4 305.670,5 332.111,9 343.952,2 Food crops
b. Tanaman Hortikultura 110.395,3 125.286,1 125.107,9 137.368,8 159.520,6 Horticultural crops
c. Tanaman Perkebunan 268.207,3 303.402,9 323.361,6 358.172,4 397.896,2 Plantation crops
2. Kehutanan dan Penebangan Kayu 58.125,9 62.247,7 65.882,2 69.599,2 74.618,0 Forestry and Logging
3. Perikanan 143.559,4 163.484,0 184.254,0 210.670,8 247.094,2 Fishery
B Pert ambangan dan Penggalian 718.128,6 924.813,4 1.000.307,6 1.042.975,9 1.035.120,9 Mining and Quarrying
C Industri Pengolahan 1.512.760,8 1.704.250,5 1.848.150,9 1.998.693,7 2.215.753,6 Manufacturing Industry
D Pengadaan Listrik dan Gas 72.549,1 91.721,9 95.637,8 98.686,8 114.121,9 Elec tricity And Gas Supply
H Transportasi dan Pergudangan 245.375,4 276.122,4 313.156,2 368.678,6 450.600,0 Transport And Storage
I Penyediaan Akomodasi dan Makan Minum 200.281,8 224.215,3 252.612,3 289.498,3 330.672,4 Accommodation And Food Servic e Activ ities
J Informasi dan Komunikasi 256.048,1 281.777,6 311.362,4 341.009,4 368.943,0 Information And Communication
K Jasa Keuangan dan Asuransi 239.728,4 270.586,3 320.534,3 368.876,9 408.646,7 Financial And Ins urance Serv ices
L Real Estate 198.213,5 218.796,6 237.913,9 264.275,0 294.573,4 Real Estate Activities
M,N Jasa Perusahaan 99.085,4 113.975,3 127.724,2 144.604,1 165.990,6 Busines s Services
O Administrasi Pemerintahan, Pertahanan dan Jaminan Sosial Wajib 259.646,1 304.755,7 340.567,6 371.208,9 404.379,6 Public Administration, Defence And Compulsory Social Security
P Jasa Pendidikan 201.559,5 232.726,8 270.372,3 309.438,5 346.557,8 Education Serv ices
Q Jasa Kesehat an dan Kegiatan Sosial 66.444,7 76.404,9 86.235,4 96.666,9 109.069,7 Human Health And Social Work Activities
Statistik Peterna kan da n Keseha tan Hewa n 2015
10
Tabel
1.2 Produk Domestik Bruto Tahun 2010 - 2014 (Atas Dasar Harga Konstan 2010)
Table Gross Domestic Product 2010 - 2014 (At Constant Market Price 2010)
(Rp Milyar/Billion rupiahs)
No. Lapangan Usaha/Industrial Or igin Tahun/Year
2010 2011 2012 2013* ) 2014* *)
(1) (2) (3) (4) (5) (6) (7)
A Pert anian, Kehut anan, dan Perikanan 956.119,7 993.857,3 1.039.440,7 1.083.141,8 1.128.448,0 Agriculture, Forestry And Fishery
1. Pert anian, Peternakan, Perburuan dan Jas a Pertanian 754.434,4 780.581,1 816.304,4 847.763,7 879.231,2 Agriculture, Lives tock, Hunting and Agriculture Servic es
a. Tanaman Pangan 253.326,6 250.787,4 263.076,2 268.268,2 268.917,9 Food crops
b. Tanaman Hortikultura 110.395,3 120.079,3 117.424,5 118.207,7 123.158,8 Horticultural crops
c. Tanaman Perkebunan 268.207,3 281.465,0 301.019,5 319.532,6 338.154,5 Plantation crops
2. Kehutanan dan Penebangan Kayu 58.125,9 58.731,0 58.872,0 59.228,8 59.573,5 Forestry and Logging
3. Perikanan 143.559,4 154.545,2 164.264,3 176.149,3 189.643,3 Fishery
B Pert ambangan dan Penggalian 718.128,6 748.956,3 771.561,6 785.016,3 789.329,7 Mining and Quarrying
C Industri Pengolahan 1.512.760,8 1.607.452,0 1.697.787,2 1.774.097,3 1.856.310,6 Manufacturing Industry
D Pengadaan Listrik dan Gas 72.549,1 76.678,1 84.393,0 88.805,1 93.755,9 Elec tricity And Gas Supply
H Transportasi dan Pergudangan 245.375,4 265.774,0 284.662,6 308.521,2 333.190,9 Transport And Storage
I Penyediaan Akomodasi dan Makan Minum 200.281,8 214.022,0 228.232,6 243.748,3 258.161,0 Accommodation And Food Servic e Activ ities
J Informasi dan Komunikasi 256.048,1 281.693,8 316.278,7 349.150,2 384.129,9 Information And Communication
K Jasa Keuangan dan Asuransi 239.728,4 256.443,0 280.896,1 306.432,2 321.525,5 Financial And Ins urance Serv ices
L Real Estate 198.213,5 213.441,4 229.254,2 244.237,5 256.440,2 Real Estate Activities
M,N Jasa Perusahaan 99.085,4 108.239,3 116.293,3 125.490,7 137.795,3 Busines s Services
O
Administrasi Pemerintahan, Pertahanan dan Jaminan Sosial
Wajib 259.646,1 276.336,8 282.235,3 288.963,3 296.145,0 Public Administration, Defence And Compulsory Social Security
P Jasa Pendidikan 201.559,5 215.029,1 232.704,3 251.784,6 267.633,3 Education Serv ices
Q Jasa Kesehat an dan Kegiatan Sosial 66.444,7 72.592,1 78.380,1 84.518,4 91.287,8 Human Health And Social Work Activities
Statistik Peterna kan da n Keseha tan Hewa n 2015
11
Perbedaan antara jumlah PDRB 33 PROVINSI dan PDB Indonesia antara lain disebabkan oleh diskrepansi statistik/
The difference between the total of GRDP of 33 Provinces and the GDP of Indonesia among others due to the statistical discrepancies
*) Angka sementara/Preliminary figures
**) Angka sangat sementara/Very preliminary figures
Statistik Peterna kan da n Keseha tan Hewa n 2015
12
Tabel
1.4 PDRB Tahun 2010 - 2014 (Atas Dasar Harga Konstan 2010) Menurut Propinsi
Table GRDP 2010 - 2014 (At Constant Market Price 2010) By Province
(Rp Milyar/Billion rupiahs)
Perbedaan antara jumlah PDRB 33 PROVINSI dan PDB Indonesia antara lain disebabkan oleh diskrepansi statistik/
The difference between the total of GRDP of 33 Provinces and the GDP of Indonesia among others due to the statistical discrepancies
*)
Angka sementara/Preliminary figures
**) Angka sangat sementara/Very preliminary figures
Statistik Peterna kan da n Keseha tan Hewa n 2015
13
Tabel
1.5 PDRB Pertanian Tahun 2010-2014 (Atas Dasar Harga Berlaku) Menurut Provinsi
Table GRDP Of Agriculture 2010- 2014 (At Current Market Price) By Province
(Rp Milyar/Billion rupiahs)
Jumlah / Total 956.146 1.058.090 1.154.134 1.275.691 1.418.155
Statistik Peterna kan da n Keseha tan Hewa n 2015
14
Tabel
1.6 PDRB Pertanian Tahun 2010-2014 (Atas Dasar Harga Konstan Tahun 2010) Menurut Provinsi
Table GRDP Of Agriculture 2010 - 2014 (At Constant Market Price 2010) By Province
Statistik Peterna kan da n Keseha tan Hewa n 2015
15
Tabel
1.7 PDRB Peternakan Tahun 2010 - 2014 (Atas Dasar Harga Berlaku) Menurut Provinsi
Table GRDP Of Livestock 2010 - 2014 (At Current Market Price) By Province
Statistik Peterna kan da n Keseha tan Hewa n 2015
16
Tabel
1.8 PDRB Peternakan Tahun 2010 - 2014 (Atas Dasar Harga Konstan 2010) Menurut Provinsi
Table GRDP Of Livestock 2010 - 2014 (At Constant Price 2010) By Province
Statistik Peterna kan da n Keseha tan Hewa n 2015
Statistik Peterna kan da n Keseha tan Hewa n 2015
INVESTASIRealisasi investasi PMDN (Penanaman Modal Dalam Negeri) Tahun 2013 sebanyak 1.449 proyek dengan nilai investasi sebesar Rp.128,16 triliun (Tabel 2.1). Tahun 2014 jumlah proyek investasi PMDN meningkat menjadi 1.652 proyek dengan nilai investasi sebesar Rp.156,13 triliun. Investasi PMDN pada kurun waktu tahun 2013-2014 didominasi investasi di sektor industri, masing-masing sebesar 39,93 persen (tahun 2013) dan 37,81 persen (tahun 2014) dari total nilai investasi tahun 2013 dan 2014.
Nilai investasi PMDN pertanian pada tahun 2013 sebesar Rp.6,95 triliun, yang terdiri dari tanaman pangan dan perkebunan sebesar Rp.6,59 triliun (94,75 persen), peternakan sebesar Rp.360,60 miliar (5,19 persen), kehutanan sebesar Rp.50 juta (0,001 persen) dan perikanan sebesar Rp.4,07 miliar (0,06 persen). Nilai investasi PMDN pertanian tahun 2014 meningkat menjadi sebesar Rp.13,38 triliun, yang terdiri dari investasi tanaman pangan dan perkebunan sebesar Rp.12,71 triliun (94,97 persen), peternakan sebesar Rp.650,68 miliar (4,86 persen), kehutanan sebesar Rp.313 juta (0,002 persen) dan perikanan sebesar Rp.21,70 miliar (0,16 persen).
Realisasi investasi PMA (Penanaman Modal Asing) tahun 2013 sebanyak 6.863 proyek dengan nilai inv estasi sebesar US$ 28,62 miliar (Tabel 2.2). Tahun 2014 jumlah proyek inv estasi PMA meningkat menjadi 8.885 proyek dengan nilai investasi sebesar US$ 28,53 miliar. Investasi PMA pada kurun waktu tahun 2013-2014 didominasi investasi di sektor industri, masing-masing sebesar 55,42 persen (tahun 2013) dan 45,63 persen (tahun 2014) dari total nilai investasi tahun 2013 dan 2014.
Jika investasi PMDN peternakan dirinci menurut wilayah (Tabel 2.3), terlihat bahwa investasi PMDN peternakan pada tahun 2013 terkonsentrasi di wilayah Sumatera dengan nilai investasi mencapai Rp.243,45 miliar (67,51 persen dari total PMDN peternakan tahun 2013). Sementara wilayah lainnya hanya memberikan kontribusi sebesar Rp.117,16 miliar (32,49 persen dari total PMDN peternakan tahun 2013). Nilai investasi PMDN peternakan pada tahun 2014 terkonsentrasi di wilayah Jawa dengan nilai investasi mencapai Rp.336,21 miliar (51,67 persen dari total PMDN peternakan tahun 2014). Sementara wilayah lainnya memberikan kontribusi sebesar Rp.314,47 miliar (48,33 persen dari total PMDN peternakan tahun 2014).
Jika investasi PMA peternakan dirinci menurut wilayah (Tabel 2.4), terlihat bahwa nilai investasi PMA peternakan pada tahun 2013 terkonsentrasi di Kalimantan dengan nilai investasi sebesar US$ 7 juta (61,94 persen dari total PMA peternakan tahun 2013). Sementara wilayah lainnya hanya memberikan kontribusi sebesar US$ 4,30 juta (38,06 persen dari total PMA peternakan tahun 2013). Nilai investasi PMA peternakan tahun 2014 terkonsentrasi di Jawa dengan nilai investasi sebesar US$ 28,01 juta (90,88 persen dari total PMA peternakan tahun 2014). Sementara wilayah lainnya hanya memberikan kontribusi sebesar US$ 2,81 juta (9,12 persen dari total PMA peternakan tahun 2014).
PENJELASAN TEKNIS
1. Data diperoleh dari Badan Koordinasi Penanaman Modal (BKPM).
2. Total nilai investasi di luar investasi Sektor Minyak & Gas Bumi, Perbankan, Lembaga Keuangan Non Bank, Asuransi, Sewa Guna Usaha, Investasi yang perizinannya dikeluarkan oleh instansi teknis/sektor, Investasi Porto Folio (Pasar Modal) dan Investasi Rumah Tangga.
3. Realisasi investasi sebelum 2010 berasal dari data Izin Usaha (IU), sementara sejak 2010 berasal dari data Laporan Kegiatan Penanaman Modal (LKPM).
Statistik Peterna kan da n Keseha tan Hewa n 2015
INVESTMENTRealization of domestic direct investment (PMDN) in 2013 are 1,449 projects with investment v alue of Rp. 128.16 trillion (Table 2.1). In 2014, number of domestic direct investment projects increased to 1,652 projects with investment value of Rp.156.13 trillion. Domestic direct investment in the period 2013-2014 were dominated by investment in the industrial sector, respectively, amounting to 39.93 percent (in 2013) and 37.81 percent (in 2014) of the total investment value in 2013 and 2014.
Value of the agricultural domestic direct investment in 2013 amounted to Rp.6.95 trillion, consisting of investment in food crops and plantation amounting to Rp.6.59 trillion (94.75 percent), livestock amounting to Rp.360.60 billion (5.19 percent), forestry amounting to of Rp.50 million (0.001 percent) and fishery amounting to Rp.4.07 billion (0.06 percent). Value of agricultural domestic direct inv estment in 2014 increased to Rp. 13.38 trillion, consisting of investment in food crops and plantation amounting to Rp.12.71 trillion (94.97 percent), livestock amounting to Rp.650.68 billion (4.86 percent), forestry amounting to of Rp.313 million (0.002 percent) and fishery amounting to Rp.21.70 billion (0.16 percent).
Realization of foreign direct investment (PMA) in 2013 are 6,863 projects with investment value of US$ 28.62 billion (Table 2.2). In 2014, number of foreign direct inv estment projects increased to 8,885 projects with livestock domestic direct investment in 2013 was concentrated in Sumatera region amounting to Rp.243.45 billion (67.51 percent of total liv estock domestic direct investment in 2013). W hile other regions contributed only Rp.117.16 billion (32.49 percent of the total livestock domestic direct investment in 2013). Value of livestock domestic direct investments in 2014 was concentrated in Java region with investment value reaching Rp.336.21 billion (51.67 percent of total liv estock domestic direct investment in 2014). W hile other regions contributed only Rp.314.47 billion (48.33 percent of total livestock domestic direct investment in 2014).
If the livestock foreign direct investments are detailed by region (Table 2.4), it is seen that the value of livestock foreign direct investment in 2013 was concentrated in Kalimantan region amounting to US$ 7 million (61.94 percent of total livestock foreign direct investment in 2013). W hile other regions contributed only US$ 4.30 million (38.06 percent of the total livestock f oreign direct inv estment in 2013). Value of liv estock foreign direct investments in 2014 was concentrated in Java region with investment value reaching US$ 28.01 million (90.88 percent of total livestock foreign direct investment in 2014). W hile other regions contributed only US$ 2.81 million (9.12 percent of total liv estock foreign direct investment in 2014).
TECHNICAL EXPLANATION
1. Data hav e been obtained from the Investment Coordinating Board (BKPM).
2. Total value of investments beyond the Oil & Natural Gas, Banking, Non Bank Financial Institution, Insurance, Leasing Sectors, Investments the licenses of which are issued by the technical agencies/ sectors, Porto Folio (Capital Markets) Investment and Household Inv estment.
3. Realized investment prior to 2010 came from the business license (IU) data, whereas, since 2010, they came from the Investment Activity Report (LKPM) data.
Statistik Peterna kan da n Keseha tan Hewa n 2015
23
Grafik2.1 Nilai Investasi PMDN Peternakan 2010-2014 (Rp Juta)
Graph Value of Livestock Domestic Direct Investment 2010-2014 (Million Rp)
Grafik
2.2 Nilai Investasi PMA Peternakan 2010-2014 (US$ Ribu)
S
Table Domestic Direct Investment Realization Based On Capital Investment Activity Report By Sector 2010-2014
No Lapangan Usaha/Industrial Origin Proyek/Projects Nilai Investasi (Rp. Juta)/Investment Value (million rupiah)
2010 2011 2012 2013 2014 2010 2011 2012 2013 2014
Jumlah/Total 772 971 1.134 1.449 1.652 60.626.308 76.000.694 92.182.014 128.162.654 156.126.157
S
Table Foreign Direct Investment Realization Based On Capital Investment Activity Report By Sector 2010-2014
No Lapangan Usaha/Industrial Origin Proyek/Projects Nilai Investasi (US$. ribu)/Investment value (thousand US$ )
2010 2011 2012 2013 2014 2010 2011 2012 2013 2014
Jumlah/Total 2.965 3.592 4.416 6.863 8.885 16.214.772 19.474.532 24.564.670 28.616.270 28.529.699
S
No. Provinsi/Province Proyek/Projects Nilai Investasi (Rp. Juta)/Investment Value (million rupiah)
Statistik Peterna kan da n Keseha tan Hewa n 2015
3.
Nilai Tukar Petani Peternakan (NTPP)
Animal Husbandry Farmers Terms Of
Statistik Peterna kan da n Keseha tan Hewa n 2015
Kalimantan Timur (116,11) dan terendah di Provinsi Kalimantan Barat (80,59). Rata-rata IT tertinggi berada di Prov insi Nusa Tenggara Barat (151,38) dan terendah di Provinsi Kalimantan Barat (105,80). Sedangkan rata-rata IB tertinggi di Jawa Timur (141,61) dan terendah di Prov insi Kepulauan Bangka Belitung (116,03).Rata-rata Nilai Tukar Petani Peternakan (NTPP) pada tahun 2013 (hingga Nopember) sebesar 102,05 (Tabel 3.3). Rata-rata indeks harga yang diterima petani peternakan (IT) tahun 2013 sebesar 145,19. Rata-rata indeks harga yang dibayar petani peternakan (IB) tahun 2013 sebesar 142,25. Rata-rata IT tertinggi pada tahun 2013 adalah pada sub kelompok peternak ternak kecil (157,37), sementara IT terendah adalah pada sub kelompok peternak ternak besar (139,14). Mulai Desember 2013 perhitungan NTP menggunakan tahun dasar 2012 (2012=100). pada sub kelompok peternak ternak besar (118,13), sementara IT terendah adalah pada sub kelompok hasil ternak (112,36).
Jika dirinci menurut Provinsi (Tabel 3.6), rata-rata NTPP tertinggi pada tahun 2014 berada di Provinsi Bali (112,73) dan terendah di Provinsi Kalimantan Barat (95,07). Rata-rata IT tertinggi berada di Provinsi Bali (122,31) dan terendah di Provinsi Kalimantan Barat (104,46). Sedangkan rata-rata IB tertinggi di Provinsi Maluku (112,76) dan terendah di Provinsi Kepulauan Riau (105,79).
PENJELASAN TEKNIS
1. Nilai tukar petani (NTP) adalah perbandingan antara indeks harga yang diterima petani (IT) dengan Indeks harga yang dibayar petani (IB) yang dinyatakan dalam persentase. Secara konsep NTP menyatakan tingkat kemampuan tukar atas barang-barang (produk) yang dihasilkan petani di pedesaan terhadap barang/jasa yang dibutuhkan untuk konsumsi rumah tangga dan keperluan dalam proses produksi pertanian.
2. Arti Angka NTP :
NTP > 100, berarti petani mengalami surplus. Harga produksi naik lebih besar dari kenaikan harga konsumsinya. Pendapatan petani naik lebih besar dari pengeluarannya.
NTP = 100, berarti petani mengalami impas. Kenaikan/penurunan harga produksinya sama dengan persentase kenaikan/penurunan harga barang konsumsi. Pendapatan petani sama dengan pengeluarannya.
NTP< 100, berarti petani mengalami defisit. Kenaikan harga produksi relatif lebih kecil dibandingkan dengan kenaikan harga barang konsumsinya. Pendapatan petani turun, lebih kecil dari pengeluarannya.
Statistik Peterna kan da n Keseha tan Hewa n 2015
3. Dari Indeks Harga Yang Diterima Petani (IT), dapat dilihat fluktuasi harga barang-barang yang dihasilkan petani. Indeks ini digunakan juga sebagai data penunjang dalam penghitungan pendapatan sektor pertanian.
4. Dari Indeks Harga Yang Dibayar Petani (IB), dapat dilihat fluktuasi harga barang-barang yang dikonsumsi oleh petani yang merupakan bagian terbesar dari masyarakat di pedesaan, serta fluktuasi harga barang yang diperlukan untuk memproduksi hasil pertanian. Perkembangan IB juga dapat menggambarkan perkembangan inflasi di pedesaan.
5. Cakupan KomoditasSub Sektor Peternakan seperti : ternak besar (sapi, kerbau), ternak kecil (kambing, domba, babi, dll), unggas (ayam, itik, dll), hasil-hasil ternak (susu sapi, telur, dll).
Statistik Peterna kan da n Keseha tan Hewa n 2015
LIVESTOCK FARMERS EXCHANGE RATE (NTPP)The Average Livestock Farmers Exchange Rate (NTPP) in 2012 was 101.33 (Table 3.1). The average index of prices receiv ed by the livestock farmers (IT) in 2012 was 136.65. The average index of prices paid by livestock farmers (IB) in 2012 was 134.85. The highest average IT in 2012 IT was in the small livestock farmers
The Average Livestock Farmers Exchange Rate (NTPP) in 2013 (until November) was 102.05 (Table 3.3). The average index of prices received by the livestock farmers (IT) in 2013 was 145.19. The average index of prices paid by the liv estock f armers (IB) in 2013 was 145.25. The highest average IT in 2013 was in small livestock
The Average Livestock Farmers Exchange Rate (NTPP) in 2014 was 106.65 (Table 3.5). The average index of prices received by the livestock farmers (IT) in 2014 was 116.53. The average index of prices paid by the livestock farmers (IB) in 2014 was 109.26. The highest average IT in 2014 was in large livestock farmers subgroup (118.13), while the lowest IT was in the production of livestock farmers subgroup (112.36).
If broken down by Province (Table 3.6), the highest average NTPP in 2014 was in Bali Province (112.73) and the lowest one was in W est Kalimantan Province (95.07). The highest average IT was in Bali Province (122.31) and the lowest one was in West Kalimantan Province (104.46). W hereas the highest average IB was in Maluku Province (112.76) and the lowest one was in Riau Island Province (105.79).
TECHNICAL EXPLANATION
NTP> 100, means the farmers have a surplus. The production prices rise greater than the increase in consumption rates. Farmers’ incomes increases higher than their expenditures.
Statistik Peterna kan da n Keseha tan Hewa n 2015
34
4. From the Index of Prices Paid by Farmers (IB), the fluctuation of prices of goods consumed by the farmers, who are the largest part of the rural communities, and the fluctuation of prices of goods required to produce the agricultural products can be seen. The IB developments can also depict the development of inflation in the rural.
Statistik Peterna kan da n Keseha tan Hewa n 2015
35
Grafik 3.1
Indeks Harga Yang Diterima Petani (IT), Indeks Harga Yang Dibayar Petani (IB) Dan Nilai Tukar Petani Peternakan (NTPP) Tahun 2012-2014
S
Table Indices Of Price Received By Farm ers, Indic es Of Price s Paid By Farmers And Anim al Husbandry Farme rs Terms Of Trade (AFTT) Year 201 2 ( 2007=100)
2 Indeks Harga Yang Diba yar Pet ani (IB)/Indices Of Consumer Prices Pa id
By Farmers (IB) 132,66 133,15 133,33 133,61 133,87 134,44 135,21 136,01 136,1 136,3 136,55 136,97 134,85
3 Nilai Tukar Pet ani Pete rnakan ( NTPT)/ Animal Husbandry Farm ers Terms
Of Trade (AFTT) 101,20 101,11 101,16 101,14 101,20 101,13 101,33 101,39 101,40 101,91 101,40 101,61 101,33
S
Sumb er/So urce : Bad an Pusa t Stati stik/BPS -Statistics Indon esi aKe te rang an/No te :
S
Table Indices Of Price Received By Farm ers, Indic es Of Price s Paid By Farmers And Anim al Husbandry Farme rs Terms Of Trade (AFTT) Year 201 3 ( 2007=100)
3 Nilai Tukar Pet ani Pete rnakan ( NTPT)/Animal Husbandry Farm ers Terms Of
Trade (AFTT) 101,30 101,24 100,82 101,15 101,50 101,80 102,59 102,40 102,79 103,92 103,05 105,79 102,05
Sumber /Sour ce : Ba dan Pusat Statisti k/BPS -Stati stics Indonesia Keterang an/Note :
*) Mul ai Desemb er 2 013 p erhi tung an NTP menggun aka n tahu n dasar 2 012 (20 12=100 )/Since Desember 2013 , FTT calcu lati on using base ye ar 2 012 (201 2=1 00) **)
S
Sumb er/So urce : Bad an Pusa t Stati stik/BPS -Statistics Indon esi aKe te rang an/No te s:
IT= In deks Harg a yang d iteri ma p e tan i/IT=Ind ices of p rice re ceived by fa rme rs, IB= Ind eks harg a ya ng di bayar p etani /IB= Ind ices of c onsum er prices p aid b y farme rs, NTPT= Nil ai tukar pe ta ni pe te rnakan /NTPT=Animal h usb andry farme rs terms of trad e
* )
Mul ai De sembe r 2 013 perhi tun ga n N TP me ng gun akan tahun das ar 2 01 2 (201 2=1 00 )/Sin ce Dese mbe r 201 3 , FTT ca lcul ati on usi ng b ase yea r 2 012 (2 012 =1 00)
S
Table Indices Of Price Received By Farm ers, Indic es Of Price s Paid By Farmers And Anim al Husbandry Farme rs Terms Of Trade (AFTT) Year 201 4 ( 2012=100)
In deks Bia ya Prod uksi dan Penamb ahan Bar ang Modal/Cost of Pr
oduc-tion and Cap ital Formaoduc-tion In dices 103,79 103,93 104,09 104,14 104,39 104,62 104,86 105,00 105,20 105,34 106,15 108,27 104,98
3 Nilai Tukar Pet ani Pete rnakan ( NTPT)/Animal Husbandry Farm ers
Term s Of Trade ( AFTT) 105,76 105,64 105,69 105,88 105,96 106,32 107,07 107,41 108,56 108,72 107,25 105,54 106,65
S
Sumb er/So urce : Bad an Pusa t Stati stik/BPS -Statistics Indon esi aKe te rang an/No te :
Statistik Peterna kan da n Keseha tan Hewa n 2015
Statistik Peterna kan da n Keseha tan Hewa n 2015
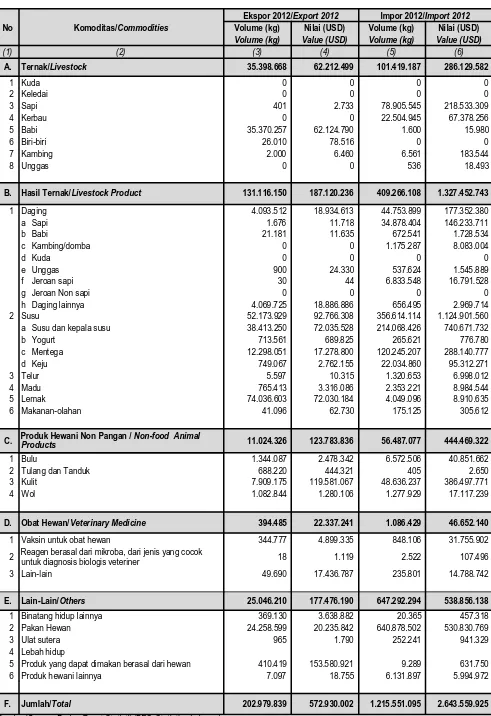
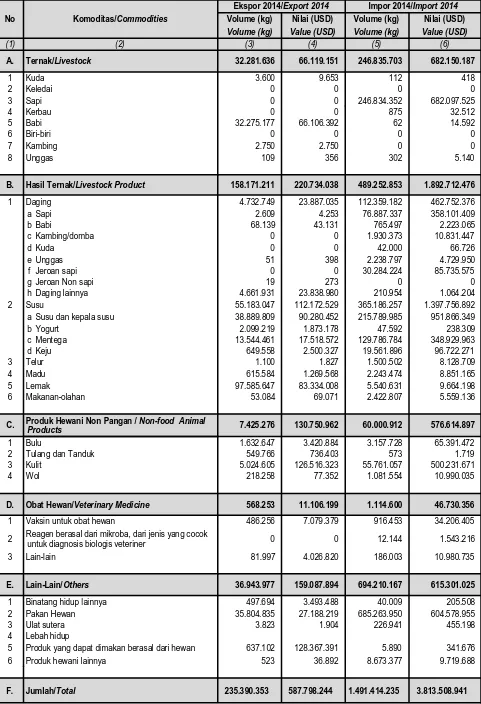
EKSPOR - IMPORPada tahun 2014 nilai ekspor produk peternakan sebesar US$ 587,80 juta (Tabel 4.3), atau mengalami penurunan sebesar 0,70 persen dibandingkan ekspor tahun 2013 yang bernilai US$ 591,95 juta (Tabel 4.2). Penurunan tersebut berasal dari ekspor ternak yang menurun sebesar US$ 7,49 juta (10,18 persen) dari ekspor tahun 2013. Jenis ekspor lainnya yang menurun adalah ekspor produk hewani non pangan yang menurun sebesar US$ 5,98 juta (4,37 persen) dari ekspor tahun 2013.
Dari sisi volume, ekspor peternakan tahun 2014 sebanyak 235.390 ton, atau mengalami peningkatan 6,91 persen dari v olume ekspor tahun 2013 yang sebesar 220.183 ton. Peningkatan tersebut diantaranya disebabkan peningkatan ekspor hasil ternak sebesar 14,61 persen dari 138.011 ton pada tahun 2013 menjadi 158.171 ton pada tahun 2013.
Pada tahun 2014 nilai impor produk peternakan senilai US$ 3.813,51 juta (Tabel 4.3) atau mengalami peningkatan sebesar 20,11 persen dibandingkan impor tahun 2013 yang bernilai US$ 3.175,01 juta (Tabel 4.2). Peningkatan tersebut berasal dari impor ternak yang meningkat sebesar US$ 340,64 juta (99,75 persen) dari impor tahun 2013.
Dari sisi volume, impor peternakan pada tahun 2014 sebanyak 1,491 juta ton, atau mengalami peningkatan sebesar 7,03 persen dibanding v olume impor tahun 2013 sebesar 1,393 juta ton. Peningkatan ini diantaranya disebabkan peningkatan impor ternak sebesar 89,10 persen dari 130,5 juta ton pada tahun 2013 menjadi 246,8 juta ton pada tahun 2014.
Neraca ekspor–impor peternakan pada tahun 2013-2014 masih mengalami defisit (nilai impor lebih besar daripada nilai ekspor). Defisit neraca ekspor–impor peternakan dalam kurun waktu 2013-2014 mengalami peningkatan sebesar 24,88 persen dari defisit sebesar US$ 2.583 juta pada tahun 2013 menjadi defisit sebesar US$ 3.225,7 juta pada tahun 2014. Jika pada tahun 2013 rasio ekspor terhadap impor senilai 1: 5,36 maka pada tahun 2014 rasionya meningkat menjadi 1: 6,49
PENJELASAN TEKNIS
1. Data ekspor – impor diperoleh dari hasil pengolahan data ekspor – impor yang dikeluarkan oleh Badan Pusat Statistik (BPS).
2. Data ekspor – impor dikelompokkan dalam beberapa jenis komoditas/ternak, sehingga diperlukan pengelompokan Harmoni Sistem (HS) yang sejenis.
Statistik Peterna kan da n Keseha tan Hewa n 2015
EXPORT – IMPORTIn 2014, ex port value of livestock products was US$ 587.80 million (Table 4.3), or decreasing by 0.70 percent compared to the 2013 export value that was US$ 591.95 million (Table 4.2). Such decrease mostly derived from the livestock export that decrease by US$ 7.49 million (10.18 percent) of exports in 2013. Another kind of export that decrease was non-food animal products which decreased by US$ 5.98 million (4.37 percent) of exports in 2013.
In term of volume, the livestock export in 2014 was 235,390 tons, or increasing by 6.91 percent from the export volume in 2013 that was 220,183 tons. Such increase was partly due to increase in the livestock product export by 14.61 percent from 138,011 tons in 2013 to 158,171 tons in 2013.
In 2014 the v alue of livestock product imports was US$ 3,813.51 million (Table 4.3) or increasing by 20.11 percent compared to the 2013 imports value amounting to US$ 3,175.01 million (Table 4.2). Such increase was mainly derived from livestock imports that increased US$ 340.64 million (99.75 percent) of imports in 2013.
In term of volume, the livestock import in 2014 was 1.491 million tons, or increasing by 7.03 percent compared to the import volume in 2013 that was 1.393 million tons. Such increase was partly due to an increase of livestock imports by 89.10 percent from 130.5 million tons in 2013 to 246.8 million tons in 2014.
The balance sheet of livestock exports and imports in 2013-2014 were still deficit (import value is greater than export value). The import-export livestock deficit in the period 2013-2014 has increased by 24.88 percent f rom a deficit amounting to US$ 2,583 million in 2013 to a deficit amounting to US$ 3,225.7 million in 2014. If in 2013 the export to import ratio was 1: 5.36, then in 2014 its ratio increased to 1: 6.49.
TECHNICAL EXPLANATION
1. The export - import data were obtained from the processing of import - export data issued by the Central Bureau of Statistics (BPS).
2. The export - import data are grouped into several types of commodities / livestock, co that a grouping of similar Harmony System (HS) is required.
Statistik Peterna kan da n Keseha tan Hewa n 2015
47
Grafik4.1 Volume Ekspor Dan Impor Sub Sektor Peternakan Tahun 2012-2014
Graph Export And Import Volume of Livestock Sub Sector Year 2012-2014
Grafik
4.2 Volume Ekspor Sub Sektor Peternakan Tahun 2014
Statistik Peterna kan da n Keseha tan Hewa n 2015
48
Grafik
4.3 Volume Impor Sub Sektor Peternakan Tahun 2014
Statistik Peterna kan da n Keseha tan Hewa n 2015
49
B. Hasil Ternak/Livestock Product 131.116.150 187.120.236 409.266.108 1.327.452.743
1 Daging 4.093.512 18.934.613 44.753.899 177.352.380
D. Obat Hewan/Veterinary Medicine 394.485 22.337.241 1.086.429 46.652.140
1 Vaksin untuk obat hewan 344.777 4.899.335 848.106 31.755.902
2 Reagen berasal dari mikroba, dari jenis yang cocok untuk diagnosis biologis veteriner 18 1.119 2.522 107.496
3 Lain-lain 49.690 17.436.787 235.801 14.788.742
5 Produk yang dapat dimakan berasal dari hewan 410.419 153.580.921 9.289 631.750
6 Produk hewani lainnya 7.097 18.755 6.131.897 5.994.972
F. Jumlah/Total 202.979.839 572.930.002 1.215.551.095 2.643.559.925
Statistik Peterna kan da n Keseha tan Hewa n 2015
B. Hasil Ternak/Livestock Product 138.010.895 186.917.332 451.283.160 1.655.887.217
1 Daging 4.684.802 22.579.693 60.591.614 265.692.113
D. Obat Hewan/Veterinary Medicine 535.784 12.468.199 1.367.830 53.952.497
1 Vaksin untuk obat hewan 454.697 6.297.427 1.166.706 38.897.728
2 Reagen berasal dari mikroba, dari jenis yang cocok
5 Produk yang dapat dimakan berasal dari hewan 541.552 153.394.659 9.403 635.646
6 Produk hewani lainnya 334 11.345 5.751.867 6.616.853
F. Jumlah/Total 220.183.032 591.946.301 1.393.439.339 3.175.010.679
Statistik Peterna kan da n Keseha tan Hewa n 2015
51
B. Hasil Ternak/Livestock Product 158.171.211 220.734.038 489.252.853 1.892.712.476
1 Daging 4.732.749 23.887.035 112.359.182 462.752.376
D. Obat Hewan/Veterinary Medicine 568.253 11.106.199 1.114.600 46.730.356
1 Vaksin untuk obat hewan 486.256 7.079.379 916.453 34.206.405
2 Reagen berasal dari mikroba, dari jenis yang cocok
5 Produk yang dapat dimakan berasal dari hewan 637.102 128.367.391 5.890 341.676
6 Produk hewani lainnya 523 36.892 8.673.377 9.719.688
F. Jumlah/Total 235.390.353 587.798.244 1.491.414.235 3.813.508.941
S
1. Ekspor/Export 202.979.839 572.930.002 220.183.032 591.946.301 235.390.353 587.798.244
a Ternak/Livestock 35.398.668 62.212.499 36.677.227 73.609.519 32.281.636 66.119.151
b Hasil Ternak/Livestock Product 131.116.150 187.120.236 138.010.895 186.917.332 158.171.211 220.734.038
c Produk Hewani Non Pangan/Non-food Animal Products 11.024.326 123.783.836 10.922.905 136.730.179 7.425.276 130.750.962
d Obat Hewan/Veterinary Medicine 394.485 22.337.241 535.784 12.468.199 568.253 11.106.199
e Lain-lain/Others 25.046.210 177.476.190 34.036.221 182.221.072 36.943.977 159.087.894
2. Impor/Import 1.215.551.095 2.643.559.925 1.393.439.339 3.175.010.679 1.491.414.235 3.813.508.941
a Ternak/Livestock 101.419.187 286.129.582 130.528.912 341.508.842 246.835.703 682.150.187
b Hasil Ternak/Livestock Product 409.266.108 1.327.452.743 451.283.160 1.655.887.217 489.252.853 1.892.712.476
c Produk Hewani Non Pangan/Non-food Animal Products 56.487.077 444.469.322 59.782.744 480.126.673 60.000.912 576.614.897
d Obat Hewan/Veterinary Medicine 1.086.429 46.652.140 1.367.830 53.952.497 1.114.600 46.730.356
e Lain-lain/Others 647.292.294 538.856.138 750.476.693 643.535.450 694.210.167 615.301.025
3. Neraca (Ekspor-Impor) / Balances (Export - Import) (1.012.571.256) (2.070.629.923) (1.173.256.307) (2.583.064.378) (1.256.023.882) (3.225.710.697)
Sumber/Source : Badan Pusat Statistik/BPS-Statistic Indonesia