Numerical Modeling of Spherical Indentation
and Hardness Prediction
Nyoman Budiarsa1and X.J. Ren2
1Mechanical Engineering, University of Udayana. Bali, Indonesia
2School of Engineering, Liverpool John Moores University, Liverpool L3 3AF UK
ABSTRACT
Under an indentation, the material undergoes a complex deformation. One of the most effective ways to analyse indentation has been the representative method.The concept coupled with finite element (FE) modelling has been used successfully in analysing sharp indenters. It is of great importance to extend this method to spherical indentation and associated hardness system. One particular case is the Rockwell B test, where the hardness is determined by two points on the P-h curve of a spherical indenter. In this case, an established link between materials parameters and P-h curves can naturally lead to direct hardness estimation from the materials parameters (e.g. yield stress and work hardening coefficients). This could provide a useful tool for both research and industrial applications.In this work, FE model of spherical indentation has been developed and validated. An approach to predict the P-h curves from constitutive material properties has been developed and evaluated.An effective method in representing the P-h curves using a normalized representative stress concept was established. The concept and methodology developed is used to predict hardness (HRB) values of materials through direct analysis and validated with experimental data on selected samples of steel.
1. Introduction
Indentation test is an important materials testing method in which a sharp or blunt indenter is pressed into the surface of a material. It can be used to test brittle (e.g. Ceramics) and elasto-plastic (e.g. metals) (Giannakopoulos and Larsson, 1997; Ren et al., 2001; Pharr et al, 2010). One significant advantage of indentation is that it only requires a small amount of materials; this makes it very attractive for the characterisation of materials with gradient property where standard specimen is not readily available such asin situ orin vivotests (Fischer et al., 2007; Li B., 2010). However, indentation tests can be influenced by many factors (such as indenter shape, materials deformation around the indenter and experimental conditions, etc). These factors have to be carefully considered when using indentation method. The indentation process is in two forms. One is static hardness test, and one is continuous indentation tests. The hardness of materials is based on the resistance of a solid to local deformation. In the hardness tests (such as Hv, HK, HRB), a harder indenter is pressed into the specimen surface and the size of the permanent indentation formed can be measured to represent the indentation resistance (i.e. hardness of the material). In HRB tests, the hardness is measured using the depth difference at different loads. Recently developments has seen the great increase of continuous (or instrumented indentation tests). In continuous indentation, the behaviour of the material is represented by the load (P)-displacement (h) curves (P-h curves).
However, despite its wide use, the materials behaviour (represented by the hardness or P-h curves) are not explicitly linked with the constitutive material properties. Further work is required to be able to predict indentation resistance (P-h Curves and/or hardness) from constitutive materials parameters. On the other side, it is also of great significance to both research and practical use to explore the potential to use indentation data to predict the constitutive materials properties. It may potentially provide a quicker way for material parameter identification and applicable in situation where standard specimen is not available. Developments of both areas require a detailed understanding/program linking constitutive materials properties, P-h curve and hardness with both sharp and spherical indenters.
Under an indentation, the material undergoes a complex deformation forming deformation zones of different mechanisms. One of the most effective ways to analyse the indentation process has been the representative method (Tabor, 1951, Johnson, 1985, Dao et al, 2001). Earlier works showed that hardness can be related to the stress of the indented material, r, corresponding to a
representative strain, r, which represents the mean plastic strain after yielding. The concept
2. Experimental Detail
The material used were steel. The chemical compositions of materials are listed in Tabel 1.
Table 1. Chemical compositions of the materials.
Material Condition Element Composition (%)
C Mn P S Si, Ni
Carbon Steel Normalized at
900°C 0.1 0.5 <0.04 <0.05 0.100 0.01 0.10% C
and followed by a mayor loading (FM) =100. The hardness values is determined by the depth of
penetration spherical indenter loaded on test samples following equation (HR=130-(h1000
-h100)/0.002. Details of the original mechanism of testing can be found in the original patent of
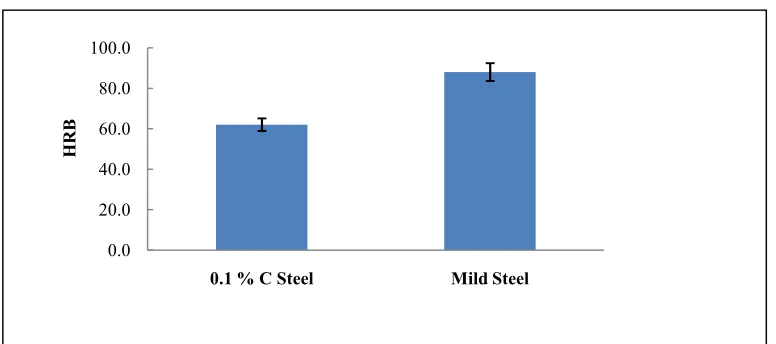
Rockwell (1924). Characteristics of indentation is determined by the penetration depth of spherical indenter loaded on the test sample. The machine is calibrated using a testing block, the variation of the hardness is within 5%. The average HRB values for two sample materials are shown in Figure 5.4. The Rockwell hardness B (HRB) identified for the 0.1% C is 62.0, and HRB for Mild Steel is 88.0. These HRB hardness data be used to validate the representative stress based hardness evaluation and property prediction program to be developed.
(a) (b)
Figure 1. (a)Typical Force-Displacement curve as results Tensile test for (a) 0.1 % Carbon Steel,(b)Mild Steel
(a) (b)
Figure 2. Typical Plastic stress strain data of the specimen (a) 0.1% Carbon Steel and (b) Mild Steel 0 2000 4000 6000 8000 10000
0 5 10 15 20 25
P(N ) h(mm) 0 2000 4000 6000 8000 10000 12000 14000
0.00 1.00 2.00 3.00 4.00
P(N ) h,mm 0 100 200 300 400 500
0 0.1 0.2 0.3 0.4
y (M pa ) plastic 550 570 590 610 630 650
0.00 0.01 0.02 0.03
y
(M
pa
)
Figure 3.Rockwell (B scale) hardness data of the specimen (minor load=100N, Maximum load =1000N).
3. Framework and Analysis 3.1.Material model
The power law description, almost used to approximate the plastic behaviour of metal material (Cao, 2004). A comprehensive framework using power law was developed earlier (Dao et al., 2001) in material model with reduce young modulus E*, within a specified range of material parameters has been indentified a representative plastic strain and used to normalize the loading curvature of material hardening exponent (n).
This work is concerned with elastic-plastic materials with a particular focus of steel, the stress-strain curves can be represented by Hooke s law and Von Misses yield criterion with isotropic power law hardening. Under those general conditions, the dependence of the true stress on the true strain is commonly expressed:
=
E for
for > (1)
=
σ ⁄ E for σ ≤ σ
σ ⁄ E
/
for σ > σ (2)
0.0 20.0 40.0 60.0 80.0 100.0
0.1 % C Steel Mild Steel
H
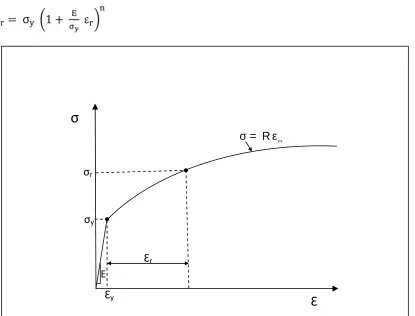
Where E is the Young s modulus, n the strain hardening exponent and the initial yield stress at zero offset strain. Figure 4. Shown a schematic elastic plastic stress strain curve of power law material used in this work. If r is a particular plastic strain point, the stress at the point representative stress,r. At this plastic strain point, the stress can also be expressed as:
σ = σ 1 + ε (3)
Figure 4.Schematic elastic plastic stress strain curve of power law material and representative stress concept
3.2 Numerical Model
Axial symmetric 2-D space FE models were constructed to simulate the indentation response of elastic plastic solids using the commercial FE code ABAQUS, are shown in Figure 5. Model was used due to the symmetry of the spherical indenter. The indenter was assumed to be rigid body as it is much harder than the indented material. The type element of the material is standard axial symmetric element: CAX4R and CAX3 (4-node bilinear asymmetric quadrilateral and 3-node linear asymmetric triangle element). The movement of the indenter was simulated by displacing a rigid arc (rigid body) along the Z axis. In the model, the sample size can be changed to ensure that the sample is much larger than the indenter radius/contact area during the indentation to avoid potential sample size and boundary effects (Johnson, 1985). The thickness and width of the model used is 3mm in both side. The bottom line of the model was fixed in all degree of freedoms (DOF) and the central line was symmetrically constrained. The model used a free mesh controlling only the key areas, this allow implementing the mesh size in the ABAQUS .rpy file. RPY file is a relatively new feature of ABAQUS, the use of this enables greater control
E
y
y r
r
of mesh size on key areas without the need of reapplying the mesh control in the CAE file. A gradient meshing scheme has been developed for different regions. The simulation performed as mimicking the actual circumstances on experimental, while the spherical indenter models used R= 0.79 mm, and specimen model used young s modulus = 200 G Pa, Poisson ratio = 0.2 and material plastic input data are to be used as input to the FE model include a carbon steel (0.1% C Steel) and mild steel. The mesh size is 10 m in the region underneath and around the indenter, while the mesh of other regions used single bias with bias element number 33 and ratio 5 to obtain gradient mesh tightly into underneath and around the indenter to improve the accuracy of the model. In the Spherical FE model the indenter considered as a rigid body to improve the modelling efficiency (in this case to reduce the computational time required to complete the model). A predefined displacement was applied on indenter and the reaction force is recorded on the reference point, representing the overall load on the indenter. The results of simulations FE model Spherical establish will produce p-h curve (Force-Indentation depth). The Spherical FE Model developed were validation with analytical solution of elastic material base of relationship using a known analytical solution (Johnson,1985) for indentation of linier elastic materials.
=
.
.
(4)Where is the reaction force, is the indenter radius; E and v is the Young s modulus and Poisson s ratio of material, respectively. is the indentation depth
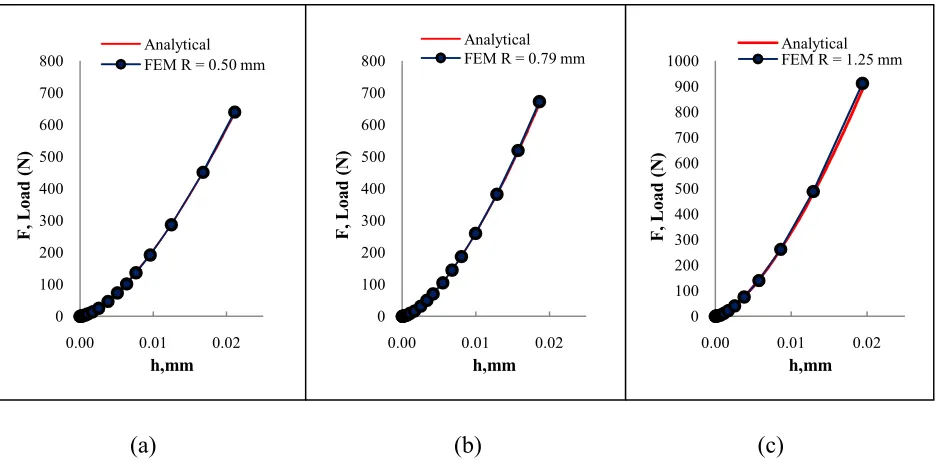
As shown in the Figure 5. visible the trend analysis in accordance with the numerical force displacement data simulation FE Model and resulting using the following analytical. This indicates a statistically curve fitting the data equally well and the FE model is congruous with the analytical model. The correlation coefficients between these two curves using a least square regression method is within 99.9%.
(a) (b) (c)
Figure 5.Comparison between the FE numerical force displacement data and analytical solution with elastic material model. (a) R=0.5mm; (b) R=0.79 mm; (c) R=1.25mm.
0 100 200 300 400 500 600 700 800
0.00 0.01 0.02
F, L oa d (N ) h,mm Analytical FEM R = 0.50 mm
0 100 200 300 400 500 600 700 800
0.00 0.01 0.02
F, L oa d (N ) h,mm Analytical FEM R = 0.79 mm
0 100 200 300 400 500 600 700 800 900 1000
0.00 0.01 0.02
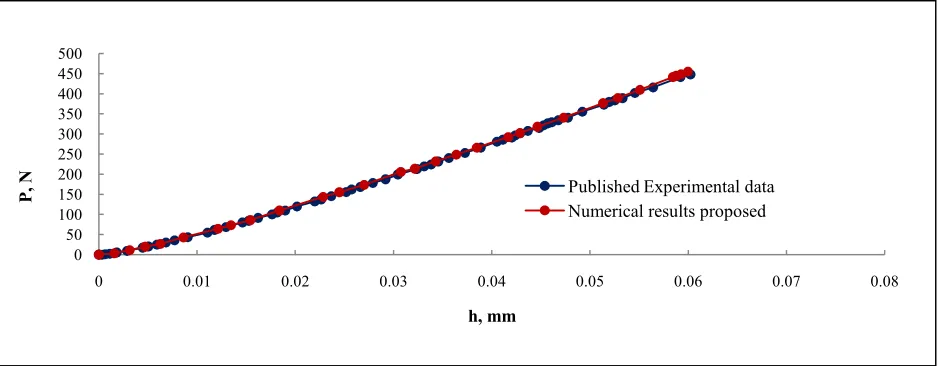
The FE spherical model was further validated by comparing the P-h curve with an elastic-plastic material model and published result data (Kucharski and Mroz, 2001). In the FE model, the material properties used were depicted directly from the published work. As shown in Figure 6
the numerical results showed good agreement with the experimental data, which suggests that the FE model is valid and the results are accurate.
Figure 6. Comparison of numerical results with published experimental data (Kucharski et al., 2001) of indentation with a spherical indenter (R=1.25 mm) showing the validation of FE model with elastic-plastic materials.
3.3 Full curve fitting approach and results
A Comprehensive parametric study using procedure developed was conducted representing the range of parameters of mechanical behaviour found in common engineering metals. Poisson s ratio was fixed at 0.3, Young modulus E=200 GPa, the yield strength (σ
)
100 to 900 MPa, andstrain hardening from 0.0 to 0.3. The results of simulations with FE model Spherical establish will produce p-h curve. After evaluation of several approaches, two approaches have been found to be effective in representing the curves with adequate/acceptable accuracy.Figure 7shows the two approached proposed. The first method is to use second order polynomial fitting in the form of:
P=C1h2+C2h (5)
The second fitting approach to be explored to represent the curve is using the force at different indentation depths. Most continuous machine can be depth controlled, and the representative stress is known to be depth dependent (angle dependent), so this potentially can be used as a more robust method. If the correlation between the force at different depth and the constitutive material properties and/or the representative stress is established, then the full P-h curve can be determined. This potentially can provide an effective way and physically meaningful way by using the power of computer simulation as large set of data has to be processed.
0 50 100 150 200 250 300 350 400 450 500
0 0.01 0.02 0.03 0.04 0.05 0.06 0.07 0.08
P,
N
h, mm
For spherical indenter, the angle changes with the increasing depth, no fixed representative strain is readily available. However, in general, based on the deformation mechanism of an indentation process, the material deformation is controlled by the elastic deformation and the yielding, so we propose to use an effective representative stress which potentially could be linked to the C1 and C2 parameters, thus representing the full P-h curve. In the equation, C2 is linear term in the
equation, so the fitting was conducted directly associating C2 to E/r, this term represents the
balance of elastic and plastic properties. Plots the C2vs. E/rwith different representative strain
for C2. It clearly shows that there is a reasonable correlation between these C2 and E/r, and the
fitting is influenced by the representative strain used. At a representative strain of 0.01 the fitting is reasonable with the best correlation coefficient.
C2= 3566.9 (E/r)0.855 (6)
Theoretically, C1 is a second order coefficient, so it could potentially be linked to the
representative stress follow the C1/rvs E/r according to Eq. 5 and Eq. 6, But the results is not
very good with a effective representative strain of 0.07. Other strain level has been explored the results were equally not satisfactory. So a physical based hypothesis has been evaluated. From energy point of view, the resistance to indentation consists of elastic resistance and plastic resistance. The nonlinearity and linearity of the curve should reflect a balance between elastic deformation and plastic deformation, which can be represented by E/r.
The relationship directly between C1 and E/r, has been explored with different representative
strains. . The fitting are much better than that for fitting between C1/r vs E/r. Comparing the
correlation with different representative strains, the most effective reference strain is 0.07, which give an equation of
C1= 3606.8 (E/r )(-1.252) (7)
The correlation coefficients is over 93%. Further increasing or decreasing of the representative strains shows no improvement in correlation of the fitting. So this is the value in predicting the P-h curves to evaluate its accurate
With the relationship between C1and C2withr, the P-h curve can determined with a known set
of material properties (yield stress and work hardening coefficients). In each figure (a-c), the predicted P-h curves using the representative stress full curve fitting approach (solid line) and Finite element data (symbols) was plotted together. In each case, the comparison is in a reasonable agreement.
3.4 Depth based P-h curve fitting approach and results
strain can be determined and a full P-h curve can be constructed.Figure 7 shows the force data at different depth plotted against E/r. The data for each depth was based on evaluation of series representative strain values similar to the process used for the Cv, C1and C2. The optimum strain
at h0.01 is 0.05, h0.02 is 0.01, h0.05 is 0.033, h0.075 is 0.02 and h0.1 is 0.045. These equations for each depth can then be used to predict the point on the P-h curves.
Figure 7. The relationship between forces at different depth and E/r.
Figure 8shows the comparison of the force at different depth between these approaches. In most of the cases, the prediction showed a reasonable agreement with the original FE data. The same procedure has been applied to many different material properties, the level of agreement between the prediction an the FE data is similar. This suggests that the full curve fitting approach and the depth method developed can be used in predict the P-h curves
(a).y=100MPa, n=0.2 (b)y=500MPa, n=0.3 (c)y=700MPa, n=0.2
Figure 8 Comparison between force at different depths (h=0.01, 0.02, 0.05, 0.075 and 0.10 mm) with different approaches.
0 50 100 150 200 250 300 350 400 450 FE C1 -C 2-ap pro ac h De pt h ap pro ac h
h=0.01 h= 0.02 h= 0.05 h= 0.075 h= 0.10
P(N
)
y = 34.745x-0.834, R² = 0.9907
y = 71.628x-0.853, R² = 0.9949
y = 166.02x-0.883, R² = 0.9920
y = 271.21x-0.93, R² = 0.9987
y = 327.11x-0.92, R² = 0.9952
0 500 1000 1500 2000 2500 3000
0.00 0.50 1.00 1.50 2.00
P (N ) E/ r h=0.010 h=0.020 h=0.050 h=0.075 h=0.100 0 200 400 600 800 1000 1200 1400 1600 1800 FE C1 -C 2-ap pro ac h De pt h ap pro ac h
h=0.01 h= 0.02 h= 0.05 h= 0.075 h= 0.10 P(N ) 0 200 400 600 800 1000 1200 1400 1600 1800 2000 FE C1 -C 2-ap pro ac h De pt h ap pro ac h
h=0.01 h= 0.02 h= 0.05 h= 0.075 h= 0.10
P(N
4. Conclusions
In this work, the relationships between constitutive materials parameters (y and n) of elasto-plastic materials, indentation P-h curves and hardness with spherical indenters has been systematically investigated by combining representative stress analysis and FE modelling using steel as a typical model material group. The main outcomes of work has formed a frame work of models to predict indentation P-h curves from constitutive material properties which has proven to be a useful tool for predicting the Rockwell hardness value (HRB)
In this work, FE model of Spherical indentation has been developed. The model was validated against published testing data. An approach to predict the P-h curves from constitutive material properties has been developed and evaluated based the relationship between the curvature and material properties and representative stress. Two new approaches to characterise the P-h curves of spherical indentation have been developed and evaluated. One is the full curve fitting approach while the other is depth based approach. In the full curve fitting approach, the relationship between an effective representative stress with the first and second order coefficients of a polynomial fitting line of the P-h was established. In the depth approach the relationship between force and representative stress with varying representative strain has been established. Both approaches were proven to be adequate/effective in predicting indentation P-h curves. The approaches (i.e. predict hardness from P-h curves) established was successfully used to produce hardness values of a wide range of material properties, which is then used to establish the relationship between the hardness values (HRB) with representative stress.
References
Cao Y. P., Lu J.,2004, A new method to extract the plastic properties of metal materials from an instrumented spherical indentation loading curve, Acta Materialia, 52, 4023 4032
Dao M., Chollacoop N., Van Vliet K. J., Venkatesh T. A. and Suresh S., 2001, Computational modelling of the forward and reverse problems in instrumented sharp indentation,Acta Materialia, Vol. 49, pp. 3899 3918
Fischer-Cripps A. C.,2007, Introduction to Contact Mechanics, Second Edition Edi, Springer Science + Business media, LLC,p 213
Giannakopoulos A. E. and Larsson P. L., 1997, Analysis of pyramid indentation of pressure-sensitive hard metals and ceramics,Mechanics of materials,Vol. 25, pp. 1-35.
Johnson K. L., 1985,Contact Mechanics, Cambridge: Cambridge University Press, UK,
Kang S., Kim J., Park C., Kim H., and Kwon D., 2010, Conventional Vickers and true instrumented indentation hardness determined by instrumented indentation tests, J. Mater. Res., Vol. 25, No. 2, Feb 2010.
Kucharski S. and Mroz Z., 2001, Identification of plastic hardening parameters of metals from spherical indentation tests,Materials Science and Engineering A,Vol. 318, pp. 65-76.
Pharr G. M., Herbert E. G., Gao Y., 2010, The Indentation Size Effect: A Critical Examination of Experimental Observations and Mechanistic Interpretations, Annu. Rev. Mater. Res. 40: 271-92
Ren X. J., Hooper R. M., Griffths C. and Henshall L. J., 2001, An investigation of the effect of indenter heating on the indentation creep behaviour of single crystal MgO, Journal of Materials Science Letters,Vol. 20, pp.1819-1821.
Ren X. J., Hooper R. M., Griffths C. and Henshall L. J., 2002, Indentation size effect (ISE) in single crystal MgO ,Philosophical Magazine A, Vol. 82(10), pp. 2113-2120.
Swaddiwudhipong S., Tho K. K. , Liu Z. S. and Zeng K., 2005a, Material characterisation based on dual indenters,International Journal of Solids and Structures, Vol. 42, pp. 69-83.
Tabor D., 1951, The hardness and strength of metals, Journal of the Institute of Metals,Vol. 79, pp. 1-18.
Numerical Modeling of Spherical
Indentation and Hardness
Prediction
by
I Nyoman Budiarsa
FILE
TIME SUBMITTED 10-JUN-2015 06:38PM
SUBMISSION ID 549495960
WORD COUNT 3918
CHARACTER COUNT 22111
12
%
SIMILARITY INDEX
7
%
INTERNET SOURCES
8
%
PUBLICATIONS
0
%
STUDENT PAPERS
1
3
%
2
2
%
3
1
%
4
1
%
5
1
%
6
1
%
Numerical Modeling of Spherical Indentation and Hardness
Prediction
ORIGINALITY REPORT
PRIMARY SOURCES
www.scientific.net
Internet SourceCao, Y.P.. "A new method to extract the plastic
properties of metal materials from an
instrumented spherical indentation loading
curve", Acta Materialia, 20040802
Publication
J. Luo. "A study on the determination of
mechanical properties of a power law material
by its indentation force–depth curve",
Philosophical Magazine, 7/1/2006
Publicationweb.mit.edu
Internet Source
www.k-state.edu
Internet Source
Bucaille, J.L.. "Determination of plastic
properties of metals by instrumented
7
<
1
%
8
<
1
%
9
<
1
%
10
<
1
%
11
<
1
%
12
<
1
%
13
<
1
%
Acta Materialia, 20030402
Publication
www.me.ust.hk
Internet Sourcescholar.lib.vt.edu
Internet Source
Chen, X.. "On the uniqueness of measuring
elastoplastic properties from indentation: The
indistinguishable mystical materials", Journal
of the Mechanics and Physics of Solids, 200708
Publication
Lan, Hongzhi, and T.A. Venkatesh. "On the
sensitivity characteristics in the determination
of the elastic and plastic properties of materials
through multiple indentation", Journal of
Materials Research, 2007.
Publication
Ilie Butnariu. "Computer Simulation of the
Solidification in Large Ingot with Respect to
Directional Segregation", EUROMAT 99,
04/20/2000
Publication
www.re-journal.com
Internet Source14
<
1
%
15
<
1
%
16
<
1
%
17
<
1
%
18
<
1
%
19
<
1
%
N_{2}", Physical Review A, 02/2011
PublicationChollacoop, N.. "Depth-sensing instrumented
indentation with dual sharp indenters", Acta
Materialia, 20030801
Publication
etd.lsu.edu
Internet SourceNoriaki Hirota. "Yield stress of duplex stainless
steel specimens estimated using a compound
Hall–Petch equation", Science and Technology
of Advanced Materials, 04/01/2010
Publication
Kermouche, G.. "Cone indentation of
time-dependent materials: The effects of the
indentation strain rate", Mechanics of Materials,
200701
Publication
www.ge.ce.nihon-u.ac.jp
Internet Source
N. A. Sakharova. "A Simple Method for
Estimation of Residual Stresses by
Depth-Sensing Indentation : Simple Method for
Estimation of Residual Stresses by
Depth-Sensing Indentation", Strain, 02/2012
20
<
1
%
21
<
1
%
22
<
1
%
23
<
1
%
24
<
1
%
25
<
1
%
Cao, Yan Ping, Xiu Qing Qian, Jian Lu, and
Zhen Han Yao. "An energy-based method to
extract plastic properties of metal materials
from conical indentation tests", Journal of
Materials Research, 2005.
Publication
Lee, J.. "Reverse analysis of nano-indentation
using different representative strains and
residual indentation profiles", Materials and
Design, 200910
Publication
www.me.sc.edu
Internet Source
Fang Wang. "Mechanical Properties
Measurement of Sand Grains by
Nanoindentation", Time Dependent
Constitutive Behavior and Fracture/Failure
Processes Volume 3, 2011
Publication
Yao, Weizhi. "Crystal plasticity study of single
crystal tungsten by indentation tests",
Universität Ulm. Fakultät für
Ingenieurwissenschaften und Informatik, 2013.
PublicationCao, Yanping, and Norbert Huber. "Further
investigation on the definition of the
EXCLUDE QUOTES OFF
EXCLUDE
BIBLIOGRAPHY ON
EXCLUDE MATCHES OFF