EXPLORING WEAK AND OVERLAPPED RETURNS OF A LIDAR WAVEFORM WITH
A WAVELET-BASED ECHO DETECTOR
C. K. Wang
Dept. of Geomatics, National Cheng Kung University, No. 1, University Road, Tainan, 701, Taiwan - [email protected]
Commission VII, WG VII/7
KEY WORDS: LIDAR, Detection, Algorithm, Simulation, Accuracy
ABSTRACT:
Full waveform data recording the reflected laser signal from ground objects have been provided by some commercial airborne LIDAR systems in the last few years. Waveform data enable users to explore more information and characteristics of the earth surface than conventional LIDAR point cloud. An important application is to extract extra point clouds from waveform data in addition to the point cloud generated by the online process of echo detection. Some difficult-to-detect points, which may be important to topographic mapping, can be rediscovered from waveform data. The motivation of this study is to explore weak and overlapped returns of a waveform. This paper presents a wavelet-based echo detection algorithm, which is compared with the zero-crossing detection method for evaluation. Some simulated waveforms deteriorated with different noises are made to test the limitations of the detector. The experimental results show that the wavelet-based detector outperformed the zero-crossing detector in both difficult-to-detect cases. The detector is also applied to a real waveform dataset. In addition to the total number of echoes provided by the instrument, the detector found 18% more of echoes. The proposed detector is significant in finding weak and overlapped returns from waveforms.
1. INTRODUCTION
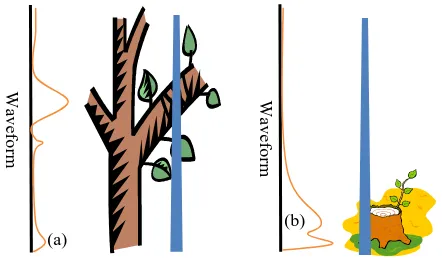
Studies have demonstrated that an airborne LiDAR system (ALS) can provide accurate estimation of topographic surfaces. An important application is for exploring some key characteristics of a forest such as canopy height, vertical distribution, above-ground biomass, leaf area indices and terrain models (Pirotti, 2011). Most of papers, however, have shown that LiDAR data underestimates the canopy height (Chauve et al., 2009). The reason is explained that only a small proportion of laser pulses interacting with the tree apices. Low point density of tree tops results in underestimation of tree heights. Another tricky problem is to classify the ground points in a complex forest area. Usually when a laser emits into a forest area, only some of the laser energy is scattered back by the tree tops. The other energy penetrates through and is reflected by branches, shrubs and the ground. The received echo scattered by the ground could be too weak to being detected (Figure 1 (a)). Additionally if scatters are separated around the range resolution of the instrument, for example, the terrain and shrubs, an ALS will produce a waveform composed of a superposition of echoes. The overlapped echoes are difficult to resolve and usually only an uncertainty point located between the terrain and shrubs is detected (Mallet and Bretar, 2009) (Figure 1(b)). The terrain height represented by this point will be a slight higher than the true terrain. Fortunately, thanks to the development of LiDAR technology, the laser scanner systems with full waveform digitizing capabilities have become available. Compared with the conventional LiDAR system, waveform LiDAR further encodes the intensity of the reflected energy along the laser lighting path. Users now can utilize the waveforms for the interpretation of ground objects and develop their methods to detect the effective return echoes. This gives us a great opportunity to improve the canopy height estimation and terrain model if an approach which can deal with the weak and overlapped echoes is obtained.
Figure 1. Interpretation of difficult-to detect echoes, (a) weak echo due to the loss of laser energy, (b) overlapped echoes due to the scatters separated around the range resolution of systems.
The purpose of this study is to explore extra return echoes in waveform data, especially weak and overlapped echoes which are not detected in the online process of an ALS. However, weak echoes are difficult to detect due to the low signal-to-noise (SNR), and overlapped echoes are also hard to resolve because they are synthesized signal. To deal with this problem, one has to extract signals from a waveform that is composed of echo signals and data noises. This paper proposes a wavelet-based detector for the solution. The detector first applies a wavelet transform (WT) to decompose a LiDAR waveform in terms of elementary contributions over dilated and translated wavelets, and then searches possible echoes in the wavelet coefficients (WC) at a certain scale. Using the WT of a LiDAR waveform enables us to detect the echoes at various scales and to suppress the noises simultaneously(Shao et al., 1998). The detector detects all possible return echoes from a waveform signal. Focused on the detection of weak and overlapped echoes, our analysis aims at how much signal strength relative to noise and
(a) (b)
W
av
ef
o
rm
W
av
ef
o
rm
how far two overlapped echoes separated will influence the detection results.
2. WAVELET-BASED ECHO DETECTOR
The wavelet transform is a tool to decompose a signal in terms of elementary contributions over dilated and translated wavelets. One of the continues wavelet transform(CWT) applications is resolving overlapped peaks in a signal(Jiao et al., 2008). The CWT at time u and scale s can be represented as
, ,
( , ) , u s ( ) u s( )
Wf u s f ψ ∞ f tψ t dt
−∞
= =
∫
(1)where f(t) is the input signal,
denotes the complex conjugate,,( ) u st
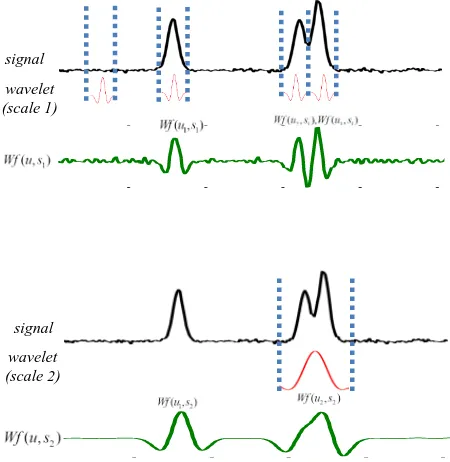
ψ is the wavelet function controlled by a scale factor s and a translation factor u. Wf(u, s) is the so called wavelet coefficients. Applying CWT to the waveforms can be considered as measuring the similarity between the waveform and the wavelets. If the chosen mother wavelet and the responded echo are similar in shape, then the locations where WC peaks occur imply the positions of the response echo in the waveform. Figure 2 shows an example of detecting echoes using the wavelet-based detector. A signal(waveform) is applied wavelet transform at two scales. Consequently we can obtain the WC (��(�,�1),��(�,�2)) at each scale. Taking the result at the smaller scale �1 firstly, one can see that the locations where the WC peaks (��(�1,�1),��(�2,�1),��(�3,�1)) occur corresponding to the positions of echoes in the waveform. However for the case of larger scale�2, only two echoes are detected. This can be explained that the expanded wavelet cannot “see” the echoes whose size is smaller than the wavelet itself.
Figure 2. the interpretation of detecting echoes by CWT.
Since the wavelet can be scaled by a scale factor, the wavelet-based detector is able to deal with different system with variant echo width, for example, the echo width is 5 ns for Leica ALS60 system and 8 ns for Optech ALTM 3100. Therefore to
optimize the detection results, an appropriate mother wavelet and a scale factor need to be prior determined. Many researches have considered the responded echo as a Gaussian function. For this reason the Gaussian wavelet is chosen as the mother wavelet in our study. Additionally by exploring some waveform samples, the scale parameter can be determined according to detection results.
3. EXPERIMENT AND RESULTS
3.1 Waveform simulation
A received waveform is a power function of time and can be expressed as follows (Wagner et al., 2006; Mallet et al., 2010): value varied by range between sensor and target. Eq. (2) indicates that a return echo is the convolution of system waveform and the apparent cross-section of a scatter. Wagner et al.(2006) have reported that the system waveform of Riegl LMS-Q560 can be well described by a Gaussian model. If the apparent cross-section of a scatter is assumed to be of Gaussian function, then the convolution of two Gaussian curves gives again a Gaussian distribution. The received waveform ��(�) can be rewritten as:
2 Gaussian function is chosen to simulate the return echo. The simulated waveform can be represented as follows:
1 which can be represented by full width at half maximum (FWHM =2√2��2�). Figure 3 shows an example of a simulated
Figure 3. An example of a simulated waveform
3.2 Procedure of echo detection algorithm
Figure 4 shows the algorithm of detecting echoes by the wavelet-based detector. For comparison, the zero-crossing(ZC) detector is also utilized. The idea of ZC is to find zero crossings of the first derivative of waveforms as the location of echoes. Normally a smooth filter would be applied to waveforms when adopting the ZC method since ZC algorithm is significantly suffered from noises. However the wavelet-based detector can directly process the raw waveforms without smoothing. Firstly several waveforms with variant SNR levels are generated (a) and then are input to the detectors (b). According to the algorithms, the detectors output the locations of detected echoes. One can see that some redundant echoes would be detected on both sides of the waveform due to the noises regardless of any detectors are applied (c). A condition is made that an echo whose intensity (amplitude) must be greater than 3��� in order to remove the fake echoes (d). Consequently the echoes pass the condition would be considered as efficient echoes and transformed into 3D point.
Figure 4. Flow chart of echo detection
3.3 Weak echo detection
To evaluate the power strength of return echoes, the signal-to-noise ratio is utilized:
2
10 2
( )
10 log ( )
noise
Peak of return echo
SNR dB
σ
= (6)
3.3.1 Set up: To test the ability of noise resistance between
the wavelet-based detector and the ZC detector, we generated the echoes start from 0 SNR value and then increased the SNR values by strengthening the power of echoes. At each SNR level, 1000 waveforms are generated. Therefore the percentage of successful detection accuracy can be calculated by:
number of detecting 1 echo CR1: 100%
1000 number of detecting 0 echo MR1: 100%
1000
number of detecting more than 1 echo RR1: 100%
where CR1 denotes the correct rate(CR) of detection, MR1 denotes the missing rate(MR) of detection, and RR1 denotes the redundant rate(RR) of detection.
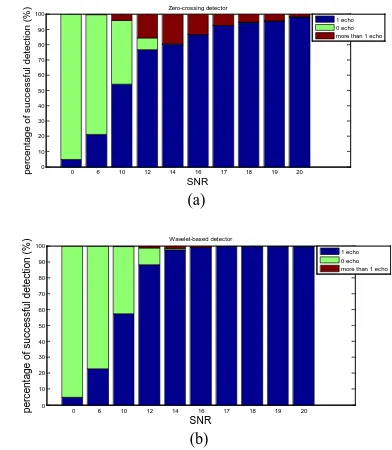
3.3.2 Results: Figure 5 shows the detection results of the
two detectors under variant SNR levels. Comparing the CR1 of the two detectors, the wavelet-based detector can reach to 100% more quickly than ZC detector. In addition the wavelet-based detector also produced less number of missing echoes. The two detectors have approximate results in producing the number of redundant echoes. Therefore the wavelet-based detector has better ability of noise resistance in the case of detecting single weak echo.
Figure 5. Results of echo detection, CR1: blue, MR1: green, RR1: red, (a) zero-crossing, (b) wavelet-based
3.4 Overlapped echo detection
In this section, we focus on the three factors (Figure 6): echo width (EW), the range between two echoes, and the relative intensity between two echoes (A2 / A1 in Figure 6), which have significant influences on resolving the overlapped echoes. The noises however are not taken into consideration in this test. From the results of section 3.3.2, an echo can be confidently detected by both of the detectors once its SNR vale exceeds 20 dB. In this experiment, the SNR value of each echo is set as at least greater than 32 dB so that the noises can be treat as no influence on the detecting results.
0 10 20 30 40 more than 1 echo 0 6 10 12 14 16 17 18 19 20 more than 1 echo
(a)
(b)
Figure 6. The factors related to the overlapped echo detection
3.4.1 Echo width and distance: The echo width of laser
signal changes according to variant LIDAR systems. Two different values of the echo width parameter corresponding to Leica ALS60 (5ns) and Optech ALTM3100 (8 ns) are utilized to test the influence on the detection results. Additionally when the distance between two echoes is close to the echo width, the synthesized echoes will approximate to single echo and are not easy to dissolve. To test how close distance of the two echoes can be dissolved by the detectors, some sets of the distance factor around the echo width value are used. As section 3.3.1, 1000 waveforms are generated at each distance level. The detection rate would be:
number of detecting 2 echo CR2: 100%
1000
number of detecting 1 echo MR2: 100%
1000
number of detecting more than 2 echo RR2: 100%
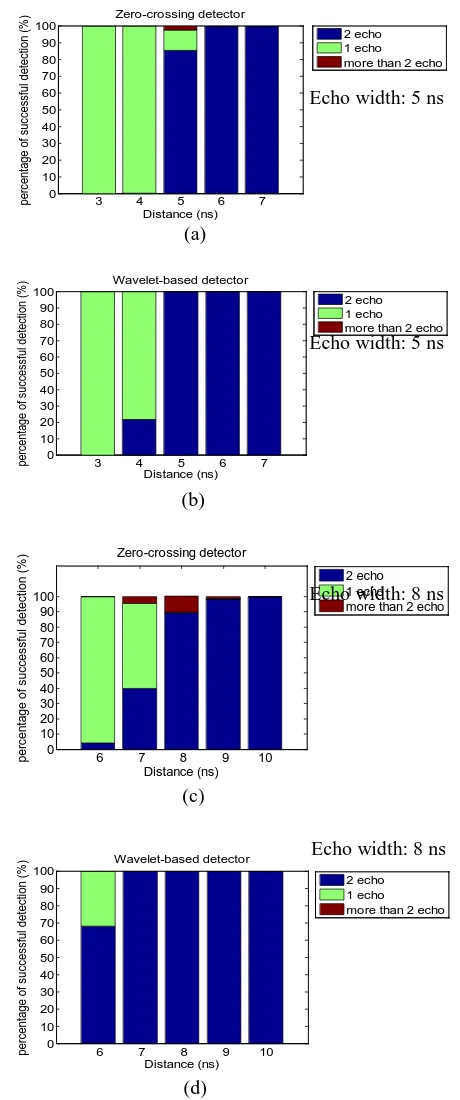
3.4.2 Results of the influence of the echo width and distance on detecting overlapped echoes: Figure 7 shows the
results of detecting the overlapped echoes with variant echo width and distance values. From Figure (a) and (c), the limitation of resolving overlapped echoes for zero-crossing detector is around an echo width. For wavelet-based detector, it can resolve two echoes which have distance less than an echo width if the echo width equals to 8 ns. Moreover the two echoes can be confidently detected by the wavelet-based detector in the condition that the distance is equal to the echo width. However some failures were produced by the zero-crossing detector.
3.4.3 Relative intensity ratio: Another factor related to the
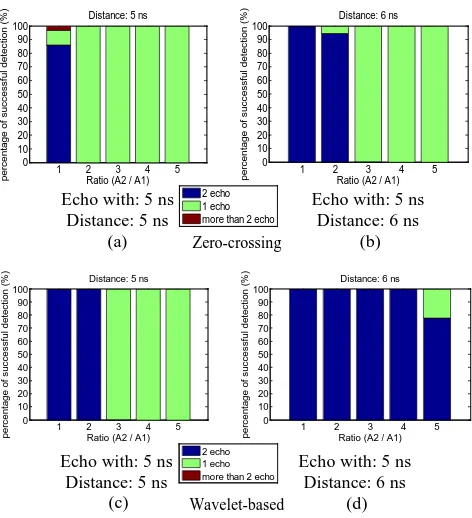
overlapped echo detection is the relative intensity between two echoes. Considering the results of section 3.4.2, the echo width factor is fixed as 5 ns and the distance factor is set as 5 ns and 6 ns respectively. The overlapped echoes with variant relative intensity ratio (A2/A1) were set up. And 1000 waveforms were generated at each relative intensity ratio level. The detection rate can be calculated by equation (8) as well.
Figure 7. Results of overlapped echo detection with variant echo width and distance values, CR2: blue, MR2: green, RR2: red,
(a)(c) zero-crossing, (b)(d) wavelet-based
3.4.4 Results of the influence of the relative intensity ratio on detecting overlapped echoes: Figure 8 shows the results
that how the relative intensity ratio factor influences the detection. It indicates that the wavelet-based detector has better detection accuracy than zero-crossing method especially when the distance is greater than the echo width. The wavelet-based detector can detect both of the echoes even the relative intensity ratio reach 4 if the distance between two echoes is greater than the range resolution of a LIDAR system.
0 5 10 15 20 25 30 35
1. EW: Echo Width
2. Distance: the
range between two echoes.
3. A1, A2: the
maximum amplitude of the two echoes more than 2 echo
3 4 5 6 7 more than 2 echo
6 7 8 9 10 more than 2 echo
6 7 8 9 10 more than 2 echo (a)
Echo width: 5 ns
(b)
Echo width: 5 ns
(c)
Echo width: 8 ns
Echo width: 8 ns
(d)
Figure 8. Results of overlapped echo detection under variant relative ratio cases. CR2: blue, MR2: green, RR2: red, (a)(b)
zero-crossing, (c)(d) wavelet-based
3.5 Real waveform data test
Figure 9 shows the study area where tall and shrubs plants grow irregularly. The real waveform data is captured by Leica ALS60 system. We chose the waveform data in the rectangle area shown in Figure 9 (a). The objective of this test is to see if the wavelet-based detector can effectively detect the weak and overlapped echoes so that the number of points increases obviously.
3.5.1 Set up: The results of simulated experiments can be
used as reference to set up the strategy of detecting echoes in real waveform data. From section 3.3.2 the wavelet-based detector can confidently detect the echoes if the SNR value of an echo is greater than 16. Therefore a threshold is set as a condition to remove the uncertain echoes which may be incorrectly detected due to the noises. To obtain the SNR value of each echo, the noises in the waveform needs to be estimated. Fortunately that there only exists noises in some interval of each waveform, the noises can be therefore easily estimated using these waveform sections without target echo information. Figure 10 shows the procedure of the wavelet-based echo detection method applied to a real waveform dataset.
3.5.2 Results:
The total number of waveforms is 459708 and the number of points provided by the instrument is 499997. Based on the wavelet-based detector, the number of detected points is 590074. It means that the detector increasingly found 18% more of the original number of echoes. This result shows that the ability of the proposed detector in finding weak and overlapped returns from waveforms. Figure 11 shows a side view of a selected profile drawn by the system points and the points extracted by our method respectively. One can see that the ground and the trees can be better described by the point clouds extracted by our methods.
Figure 9. (a) the study area, (b) the point clouds colored by elevation in the rectangle area of (a).
Figure 10. Flow chart of the wavelet-based detection method
Figure 11. The side view of a selected profile. (a) points provided from the instrument, (b) points extracted from waveforms using the wavelet-based detector. The arrows show
some of the extra-points detected by our method.
1 2 3 4 5 more than 2 echo
1 2 3 4 5 more than 2 echo
1 2 3 4 5
4. CONCLUSION
This paper presents a wavelet-based detector to detect the responded echoes in LIDAR waveforms. Some simulated waveforms with noises are made to test the limitation of the detector. The detector treats an echo as an effective return only if its SNR exceeds a threshold. The experiments suggest that a weak echo can be detected as long as its SNR is greater than 16 dB. Normally an echo has SNR lower than 22 dB will be missed in the online process of an ALS. The experimental results also show that the detector can resolve two distinct scatters as long as the echoes are separated with a distance larger than the range resolution of the ALS. In addition to the analysis on simulated data, the detector has also been applied to a set of waveform data captured with Leica ALS60 for a forested mountainous area. In addition to the total number of echoes provided by the instrument, the detector increasingly found 18% more of the original number of echoes. This result shows the ability of the proposed detector in finding weak and overlapped returns from waveforms. These extra echoes can potentially be used to improve the estimation of canopy height and ground surface for a forested area.
REFERENCES
Chauve, A., C. Vega, S. Durrieu, F. Bretar, T. Allouis, M. Pierrot Deseilligny and W. Puech, 2009. Advanced full-waveform lidar data echo detection: Assessing quality of derived terrain and tree height models in an alpine coniferous forest. International Journal of Remote Sensing 30(19), pp. 5211-5228.
Jiao, Long, Suya Gao, Fang Zhang and Hua Li, 2008. Quantification of components in overlapping peaks from capillary electrophoresis by using continues wavelet transform method. Talanta 75(4), pp. 1061-1067.
Mallet, Clement and Frederic Bretar, 2009. Full-waveform topographic lidar: State-of-the-art. ISPRS Journal of Photogrammetry and Remote Sensing 64(1), pp. 1-16.
Mallet, Clement, Florent Lafarge, Michel Roux, Uwe Soergel, Frederic Bretar and Christian Heipke, 2010. A Marked Point Process for Modeling Lidar Waveforms. IEEE Transactions on Image Processing 19(12), pp. 3204-3221.
Pirotti, F, 2011. Analysis of full-waveform LiDAR data for forestry applications: a review of investigations and methods. iForest - Biogeosciences and Forestry 4(1), pp. 100-106.
Shao, Xueguang, Wensheng Cai and Peiyan Sun, 1998. Determination of the component number in overlapping multicomponent chromatogram using wavelet transform. Chemometrics and Intelligent Laboratory Systems 43(1-2), pp. 147-155.
Wagner, W., A. Ullrich, V. Ducic, T. Melzer and N. Studnicka, 2006. Gaussian decomposition and calibration of a novel small-footprint full-waveform digitising airborne laser scanner. ISPRS Journal of Photogrammetry and Remote Sensing 60(2), pp. 100-112.