COLOR AND TEXTURE INTERPOLATION BETWEEN ORTHOIMAGERY AND
VECTOR DATA
C. Hoaraua∗, S. Christophea
a
Institut National de l’Information G´eographique et Foresti`ere - Laboratoire Cogit, Universit´e Paris-Est, 73 avenue de Paris, 94165 Saint-Mand´e cedex, France
(charlotte.hoarau, sidonie.christophe)@ign.fr
Commission II, WG II/6
KEY WORDS:geovisualization, style, color, texture, interpolation, smooth transition
ABSTRACT:
Graphic interfaces of geoportals allow visualizing, sometimes overlaying often by image blending, various data and representations of geographical spaces: vector data, maps, aerial imagery, Digital Terrain Model (DTM), etc. After some previous works it appears that image blending is insufficient to allow efficient co-visualization of orthoimagery and vector data. Our purpose is to be able to manage an hybrid visualization of orthoimagery and vector data, efficient and useful. The diversity of hybridization levels requires to be able to control a continuum between such data. We thus have to propose rendering methods to mix heterogeneous data, in order to propose homogeneous and continuous intermediary representations. This paper proposes a methodology to interpolate graphic parameters between an orthoimage and related vector data, to control the level of orthophotorealism, all along the continuum. We detail the methodology based on several interpolation components, to control abstraction and realism levels, by manipulating colors and textures (natural, procedural or mixed).
1. INTRODUCTION
Geoportals and geovisualization tools provide various geograph-ical data, i.e. vector data, maps, aerial imagery, Digital Terrain Model (DTM), immersive views, etc., and various ways to co-visualize them. We define the co-visualization of data as the si-multaneous visualization of two or more various data or graphic representations, together, in a same visualization interface. Fig-ure 1 presents three examples of co-visualizations of various data based on various types of interface tools: integration of histori-cal photographs in Google Street View1, swap between satellite image and historical map in a lens2and finally, swipe between a satellite image and a related raster representing temperature esti-mation3.
Figure 1: Co-visualizations of geographical data
Nevertheless, parallel visualization is a current trend, but implies some difficulties to maintain the visual attention. Our purpose is thus to overlay and blend those data in a same view to facilitate the users’ tasks. Therefore it requires to be able to manage the heterogeneity of data in order to visually integrate data together. Heterogeneity concerns color contrasts, visualization scales, gen-eralization levels, geographical content or temporality, amongst
∗Corresponding author
1
http://www.whatwasthere.com/browse.aspx#/ll/44.563649,-123.262465/id/75061/info/sv/zoom/14/
2
http://www.smithsonianmag.com/history/what-did-chicago-look-great-fire-180947929/?no-ist
3
http://earthobservatory.nasa.gov/IOTD/view.php?id=81562
others. In parallel, we consider that visualizing heterogeneous data together enhances also the specificity and the relevancy of data, by complementing each other. Users may benefit from these hybrid visualizations of heterogeneous data, while better visualiz-ing and understandvisualiz-ing geographical phenomena in a geographical space.
Our long-term research issue is to find the balance between the need for preprocessing data steps and the call for rendering tech-niques adaptation. These challenges both aim at improving map efficiency, and thus map quality. We also aim at exploring photo-realistic and non-photophoto-realistic rendering techniques in order to increase the realism of maps and to interrogate the effect of this realism on map quality. Orthoimagery provides an idea of realism through a direct visualization of objects of the real world, in their completeness, related to the time of capture: users actually take more and more advantage of orthoimagery in mashups, websites, cartographic and augmented reality applications (Hoarau, 2012). Vector data provide a symbolized geometric representation of ob-jects of the real world, associated to attributes, as a result of many abstraction processes. Hybrid visualizations of orthoimages and vector data would be an efficient way to add (ortho)photorealism to abstract data. Plus, the diversity of possibilities to manage this level of realism encourages us to provide an interactive contin-uum of intermediary visualizations between an orthoimage and related vector data. Our purpose is to preserve a homogeneous visualization all along the continuum, regarding the level of real-ism (Hoarau, 2015).
In such a context, we face the difficulty to find relevant graph-ics parameters and rendering methods to propose a continuous transition between an orthoimage and vector data, while control-ling the level of (ortho)photorealism. Therefore, we suggest to interpolate color and texture between an orthoimage and related vector data.
be-tween orthoimagery and vector data in Section 3. We present and discuss the result of the application of our methodology on a dataset to design a continuum between an orthoimage and its related vector data in Section 4. Further work is addressed in Section 5.
2. RELATED WORK
Medley and Haddad (2011) present the notion of continuum as ’a series of pictures, iteratively reduced in representation from its referent’, based on photographs, drawings, sketches, etc. Au-thors notice that ’images of greater realism help to solve the ho-mogeneity problem: distinguishing objects in the same class (, whereas) images of reduced or distilled detail facilitate object hy-potheses: distinguishing between classes of objects.’. Providing a style continuum between an orthoimage and vector data, based on photorealism, is a research problem related to four types of research works: first, the design of methods to adapt color con-trasts, second, the user perception of realism in various types of maps based on heterogeneous data, third, the way to add photo or non-photorealism in visualizations, and fourth, the interaction methods to control realism/abstraction levels.
2.1 Adapting the color contrasts
Hoarau (2012) demonstrates that using image blending to overlay orthoimagery and vector layers is insufficient to allow efficient co-visualization, when layers are both transparent. Overlaying orthoimagery and vector data is mainly addressed as an issue of by-default colors mixing, requiring to handle the resulting color contrasts. Raposo and Brewer (2013) propose a global symbol-ization method for vector data, based on colored outlines and dot-ted lines, adapdot-ted to any backgrounds map or imagery. This so-lution is likely to make the concerned vector data, e.g. roads in general, very salient in order to be always legible regarding to the background. Hoarau et al. (2013) propose an automated adaptive method to symbolize each edge of roads, with the complementary color of the dominant color of the orthophotography below: the variation of colors is not salient and help to preserve a suitable color contrasts all along roads edges. This method will be used at every intermediary step of the continuum to manage color con-trasts well in intermediary hybrid visualizations. Nevertheless, in order to handle continuous transitions all along the continuum, colors should be also interpolated between each end of this con-tinuum. The issue of colors of orthoimagery and vector data is thus at stake here: do they convey orthophoto-realism or not?
2.2 Perceiving realism in visualizations
The efficiency of co-visualized data, and in particular the percep-tion of realism in maps, has been evaluated by visual experimen-tation. Wilkening and Fabrikant (2011) evaluate how different map types can influence people’s visuo-spatial decision making, specifically for a complex slope detection task involving three spatial dimensions: as a result, the authors highlight that while people might prefer more realistic looking maps, they do not nec-essarily perform better with them. Bernab´e-Poveda and C¸ ¨oltekin (2014) assess that there is a correlation between a cartographic task and the realism level of the representation. They highlight a limit of the understanding of geographical phenomenon between several representations is the case of the relief perception: carto-graphic shading and natural shading are incompatible. Bernab´e-Poveda and C¸ ¨oltekin (2014) quantify empirically this relief inver-sion phenomenon on orthophotographies, according to user pro-files and location on Earth. According to these results, it would be relevant to add realism, and in particular orthophoto-realism, in abstract visualizations, to benefit from its advantages while com-bining it with abstraction advantages.
2.3 Adding realism in visualizations
In order to take advantage of heterogeneous data, some authors exploit the user perception of realism to propose more realist maps based on photorealism or non-photorealism techniques. For instance, natural color maps are investigated by (Patterson and Kelso, 2004), relief realism is based on its enhancement by il-lumination in (Patterson, 2002), by watercolorization on oblique views in (Jenny et al., 2015) or by synthetic vectorial textures in (Loi et al., 2013) ; water surfaces are rendered by realist textures (Patterson, 2002), animated textures in (Yu et al., 2011), by ex-pressive renderings in (Semmo et al., 2013). The use of textures, procedural or coming from the orthoimage should be thus rele-vant to manage realims in our continuum.
2.4 Interacting with data and realism/abstraction levels
Semmo et al. (2012),Semmo et al. (2013) and Semmo and D¨ollner (2014) propose to use parameterization of rendering methods to make progressive transitions between various levels of abstrac-tion: various strategies to distribute the level of abstraction in the representation according to the distance from the image center or the saliency of rendered objects (Semmo et al., 2012), river rendering according to more or less cartographic styles (Semmo et al., 2013), more or less complex textures according to scene depth and expected abstraction level(Semmo and D¨ollner, 2014). Biljecki et al. (2014) propose metrics to describe the level of de-tail that are used to make discrete scales of level of dede-tail. Bektas and C¸ ¨oltekin (2012) and Bektas et al. (2015) aim at reducing the level of detail in imagery with a technique called ’geofoveation’. Authors identify the area of interest of the user in acquiring gaze points with an eyetracker, e.g. the focus zone, and remove per-ceptually irrelevant detail in the visual field, e.g. the context zone: details are removed from the periphery based on a model of the foveal vision. Another way to manage the visual attention of the user is to generate masks according to relevant geographical ob-jects and scene depth and highlight specific obob-jects as soon as the user perceives them (Trapp et al., 2011) .
In such a context, we aim at reaching continuity and homogene-ity between orthoimagery and vector data, while managing the level of orthophoto-realism. The interaction mode is proposed to be a slider to handle the continuum between an orthoimage and vector data. The problem addressed in the paper is related to the visualization design and rendering aspects. Our purpose is to in-terpolate graphic parameters between one end (an orthoimage) to another (related vector data), in order to control the level of pho-torealism, by manipulating homogeneously colors and textures (natural, procedural or mixed).
3. METHODOLOGY
Our methodology is based on three steps.
First, we identify relevant visual characteristics in the orthoim-age, as a graphic inspiration source. We consider it conveys real-ism, that could be mixed with abstraction all along the continuum, based on its natural color and texture.
Third, we provide a set of interpolation methods. Each interpo-lation method generate interpolated values for one of the graphic characteristics of in-between representations. Those methods can be used independently and combined to create a graphic path from one representation to another, for instance orthoimagery and vector data.
3.1 Relevant visual characteristics inspired by orthoimagery
Relevant visual characteristics to be interpolated are those which have an important visual impact within cartographic visual vari-ables: the color and the texture of the cartographic objects. We first suggest to define and extract natural color and texture from orthoimagery, and then to generate various types of textures, in-spired by orthoimagery, to handle realism levels.
3.1.1 Color Our color extraction method aims at extracting the main natural color for each cartographic theme coming from orthoimagery. We assume that objects of a theme have similar colors in the reality and in consequence in orthoimages. Using cartographic data allows to identify object footprints: these ob-jects have been grouped regarding their nature and their proper-ties. Binary masks are created from vector layers and used to cut the orthoimagery out. The color is then extracted for each mask thanks to the color classification method described in (Christophe et al., 2013). The figure 2 provides an example of the extraction of the natural color of the buildings: the natural color extracted here reflects the color of the building roofs.
Figure 2: Buildings’ natural color extraction
3.1.2 Texture The texture has been defined as a graphic vi-sual variable by Bertin (1967). This vivi-sual variable consists in the repetition of a small pattern. Regarding hybrid visualization and covisualization methods, we propose an extension of this con-cept in order to take into account orthoimagery background lay-ers and photorealistic rendering textures. A texture can be neu-tralif object are symbolized by plain colors,proceduralif the texture comes from a procedural rendering algorithm,naturalif the texture comes from a picture or an orthoimage of the objects, ormixedif the texture is both procedural and neutral. These four categories are illustrated in figure 3).
Figure 3: Our texture typology.
In consequence, we can modify several graphic parameters to ma-nipulate all types of texture.
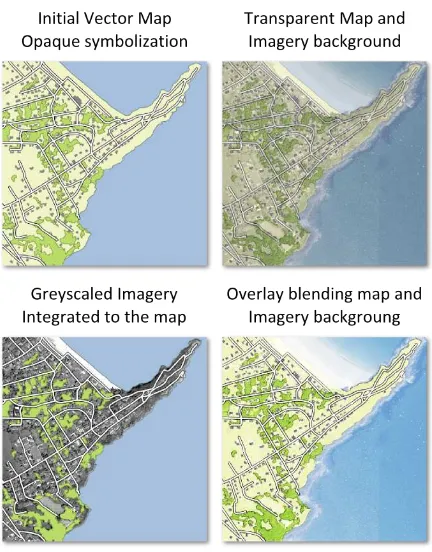
Natural textures The natural texture is a visual characteristic that allows increasing the realism of the representation. In order to obtain the natural texture of an orthoimage, we can modify the
opacity level of the imagery, convert it in greyscale or render it with different blending modes.
Considering that a vector layer is overlaid to an orthoimage, mod-ifying the opacity of the vector layer will make appear the natu-ral texture of the orthoimage. Another way to convey the nat-ural texture of the orthoimagery is to convert the orthoimagery in greyscale. This rendering method allows to manipulate in-dependently the natural texture and colors of the orthoimagery. Finally, blending modes can be used to blend colors of overlaid vector data with the natural ones of the orthoimagery. We use theOverlay modedescribed by (Porter and Duff, 1984) because it preserves highlights and shadows of the background by reflect-ing the lightness or darkness of the backdrop color when mixreflect-ing them with the overlaid color. The figure 4 illustrates these dif-ferent methods to extract the natural texture of the imagery and reinject it in the map design process.
Figure 4: Natural texture extraction and reinjection methods.
Procedural textures In order to find controllable pivot param-eters, we use realistic rendering methods to introduce progres-sively realistic characteristics of the imagery texture. Such rdering methods provide a realistic appearance to the user and en-able the cartographers to manipulate independently the color, the scale, the amount, the angle of the texture. A Perlin Noise texture provided by (Perlin, 1985) has been used in this paper. In order to define two colors for the Perlin texture, we decide to choose natural color from orthoimage and color from the related vector data. The figure 5 presents the final texture obtained by mixing the plain light green of the map and the dark and complex tex-ture of the imagery. It can now be used as a perfect controllable pivot symbolization during interpolation. The scale of the nat-ural texture have been chosen to reflect the natnat-ural scale of the vegetation.
Figure 5: An example of procedural texture.
Our relevant visual characteristics, color and texture, have thus been described in this paragraph. In order to manage them, we have now to consider their elementary design parameters.
3.2 Graphic parameters matching
The style of each end of a continuum is described as symbolizers in the SLD standard (Lupp, 2007). For vector data, each symbol-izer contains several graphic parameters such as the color and the opacity of the fill and the stroke. The symbolization of raster data are described by a specific raster symbolizer.
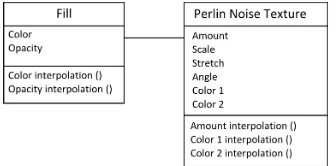
3.2.1 SLD expressivity extended for texture manipulation
In order to be able to manage our different types of textures, we propose an extension of the fill description, in adding graphic pa-rameters describing procedural texture characteristics: amount, scale, stretch, angle and colors required to describe a Perlin noise texture (Cf. figure 6).
Figure 6: SLD extension for Perlin noise Texture description
3.2.2 SLD intermediate media to match continuum end styles
An interpolation method requires an intermediate media, aiming at storing all the graphic parameters required for the description of both continuum end styles. We first match graphic parame-ters of our two ends of the continuum, e.g. the color of their fill. All of these common graphic parameters are then added to the SLD intermediate media. Second, we add the graphic parameters that only appear in one continuum end style. These new graphic parameters are associated with an opacity parameter, in order to be able to manage their visibility along the continuum in case of non bijection between continuum end styles. The SLD inter-mediate media parameters have first empty values. These values are filled in by the style interpolation methods detailed in next section. These values thus change continuously from one inter-mediate representation to another.
3.3 Styles interpolation methods
In order to provide a style continuum evolving regularly, a linear interpolation function given by equation 1 has been used for all interpolation of graphic parameters.
f : R → R
x 7→ f(x) = ya −yb
xa−xb
·x+xa
·yb−xb·ya
xa−xb
(1) wheref(x)is the interpolated value at the interpolation step given byx, and (xa,ya), (xa,ya) the coordinates of the end parameters.
3.3.1 Color interpolation The color interpolation is done in the CIELab color space. This color space provides a perceptually uniform color space (CIE, 1976). In this color space every color can be defined by three coordinates: its lightness L and two chro-matic coordinates, a between red and green, and between yellow and blue. We apply the linear interpolation function (Cf. equa-tion 1) to these coordinates of the color in order to create a contin-uous color range. The perceptual consistency allows us to ensure the regularity of the perception regarding color evolution along the color range: the distance between two colors is consistent re-garding the perception thanks to our color space choice and all the colors are equidistant in the range thanks to our interpolation function choice. The figure 7 shows a color range interpolating purple and green. Eighteen equidistant colors have been extracted from the range and are presented above and under the range in or-der to illustrate the color evolution regularity.
Figure 7: Color ramp generation by interpolation
We give here three examples of this color interpolation applied to geographical data and map design symbolization methods.
Between two maps based on colors The first example con-sists in interpolating every color theme of a vector data or map. Continuum ends come from (Christophe and Hoarau, 2012). The color interpolation is done independently for each vector theme. So far, there is no design constraint aiming at guaranteeing that intermediate representations convey the same semantic relation-ships than ends’ representations.
Figure 8: Color specification interpolation
Figure 9: Simple color interpolation of Perlin noise texture
If the two colors of the procedural textures to be interpolated are different, the interpolation is done by two steps, using a pivot symbolization created with a color of both ends’ textures: in the figure 10, the first color is interpolated between light green and dark green (on the right) and the second color is interpolated be-tween white and yellow (on the left).
Figure 10: Double color interpolation of Perlin noise texture
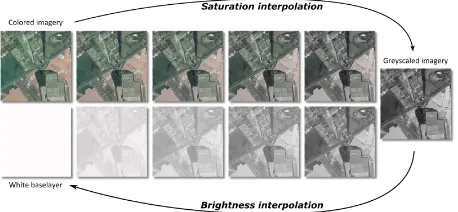
Between two baselayer rasters The third example aims at cre-ating a graphic path between two possible base layers: a white baselayer and an orthoimage. The interpolation is made in two steps in order to manipulate separately the color and the natu-ral texture of the imagery. In consequence, the imagery is first converted in greyscale and then the color of every pixel is inter-polated first from its natural color to the greyscaled one and sec-ondly from the greyscaled color to white. The figure 11 shows interpolation result samples.
Figure 11: Baselayer interpolation process.
3.3.2 Texture interpolation As we said in paragraph 3.1.2, several graphic parameters allows to modify a texture of a sym-bolized object. We describe here how the opacity of a natural texture and the amount of a procedural texture can be interpo-lated to create graphic paths between texture and non textured representations.
By opacity The first parameter that allows to control a natu-ral texture is the opacity. This parameter is widely defined be-tween 0 and 100. So, we just interpolate the value regarding the position along the continuum to create intermediate transparent styles. The figure 12 illustrates four intermediate opacity interpo-lations. As the representations have an imagery background, its natural texture appears more or less depending on the opacity of the overlaid vector data.
The opacity parameter can also be used to manage the appearance or disappearance of the related symbolizer, when only one end of the continuum contains it. For example, in order to interpolate the style between buildings symbolized with outlines and build-ings symbolized without outlines, the opacity of the outlines is interpolated in the matched intermediate symbolization.
Figure 12: Opacity interpolation of overlaid vector data
By procedural texturing The amount parameter of a procedu-ral texture is interpolated in order to make appear or disappear the rendered texture. Figure 13 shows a texture range where the amount is interpolated between a plain light green style and a Perlin noise texture style.
Figure 13: Amount interpolation of a Perlin noise texture
4. RESULTS AND DISCUSSION
This section presents a continuum of styles between orthoim-agery and vector data.
4.1 Dataset
The dataset is a cartographic vector database and related orthoim-ages. The visualization scale of the cartographic vector database is from 1:15000 and 1/25000. We use six themes from this database: buildings, hydrography, vegetation, roads, contour lines and to-ponyms. The background layer is also manipulated. Orthoim-ages have a sufficient resolution to be visualized at similar scales as the cartographic database.
4.2 Style interpolation for one cartographic theme
We illustrate here how we can combine several graphic parame-ters of styles, in order to create a graphic path between the light green plain style of the vegetation on the map and the repre-sentation of the vegetation in the imagery. We use five pivot symbolizations and six symbolization interpolation components. This combination comes from a user test described in Hoarau (2015). The resulting graphic path presented in figure 14 in-troduces color and texture evolutions. A Perlin noise texture is used between plain color symbolizations and natural textures, as a semi-realistic symbolization of the vegetation. The transparency is also used to browse all the categories of our texture typology and make evolve the realism perception along the continuum of vegetation symbolizations.
Figure 14: Vegetation symbolization interpolation using several interpolation components.
4.3 Style interpolation for a geovisualization, theme by theme
Roads’ symbolization interpolation Three different compo-nents are used to interpolate roads’ symbolizations. Each of these three components interpolates the color between the bright colors of the map and the natural grey extracted from the imagery. This combination allows controlling the abstraction coming from the administrative categorization of roads in the map.
Buildings’ symbolization interpolation The abstract catego-rization is controlled with a similar combination of interpolation components than for the roads. Three color interpolation com-ponents are used simultaneously to interpolate between abstract colors of the map and the natural red extracted from the roofs in the imagery. Moreover, the natural texture of the roofs is manip-ulated independently by an opacity interpolation components.
Hydrography symbolization interpolation The natural color and texture of the hydrography are manipulated independently, by two different interpolation components. A color interpolation component makes the hydrography evolve between the light blue of the map and the dark blue extracted from the imagery. More-over, the natural texture of the see is manipulated independently by an opacity interpolation components.
Vegetation symbolization interpolation The complex combi-nation described in the previous paragraph is used to make the vegetation symbolization evolve from the map abstract one and the imagery realistic one.
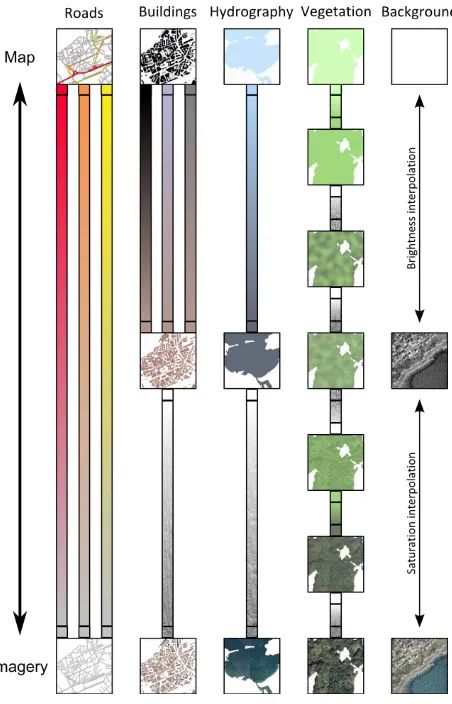
Background layer interpolation Finally, the symbolization of the background layer evolves according to the process described in figure 15.
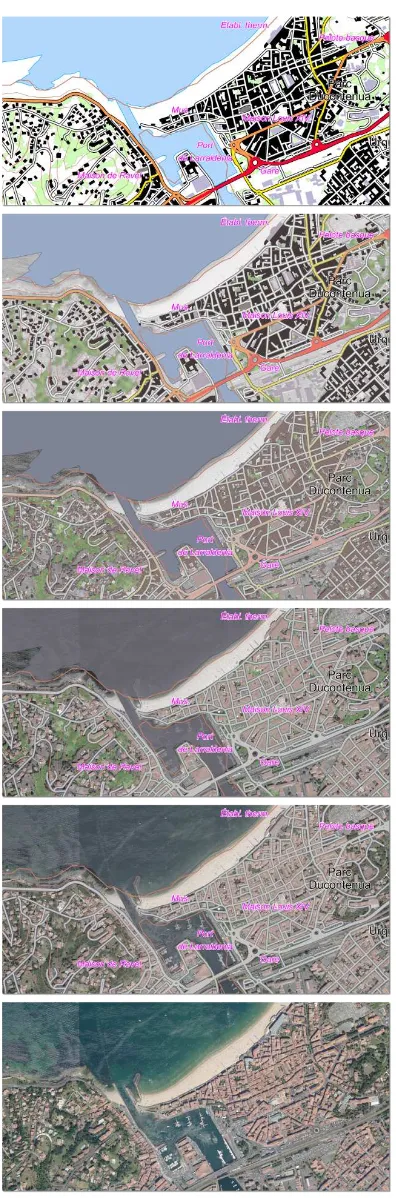
The figure 16 introduces the ends’ representations of our contin-uum and four intermediate representations created by using the interpolation components of figure 15.
4.4 Discussion
Our method provides design control to the cartographer and en-ables him to create a continuous graphic path between two het-erogeneous representations. Interpolating graphic parameters in-dependently allows us to control the evolution of every theme of the representation. Indeed, the cartographer is able to choose one or several pivot symbolizations and the corresponding interpola-tion components. These components can be used simultaneously or consecutively. Thus, the method provides a wide range of sym-bolization designs to the cartographer. Our proposition between a map and an orthoimagery already used seventeen interpolation components and eight pivot symbolizations to define only five graphic paths. This complex combination shows the flexibility offered by our interpolation component-based method.
Nevertheless, the interpolation methods should be constrained to ensure the quality of each intermediate representation. Indeed, our proposition intends to allow the final user to choose the in-termediate representation to be displayed. We aim at making the users able to adapt the visualization to their need and their carto-graphic task. We also aim at providing them a continuous transi-tion in order to help to identify relevant objects of geographical structures from an end to the other. In consequence, the interpo-lation could be constrained for each intermediate representation in order to preserve the semantic relationships existing between the themes of the abstract end of our continuum. The interpola-tion methods could also be constrained along the continuum by previously fixing given intermediate representations, depending on the users needs and tasks.
Moreover, our combination highlights the mutual impact of the different interpolation components. For example, in the half part
Figure 15: Symbolization interpolation components and pivot symbolizations used to create our style continuum.
of the continuum close to the imagery side, two opacity interpo-lation components are used in order to make appear the natural texture of the see and buildings’ roofs. This opacity interpola-tion makes the background layer more or less visible. At the same time, a saturation interpolation component is used between a greyscaled imagery to a colored one. Consequently, the natu-ral color is coming from the pivot color of the sea in the middle of the continuum, from the imagery at the imagery end of the continuum and blended from those two layers in-between.
Figure 16: Final geovisualizations forming a continuum between a map and an imagery.
the contrast between these roads and their graphic context around coming from the orthoimage. This symbolization method can be used as a complementary component to the interpolation compo-nents proposed in this paper.
5. CONCLUSION
This paper addresses the problem of the interpolation between two styles of graphic representations of a geographical space, i.e. orthoimagery and vector data, making the control of the levels of realism and abstraction possible. The approach is based on rel-evant graphic parameters of both representations which are use-ful to manage realism and abstraction levels, i.e. color and tex-ture. We propose a method to create a set of hybrid visualiza-tions by mixing regularly heterogeneous geographical data. Our work contribute to improve image-based representation design by using imagery as a graphic inspiration source. We assume that transferring graphic characteristics of orthoimagery in map de-sign enables cartographers to create better hybrid visualizations. Finally, style continua created using our interpolation method are conceived as support for the navigation between heterogeneous visualizations in order to allow the user to browse several real-ism levels and representation styles. Therefore, our style con-tinua should improve focus+context interactive tools such as vi-sualization lenses presented by Karnik et al. (2009); Pindat et al. (2012), by providing locally parameterised transitions. Moreover, it could be interesting to increase this interaction allowing the user to customize the continuum by choosing pivot symboliza-tions and interpolation components.
Finally, we would like to apply those style interpolation meth-ods to other types of heterogeneous data: for instance, an inter-polation between an old map an its contemporary one would be interesting to highlight some design choices. The interpolation between two orthoimages, taken at two moments of time would be interesting also in order to make continuous temporal series for multiplexing interfaces. Interpolation methods will be improved to handle non-linear interpolation and to include constraints to make graphic parameters interpolating while taking into account visual or semantical relationships between geographical themes.
6. ACKNOWLEDGEMENTS
This work is partially supported by the French National Research Agency, MapStyle project [ANR-12-CORD-0025].
References
Bektas, K. and C¸ ¨oltekin, A., 2012. Area of Interest Based In-teraction and GeoVisualization with WebGL. In: Proc. of The Graphical Web Conference 2012, Z¨urich, Switzerland, September 11-14 2012.
Bektas, K., C¸ ¨oltekin, A., Kr¨uger, J. and Duchowski, A., 2015. Combined Visual Perception Models for Geographic Gaze Contingent Displays. In: Proc. of the 17th Annual Eurograph-ics Conference on Visualization (EuroVis), Cagliari, Sardinia, Italy, May 25-29 2015.
Bernab´e-Poveda, M.-A. and C¸ ¨oltekin, A., 2014. Prevalence of the terrain reversal effect in satellite imagery. International Journal of Digital Earth 0(0), pp. 1–16.
Bertin, J., 1967. S´emiologie graphique: Les diagrammes, Les r´eseaux, Les cartes. Mouton, Gauthier-Villars, Paris, France.
Biljecki, F., Ledoux, H., Stoter, J. and Zhao, J., 2014. Formali-sation of the level of detail in 3d city modelling. Computers, Environment and Urban Systems 48, pp. 1–15.
Christophe, S., Perret, J. and Hoarau, C., 2013. Extraction de palettes de couleurs pour l’aide `a la conception cartographique. Revue des Sciences et Technologies de l’Information (RSTI), S´erie Technique et Science Informatiques (TSI), Art et Infor-matique 32(3-4), pp. 145–152.
CIE, 1976. Commission Internationale de l’Eclairage Proceed-ings. Rapport technique, Cambridge University Press, Cam-bridge, England.
Hoarau, C., 2012. Orthoimage or map visualization in use in geoportals, Case study on the French Geoportal. In: Proc. of AutoCarto2012 Conference.
Hoarau, C., 2015. Repr´esentations cartographiques in-term´ediaires - Comment covisualiser une carte et une or-thophotographie pour naviguer entre abstraction et r´ealisme ? PhD thesis, Universit´e Paris-Est.
Hoarau, C., Christophe, S. and Musti`ere, S., 2013. Mixing, blending, merging or scrambling topographic maps and or-thoimagery in geovisualizations? In: Proc. of the 26th In-ternational Cartographic Conference (ICC’13), 25-30 August, Dresden, Germany.
Jenny, B., Buddeberg, J., Hoarau, C. and Liem, J., 2015. Plan oblique relief for web maps. Cartography and Geographic In-formation Science 0(0), pp. 1–9.
Karnik, P., Cline, D., Jeschke, S., Razdan, A. and Wonka, P., 2009. Route visualization using detail lenses. IEEE Transac-tions on Visualization and Computer Graphics 16(2), pp. 235– 247.
Loi, H., Hurtut, T., Vergne, R. and Thollot, J., 2013. Discrete texture design using a programmable approach. In: Proc. of ACM SIGGRAPH 2013 Talks, Anaheim, California, USA, SIGGRAPH’13, ACM, New York, NY, USA, pp. 43:1–43:1.
Lupp, M., 2007. Styled layer descriptor implementation spec-ification. Open Geospatial Consorcium Document Number: OGC 05-078r4, Version: 1.1.0.
Medley, S. and Haddad, H., 2011. The Realism Continuum, Rep-resentation and Perception. The International Journal of the Image 1(2), pp. 145–156.
Ory, J., Christophe, S., Fabrikant, S. I. and Bucher, B., 2015. How do map readers recognize a topographic mapping style? In: Proc. of the 27th International Cartographic Conference (ICC’15), 23-27 August, Rio de Janeiro (Brazil).
Patterson, T., 2002. Getting Real: Reflecting on the New Look of National Park Service Maps. Cartographic Perspectives (43), pp. 43–56.
Patterson, T. and Kelso, N. V., 2004. Hal Shelton Revisited: De-signing and Producing Natural-Color Maps with Satellite Land Cover Data. Cartographic Perspectives (47), pp. 28–55.
Perlin, K., 1985. An image synthesizer. SIGGRAPH Comput. Graph. 19(3), pp. 287–296.
Pindat, C., Pietriga, E., Chapuis, O. and Puech, C., 2012. Jel-lyLens: content-aware adaptive lenses. In: Proc. of the 25th annual ACM symposium on User interface software and tech-nology, Cambridge, Massachusetts, USA, UIST ’12, ACM, New York, NY, USA, pp. 261–270.
Porter, T. and Duff, T., 1984. Compositing digital images 18 (3). In: ACM Siggraph Computer Graphics, ACM, pp. 253–259.
Raposo, P. and Brewer, C. A., 2013. Guidelines for Consis-tently Readable Topographic Vectors and Labels with Toggling Backgrounds. In: Proc. of the 26th International Cartographic Conference, 25-30 August, Dresden, Germany.
Semmo, A. and D¨ollner, J., 2014. Image filtering for interac-tive level-of-abstraction visualization of 3d scenes. In: Proc. of International Symposium on Computational Aesthetics in Graphics, Visualization, and Imaging (CAe), Anaheim, Cali-fornia, USA, pp. 5–14.
Semmo, A., Kyprianidis, J. E., Trapp, M. and D¨ollner, J., 2013. Real-Time Rendering of Water Surfaces with Cartography-Oriented Design. Proc. of International Symposium on Com-putational Aesthetics in Graphics, Visualization, and Imaging (CAe), Anaheim, California, USA, pp. 5–14.
Semmo, A., Trapp, M., Kyprianidis, J. E. and D¨ollner, J., 2012. Interactive Visualization of Generalized Virtual 3D City Mod-els using Level-of-Abstraction Transitions. Computer Graph-ics Forum, Proc. EuroVis 2012, Vienna, Austria, June 5-8 2012.
Trapp, M., Beesk, C., Pasewaldt, S. and D¨ollner, J., 2011. Inter-active rendering techniques for highlighting in 3d geovirtual environments. In: T. H. Kolbe, G. K¨onig and C. Nagel (eds), Advances in 3D Geo-Information Sciences, Lecture Notes in Geoinformation and Cartography, Springer Berlin Heidelberg, pp. 197–210.
Wilkening, J. and Fabrikant, S. I., 2011. How do decision time and realism affect map-based decision making? In: Proc. of the 10th international conference on Spatial Information The-ory, COSIT’11, Springer-Verlag, Berlin, Heidelberg.