COMPLEMENTARITY OF SAR POLARIMETRY AND TOMOGRAPHY FOR BUILDING
DETECTION AND CHARACTERIZATION.
O. D’Hondt, S. Guillaso, O. Hellwich
Computer Vision and Remote Sensing Group, Technical University of Berlin, Berlin, Germany {olivier.dhondt,stephane.guillaso,olaf.hellwich}@tu-berlin.de
KEY WORDS:SAR, polarimetry, tomography, object detection, segmentation
ABSTRACT:
In this paper we propose to study the potential of jointly using polarimetric and tomographic SAR data to recognize and localize buildings in complex scenarios. We present extraction methods for both polarimetric and tomographic features. One the one hand, we propose to use the polarimetric bilateral filter that has proved to be a powerful tool to retrieve the polarimetric covariance matrix while reducing speckle and preserving edges. Thus, polarimetric decompositions can be used for physical interpretation. On the other hand, the TomoSNI and TomoSeed algorithms allow to respectively extract interest points and segment geometric primitives in 3D point clouds obtained with tomographic focusing methods. We show how the output of such algorithms could be combined in order to allow the extraction of buildings. We also analyze different issues related to complex scenarios that may impede a correct detection and discuss some possible solutions.
1 INTRODUCTION
Polarimetric SAR systems provide useful information related to the backscattering mechanisms resulting from the interaction be-tween a polarized electromagnetic wave and physical media. Po-larimetric images are collected by emitting a series of electro-magnetic pulses and receiving backscattered signals through dif-ferent polarized antennae. Polarimetric decomposition methods (Cloude and Pottier, 1996) allow a physical interpretation of the different scattering mechanisms inside a resolution cell. Thanks to such decompositions it is possible to extract information re-lated to the intrinsic physical and geometrical properties of the imaged media.
SAR tomography is the extension of conventional two-dimensional SAR imaging principle to three dimensions and is achieved by the formation of an additional synthetic aperture in elevation, using a coherent combination of images acquired from parallel flight tracks. The introduction of tomographic SAR allows a direct lo-calization of all scattering contributions in a volume (Reigber and Moreira, 2000). This is performed either by FFT-based beam-forming or spectral methods such as Capon, MUSIC (Guillaso and Reigber, 2005) and the more recent CS (compressive sens-ing) (Zhu and Bamler, 2012).
In this paper, we use the high resolution MUSIC method (Guil-laso and Reigber, 2005) in order to detect scatterers associated to ground and buildings. Indeed, this method enhances the height estimation of objects.
We propose here to jointly use the information given by polarime-try and tomography in order to detect the presence of buildings in the scene. From a polarimetric point of view, it is potentially possible to detect points that belong to a building edge since they are characterized by a strong return. This may be performed by estimating the power (SPAN) of the polarimetric covariance ma-trix from a polarimetric SAR (PolSAR) image. In order to avoid false alarms due to speckle, the data has to be previously filtered by an adaptive method. Here, we propose to use the recently de-veloped bilateral PolSAR filter (D’Hondt et al., 2013) to extract speckle-free polarimetric features.
However, locating the facade of a building allows only a partial detection of the object. Distinguishing the roof is not possible
with polarimetry due to its scattering similarity with bare soil. However, thanks to tomography, it is possible to estimate the heights of the different scatterers present in the resolution cell. Furthermore, since parts of a roof can generally be approximated by a piecewise planar structure, it is possible to group all the pix-els belonging to such a structure to obtain a segmentation of the scene into geometric primitives.
To perform this challenging task, we propose to combine recent developments in point extraction, characterization and segmenta-tion of polarimetric and tomographic SAR data (Guillaso et al., 2012, D’Hondt et al., 2012).
Therefore, considering the fact that the facade pixels should be spatially close to the roof ones, using both polarimetric and tomo-graphic information should make it possible to retrieve the entire structure of the building, according to the simple representation facade/roof.
Our information extraction method is composed of three main steps:
• First, a statistical detection of interest points is performed. In fact, low SNR and phase calibration errors affect the per-formance of spectral methods, resulting in inaccurate lo-calization of scatterers and isolated points with no physical meaning. Spurious points can be successfully discarded by the method of (Guillaso et al., 2012) that uses a robust sta-tistical threshold detecting scatterers with a significant am-plitude.
• Then, a segmentation of building heights in terms of geo-metric primitives is performed to group pixels into piece-wise planar patches (D’Hondt et al., 2012). This method is based on region growing, is robust to outliers and allows an automatic adaptation to the local level of noise that is present in each of the structures to detect.
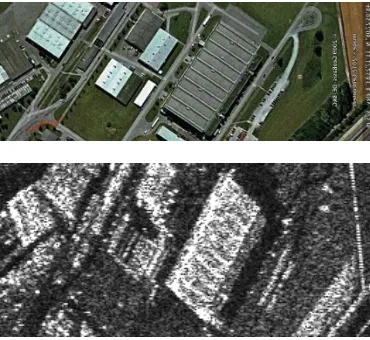
Figure 1: Optical image representing the test area (top), corre-sponding SAR intensity image (bottom).
double bounce scattering by the use of PolSAR decomposi-tion methods.
We present some experiments by applying our feature extraction to the POLTOM dataset provided by the DLR over the Oberp-faffenhofen that is composed of 14 fully polarimetric tracks in L-Band. While our feature extraction results are potentially promis-ing, we show that for the case of complex scenarios with interac-tions with multiple buildings and 45 degree orientation, polarime-try might not be sufficient to detect buildings and propose some possible further investigation.
2 PRESENTATION OF TEST AREA
Fig. 1 shows a manually selected area that we will use in our ex-periments. It has been extracted from the POLTOMSAR dataset that is composed of 14 fully polarimetric tracks in L-band and has been acquired by the ESAR sensor from DLR over the Oberpfaf-fenhofen area. The optical picture and the corresponding SAR in-tensity are shown. This area has been selected because it contains several buildings with complex structures and spatial proximity, that makes it challenging for detection algorithms.
3 EXTRACTION OF POLARIMETRIC FEATURES
3.1 Polarimetric SAR data
Polarimetric SAR systems measure the relation between the trans-mitted and received electromagnetic wave in two orthogonal po-larizations in the form of a scattering matrix (Lee and Pottier, 2009)
wherehandvdenote horizontal and vertical polarization, respec-tively. The reciprocity assumption in the mono-static case leads toShv =Svh. For analysing purpose, it is convenient to repre-sent this scattering information in the form of a target vector
kp=√1
2[Shh+Svv, Shh−Svv,2Shv]
T,
(2)
wherepdenotes the Pauli basis.
On distributed targets, this information is generally considered in a statistical framework. Under the fully developed speckle hy-pothesis, the target vectorskfollow a complex circulard-variate
Normal distribution (Goodman, 1963)
p(k) = 1
πd|Σ|exp
−k†Σ−1k, (3)
where|.|is the determinant of a matrix and†represents the con-jugate transpose of a complex vector. This distribution is charac-terized by its second order momentΣ = E[kk†]that contains information about power and relative phase between the polari-metric channels. When the scattering vector is expressed in the Pauli basis, the matrixΣ=Tis usually called coherency matrix although it is technically a covariance matrix.
Unfortunately,Σhas to be estimated from the data over several independent samples, resulting in a loss of spatial resolution. The sample covariance is expressed as
b
and is obtained by an operation calledmulti-lookingthat consists in taking the average of contiguous pixels.
Under this Gaussian hypothesis, the multi-look covariance matrix follows a complex Wishart density (Goodman, 1963). The esti-mation accuracy can be improved by increasing the number of samples. Unfortunately, increasing this number is only possible on homogeneous areas where pixels arise from identical scatter-ing mechanisms.
3.2 POLSAR Bilateral Filter
It has recently been shown (D’Hondt et al., 2013) that the PolSAR bilateral filter was a useful tool for the estimation of the covari-ance matrix from noisy data. In fact, this filter allows a high amount of speckle filtering in homogeneous areas and a good restoration of edges and deterministic scatterers while preserving the polarimetric information. The estimated covariance at loca-tionx0is computed by performing a weighted sum of the sample
covariance matrices at each positionxiinside a sliding window:
e
Σ(x0) = X
x
i∈W
wiΣb(xi). (5)
The weightswi are expressed by defining a similarity measure based on a matrix distanced(., .) where the functionfsandfrhave a Gaussian shape.
Since the covariance matrices lie on the manifold of Hermitian positive definite (HPD) matrices, recent studies showed it was natural to use appropriate distances (Pennec et al., 2006, Bar-baresco, 2009). An affine invariant metric has been proposed as a replacement for the Euclidean metric to deal with HPD matrices. The corresponding distance between two matricesΣ1andΣ2is (Barbaresco, 2009)
Figure 2: Pauli RGB representation of the original image (top) and the bilateral filtered one (bottom).
3.3 Polarimetric analysis
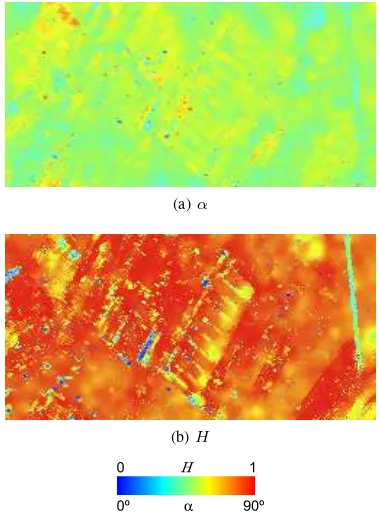
Fig. 2 shows the Pauli RGB representation of the original po-larimetric data and the results of applying the PolSAR bilateral filter. It may be observed that while allowing a strong reduction of speckle, the filter captures well the spatial properties of the scene allowing a significant visual enhancement. It may also be noticed that all the bright parts due to building facades are well preserved. In order to further analyze the polarimetric informa-tion, we have applied the widely used H/αor Entropy/Alpha decomposition to the filtered image. The entropy parameter is bounded between 0 and 1 and describes the random behavior of a target: ifH= 0the target is considered as purely deterministic and only one scattering mechanism is present inside the resolu-tion cell. On the contrary,H= 1means that the target is totally random and that 3 scattering mechanisms equally contribute to the pixel. This is generally the case with volume scattering due to vegetation. Theαparameter characterizes the type of domi-nant scattering mechanism and has a range from0(trihedral or surface) toπ/2radians (dihedral or double bounce). Fig. 3 show images of those parameters over the selected area. Finally, Fig. 4 show the SPAN image (the sum of the diagonal elements of the covariance matrix) extracted from the filtered image and the ex-tracted bright lines that are produced by the strong returns from building facades. The extraction of such lines is performed in two steps. First, following the observation of (Lee et al., 2009) that the strong intensities produced by deterministic scatterers corre-spond generally to a very small proportion of the pixels (typically
2−3%) we set a threshold corresponding to the 97-th percentile of the intensity of the image. The pixels above the threshold be-long to the bright structures. In order to keep only be-long lines, we then perform a connected component labelling and remove the segments that have less than 30 pixels. It can be seen that this allows to extract the bright line corresponding to the biggest building but it is not clear how the other extracted lines are re-lated to the other smaller buildings. This is due to the fact that the line/roof model is only valid for buildings with a very simple structure.
4 EXTRACTION OF TOMOGRAPHIC FEATURES
4.1 Tomographic focusing by SP-MUSIC
SAR tomography consists in focusing several SAR images in the third dimension, in order to image volumetric areas, such as
(a)α
(b)H
Figure 3: Images of theH/αparameters computed on the filtered image.
forests or cities. This means to form a synthetic aperture along the direction perpendicular to azimuth and to the radar line of sight. The geometry of a tomographic data acquisition uses typ-ically K parallel tracks non uniformly spaced, which observe the same scene. From the K images, 3D profiles might be extracted. This makes it possible to detect targets under covered volume or to generate 3D representation of the scene under study.
A tomographic data acquisition system is constituted byK sen-sors, or interferometric paths. The signalsxkreceived by each sensor kprovided byD scatterers localized at height{zd}D
d=1
are arranged in theK×1vectorx:
x=As+n (8)
wheresrepresents the backscattered power of theDscatterers andndenotes a vector formed by scalarnkrepresenting a circu-lar Gaussian white noise. TheAmatrix, with dimensionK×D, contains the phase response due to the sensor geometry only. This matrix is made up various vectorsa(zd)representing the steering vector, which corresponds to thed-th scatterer:
a(zd) = [eiφ1(zd)]· · ·eiphiK(zd)]T (9)
withφk(zd)denoting the phase caused by the distance between a scatterer at heightzdand antennak.
To focus such tomographic SAR data, the range of valid heights is scanned using the steering vectora(z)of (9). The power, esti-mated by the MUSIC method, is given by:
ˆ
PM(z) =
1
a†(Eˆ NEˆ†N)a
(10)
whereEˆNrepresents the noise subspace obtained after an eigen-decomposition of the observed covariance matrix,Rˆ =E ˆˆΛ ˆE†
(a) The SPAN image is computed.
(b) Bright lines are detected by thresholding.
(c) Small segments are removed.
Figure 4: Extraction of bright lines corresponding to building cor-ners.
The term pseudo-beamforming is employed here becausePˆM(z) is only usable to localize the target height but not to measure its backscattering power.
Figure 5: Reflectivity reconstruction using SP-MUSIC-1 (1 scat-terer assumed). Color corresponds to the height of the scatscat-terers. Note the presence of lot of artifacts, specially points located in the “air”. Data are represented in a ground range geometry.
Fig. 5 shows the point cloud of our test site. We notice the pres-ence of numerous artifacts that are due to low SNR, error in the orbit location, etc. Despite these artifacts, it is possible to clearly distinguish our 4 main objects: main building with roof structure, meadows, secondary building as well as the fence.
4.2 Selection of points: the TomoSNI algorithm
Artifacts generated during tomographic processing using SP-MU-SIC-1 are mainly due to the following factors:
• Low reflectivity, observed in the presence of roads, water,
shadowed areas.
• Wrong scatterer number assumption. Indeed, the
SP-MUSIC-1 will fail if we have mode than one scatterer per resolution cell.
• Orbit path estimation. Phases have to be calibrated during
the processing. Errors will arise when focusing far from the reference point.
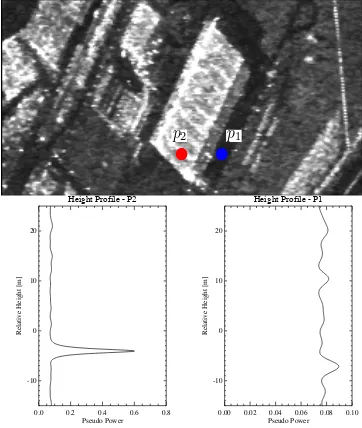
Height Profile - P1
0.00 0.02 0.04 0.06 0.08 0.10
Pseudo Power -10
0 10 20
Re
la
ti
ve
H
ei
ght
[m
]
Height Profile - P2
0.0 0.2 0.4 0.6 0.8
Pseudo Power -10
0 10 20
Re
la
ti
ve
H
ei
ght
[m
]
p1 p2
Figure 6: Top: Filtered SAR amplitude corresponding to the main building (1). p1 and p2 are located in blue and red re-spectively. Bottom: Pseudo-spectrum profile corresponding to
p2 and p1 illustrating the difference between a peak and back-ground noise.
Fig. 6 shows the height profile of two points (p1andp2) extracted form the main building.
In order to detect and remove such artifacts, we propose a signal-to-noise index (TomoSNI) (Guillaso et al., 2012) based on the height profile observation:
T omoSN I(x, y) = median PˆM(x, y)
max( ˆPM(x, y))
!
(11)
wherePˆM(x, y)is the pseudo-power over height given by (10). We calculate the median value of each normalized pseudo-spectrum and we select pixels where theT omoSN I < T is less than a thresholdT. The threshold is defined as follow:
T = median(T omoSN I) + MAD(T omoSN I) (12)
whereM ADstands for median absolute deviation. Up to now, this approach is only valid when one scatterer is present in the resolution cell.
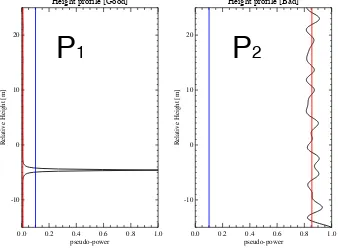
The proposed TomoSNI algorithm is illustrated in Fig. 7. The amplitude of the peak inp2is comparable to the noise level, while the amplitude of the peak inp1 is clearly higher. Fig. 8 shows the new point cloud distribution. Note that more than 95% of artifacts have been removed.
4.3 Primitive extraction: the TomoSeed algorithm
Height profile [Bad]
Figure 7: Normalized pseudo-spectrum forp1andp2. The red line indicates the median value for each spectrum and the blue line represents the threshold.
Figure 8: Reflectivity reconstruction after using the TomoSNI ap-proach. Color corresponds to the height of the scatterers. Data are represented in ground range geometry.
3D planes will be able to capture most of the present information. Moreover, even in the case of a non-planar structure, it is always possible to provide a piecewise planar approximation provided the local curvature is not too high. Grouping the points according to a parametric model is not only useful for detection, but it also naturally reduces noise present in the elevations due to phase er-rors and low coherence. Therefore, our method can also be used for reconstruction.
The TomoSeed algorithm (D’Hondt et al., 2012) takes advantage of the spatial connectivity of points in range/azimuth. In fact, tomograms retrieved with the MUSIC approach provide a high density of points. Many of those points are spatially connected in thex−yplane.
Our algorithm is composed of two main steps. The first one is calledseed selectionand collects all the samples contained in a 3D sphere of radiusRaround each point of the data set. For each potential initial ”seed” patch, a 3D plane is fitted by mean square minimization. The varianceσ2obtained from the residual gives a measure of non-planarity, which is expected to be high if the patch is located over several planes. Once all the neighborhoods have been examined, the retained starting seed is the one that correspond to the lowestσ2.
The second step calledpatch extractionprogressively adds points to the initial patch by examination of its spatial neighbors, in the spirit of region growing. A pointpiis accepted if the condition
d(zi,P(xi, yi)) <3.5σis satisfied, whered(,)is the distance between the pointziand the plane. Here, the model is a simple plane described by the functionP(x, y) =ax+by+cand the elevation noise is assumed to be white Gaussian for the sake of simplicity. However, the approach could be extended to other models. As new points are added, the plane parameters and the variance are updated. In practice, to keep a low computational cost, these quantities are updated only if the area of the region doubles.
initialize label:L:= 0
• Seed selection:
• L:=L+ 1,σmin:=∞ • for all remaining pointspi:
– Pick samples lying in a sphere of radius R
aroundpi→sample setSt.
– Fit the planePby least-squares fit onStand compute the varianceσ2t.
∗ put its unprocessed neighbours inQ
∗ updatePLandσL • Plane validation (see text).
• RemoveSLfrom the data. Go to seed selection.
Figure 9: Our TomoSeed algorithm.
Once a structure has been identified, we add a refinement step calledplane validation: since at the beginning of the region grow-ing the plane parameters and variance are only a rough estimate due to the low number of samples, some points may be discarded by the procedure even if they belong to the plane. Therefore, plane validation consists of performing the growing once more from the initial patch using the final parameter and variance esti-mates obtained from the previous step.
Then, the points corresponding to the current plane are removed from the data and the procedure is iterated until a stopping cri-terion is reached. Pseudo-code for the TomoSeed algorithm is given in Fig. 9.
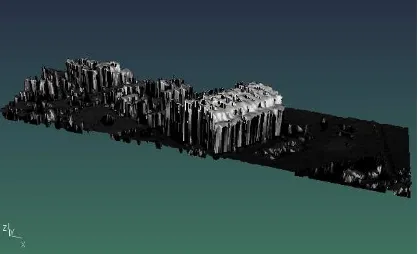
Fig. 10 shows a 3D rendering of the original points and the re-sults of labeling and de-noising produced by TomoSeed. It can be noticed that the complex structure of the biggest building is well extracted by the algorithm. However, it can also be observed that many areas remain unlabeled due to the fact that they are not well described by a locally planar patch. This segmentation provides only a grouping of the points in terms of geometric structures and does not allow for a detection of the buildings, since the ground points can also be grouped into planar parts.
5 DISCUSSION
(a) 3D rendering of the points retrieved from the tomogram
(b) Reconstructed 3D models by projecting the points on their re-spective plane. Each color corresponds to a label.
Figure 10: Extraction of planes from tomographic height map.
geometric information that can be segmented and de-noised by our TomoSNI/TomoSeed methods but does not allow to label the retrieved segments. This means we cannot distinguish automati-cally the ground from the buildings. On the other hand, thanks to the PolSAR bilateral filter, it is possible to extract physics related information such as randomness and type of scattering mecha-nism as well as bright lines associated with buildings. Our study also shows that in the case of this challenging dataset, the sole use of polarimetric information seems not sufficient to the partial localization of the buildings. This is due to two reasons: first, due to the 45 degree orientation of the buildings, theH/α de-composition describe these buildings with volume scattering as they should be described by double bounce for the layover part and pure surface for flat roofs. This is one of the limitations of the polarimetric approach. The second reason is that the simple line/roof model does not apply for all the buildings present in this scene. In fact, the optical image shows that they have more com-plex structures and the position of the bright lines does not allow an accurate localization. Therefore, our study shows that for this type of complex scene, other types of information should be ana-lyzed. In particular, shape information should be included to help the discrimination of the buildings from the ground. Moreover, since man-made structures should result in a stronger interfero-metric coherence that the rough surfaces of natural media, a po-larimetric interferometric analysis could then be helpful to extract optimized coherence and a physical classification should allow to detect buildings with a higher confidence.
6 CONCLUSION
In this paper, we have studied the complementarity of polarimetry and tomography in order to retrieve buildings from multi-channel SAR data. We have presented some recently developed methods that can be used to extract polarimetric and tomographic features in order to feed a detection algorithm. The PolSAR bilateral
fil-ter allows a strong de-speckling of the image, allowing to apply polarimetric decompositions and detect bright structures. The To-moSNI and TomoSeed algorithms allow the detection of points of interest from tomographic point clouds as well as their geomet-ric grouping and de-noising. We have shown that although these features contain a significant amount of information, they may not be sufficient in the case of complex scenarios. Complexity of building structures and ambiguity in the polarimetric parameters show that more information should be extracted from the scene in order to allow an automatic detection.
REFERENCES
Barbaresco, F., 2009. Interactions between symmetric cone and information geometries: Bruhat-Tits and Siegel spaces models for high resolution autoregressive doppler imagery. In: Emerging Trends in Visual Computing, pp. 124–163.
Cloude, S. and Pottier, E., 1996. A review of target decomposi-tion theorems in radar polarimetry. IEEE Trans. Geosci. Remote Sens. 34(2), pp. 498–518.
D’Hondt, O., Guillaso, S. and Hellwich, O., 2012. Automatic extraction of geometric structures for 3d reconstruction from to-mographic SAR data. In: Geoscience and Remote Sensing Sym-posium (IGARSS), 2012 IEEE International, pp. 3728–3731.
D’Hondt, O., Guillaso, S. and Hellwich, O., 2013. Iterative bilat-eral filtering of polarimetric SAR data. Accepted for publication in IEEE J. Sel. Topics Appl. Earth Observ.
Goodman, N. R., 1963. Statistical analysis based on a certain multivariate complex gaussian distribution (an introduction). The Annals of Mathematical Statistics 34, pp. 152–177.
Guillaso, S. and Reigber, A., 2005. Polarimetric SAR tomogra-phy (POLTOMSAR). In: Proceedings of POLINSAR’05, Fras-cati, Italy.
Guillaso, S., D’Hondt, O. and Hellwich, O., 2012. Extraction of points of interest from SAR tomograms. In: Geoscience and Re-mote Sensing Symposium (IGARSS), 2012 IEEE International, pp. 471–474.
Lee, J. and Pottier, E., 2009. Polarimetric Radar Imaging: From Basics to Applications. Optical Science and Engineering, Taylor & Francis.
Lee, J.-S., Wen, J.-H., Ainsworth, T., Chen, K.-S. and Chen, A., 2009. Improved sigma filter for speckle filtering of SAR imagery. Geoscience and Remote Sensing, IEEE Transactions on 47(1), pp. 202–213.
Pennec, X., Fillard, P. and Ayache, N., 2006. A Riemannian framework for tensor computing. Int. J. of Computer Vision 66(1), pp. 41–66.
Reigber, A. and Moreira, A., 2000. First demonstration of airborne SAR tomography using multibaseline L-band data. Geoscience and Remote Sensing, IEEE Transactions on 38(5), pp. 2142 –2152.