www.elsevier.comrlocaterdsw
Predicting safe employee behavior in the steel industry:
Development and test of a sociotechnical model
Karen A. Brown
a,), P. Geoffrey Willis
b,1, Gregory E. Prussia
a,2a
Department of Management, Albers School of Business and Economics, Seattle UniÕersity, 900 Broadway, Seattle, WA 98122, USA
b
Department of Decision Sciences, College of Business, UniÕersity of Central Oklahoma, 100 N. UniÕersity DriÕe,
Edmond, OK 73034, USA
Received 24 March 1999; accepted 10 January 2000
Abstract
Industrial safety is an important issue for operations managers — it has implications for cost, delivery, quality, and social responsibility. Minor accidents can interfere with production in a variety of ways, and a serious accident can shut down an entire operation. In this context, questions about the causes of workplace accidents are highly relevant. There is a popular notion that employees’ unsafe acts are the primary causes of workplace accidents, but a number of authors suggest a perspective that highlights influences from operating and social systems. The study described herein addresses this subject by assessing steelworkers’ responses to a survey about social, technical, and personal factors related to safe work behaviors. Results provide evidence that a chain reaction of technical and social constructs operate through employees to influence safe behaviors. These results demonstrate that safety hazards, safety culture, and production pressures can influence safety efficacy and cavalier attitudes, on a path leading to safe or unsafe work behaviors. Based on these results, we conclude with prescriptions for operations managers and others who play roles in the causal sequence.q2000 Elsevier Science B.V. All
rights reserved.
Keywords: Workplace safety; Industrial accidents; Unsafe work practices; Safety-efficacy; Safety hazards; Safety climate; Accident
diagnosis
1. Introduction
For managers in the manufacturing sector, work-place safety has evolved from an ancillary issue to an operating priority with significant economic and
)Corresponding author. Tel.:q1-206-296-5712; fax:q
1-206-296-2083.
Ž .
E-mail addresses: [email protected] K.A. Brown ,
Ž . Ž
[email protected] P.G. Willis , [email protected] G.E.
.
Prussia .
1
Tel.:q1-405-974-5345; fax:q1-405-974-3821.
2
Tel.:q1-206-296-2514; fax:q1-206-296-2083.
Ž .
social implications Brown, 1996 . For example, the
Ž .
National Safety Council 1999 estimates that in 1998, the total cost of work-related deaths and in-juries in the US was US$125.1 billion and that organizations lost 80,000,000 work days because of injuries. An increased awareness of these outcomes has incited a broad-based discussion of the causes of
Ž
workplace accidents e.g., DeJoy, 1996; Thompson .
et al., 1998 .
A review of the literature reveals a range of hypotheses about accident causes. One school of thought suggests that nearly every accident may be
0272-6963r00r$ - see front matterq2000 Elsevier Science B.V. All rights reserved.
Ž .
Ž
traced to an employee’s unsafe act e.g., Burk and .
Smith, 1990 . However, researchers examining hu-man information processing have documented the natural tendency for an observer to blame a person
Ž
when an unfortunate event occurs e.g., Mitchell and .
Wood, 1980; Brown, 1984 . The practical result of these attributional errors in the context of safety can
Ž be a ‘‘blame and train’’ prevention system DeJoy,
.
1994 that does not always address true accident causes.
Two other viewpoints provide alternative perspec-tives to the employee or person-based hypothesis about unsafe acts and accidents. One was espoused
Ž .
by the late W.E. Deming e.g., Deming, 1986 who asserted that accidents stem almost entirely from the system. The second viewpoint falls between the per-son- and system-based positions and is represented
Ž .
by the arguments of writers such as Perrow 1984 ,
Ž .
DeJoy 1986, 1994 , and others. These writers con-tend that most industrial accidents are caused by an interacting system of social and technical forces. They argue that employees just happen to find them-selves at the end of a series of interrelated events.
The purpose of this paper is to compare and Ž contrast the three alternative hypotheses system,
.
person, system–person sequence in order to define more clearly the antecedents to safe and unsafe work behaviors in manufacturing settings.
2. Perspectives on workplace safety
Research on workplace safety is scattered among fields such as occupational medicine, industrial hy-giene, human factors engineering, safety engineer-ing, labor law, organizational behavior, and human resource management. However, as noted by Brown Ž1996 , it has been largely ignored within the field of. operations management. Each discipline tends to fo-cus on variables that fall within its domain, leaving few opportunities for readers to explore the com-bined effects that characterize organizational safety realities.
An interdisciplinary literature search on safety uncovered causal variables ranging from the social to the technical, and from the person to the system, painting pictures that tended to be incomplete. How-ever, we found it reasonable to group the
explana-tions for unsafe acts, accidents, and related outcomes into three general themes: causes involving the per-son, causes involving the system, and causes involv-ing system–person sequential interrelationships. We describe each of these below.
2.1. Person as cause
The person-as-cause research is represented
espe-Ž .
cially well by Bigos et al. e.g., Bigos et al., 1992 ,
Ž .
and to a degree by Komaki et al. 1978, 1980 . Among corporations representing this view, the most
Ž
well-known example is the Du Pont e.g., Burk and .
Smith, 1990; Mottel et al., 1995 . Du Pont has turned its safety programs into profit centers, selling train-ing programs and consulttrain-ing services that focus on unsafe acts as primary causes of most workplace accidents.
Authors mentioned under the person-as-cause heading contend that employee attitudes and behav-iors are the most important antecedents to unsafe acts, accidents, injuries, and other outcomes such as compensation claims. Providing empirical support
Ž .
for this hypothesis, Bigos et al. 1992 found that a hypochondriacal tendency, previous injury, and the results of an employee’s most recent performance appraisal were all antecedents to employee decisions to file compensation claims following back injuries. Although these authors used claims as their criterion variable, it seems to be their general conclusion that the employees who have the worst attitudes are the most likely to have accidents. Along the same lines,
Ž but with a more positive spin, Komaki et al. 1978,
.
1980 found that the tendency to engage in at-risk behaviors in work settings can be reduced through training and behavioral reinforcement. The general implication here is that employee-centered fixes can solve safety problems. Although the authors men-tioned here are most certainly aware of the role of the organizational system, they base their person-centered solutions on the assumption that first line employees play the primary role in accidents.
2.2. System as cause
Those adhering to the notion that system design is the primary cause of unsafe acts and accidents
in-Ž . Ž .
Ž1993 . These writers make the case that accidents. attributed to ‘‘operator error’’ very frequently have their true roots in system design. For example,
Dem-Ž .
ing Latzko and Saunders, 1995 noted that in events ranging from quality errors to major disasters, most causality can be traced to system design and process
Ž .
management. Norman 1988 , in an insightful book,
The Design of EÕeryday Things, observes that the
design of ‘‘things’’ can influence people’s mental maps, causing them to take actions that may not be
Ž .
desirable. Sedgwick 1993 builds on Norman’s work, offering an example:
An underground mining vehicle was designed with two adjacent operational cabs — one facing in a direction appropriate for going into a mine, the other facing in a direction for departing from the mine. The two cabs were identical to each other, with one exception; in order to save design and manufacturing cost, the company put the brake and accelerator opposite each other in the two cabs. This meant that the brake was on the left in one cab and it was on the right in the other cab. Accidents ensued and investigations suggested operator error. Al-though the operator was the last to ‘touch’ the problem, the true cause was a design flaw.
As this example illustrates, the system-based viewpoint emphasizes technical system factors as the primary determinants of workplace accidents.
2.3. System–person sequence as cause
Proponents of this perspective see the technical and social components of a system as entities that interact with human thought processes and attitudes to influence outcomes. Central to this view of the world is the notion that system factors influence safety outcomes through people.
The system–person sequence perspective differs from the system design approach described above in three important ways. First, it brings social and technical systems together. Second, it acknowledges the role of personal predispositions. Third, it holds that system factors, both social and technical, can partially influence personal predispositions. Some of these elements may be included within the perspec-tives of those cited in the system-as-cause category, but not all three.
Writers adhering to the system–person sequence
Ž .
causal perspective include Perrow 1984 , DeJoy Ž1986, 1994, 1996 , Hofmann and Stetzer 1996 ,. Ž .
Ž .
and Vaughan 1996 . These authors stress the role of
Ž .
organizational climate a social system variable as Ž well as the technical attributes of the system e.g.,
.
safety hazards as they influence human behavior.
Ž .
For example, Hofmann and Stetzer 1996 assert that messages, symbols, and values communicated within the organization can influence employees to take safety shortcuts. Furthermore, they emphasize the role that the operator plays in reacting to the techni-cal system, potentially setting off a series of ping-pong like effects between the operator and the local
Ž .
environment. Vaughan’s 1996 insightful analysis of the Challenger disaster makes the point that when hazards and risks are present, and when they are ignored, and when no major catastrophes result, operators can become complacent and the likelihood of a serious accident increases. This fits with
Per-Ž .
row’s 1984 characterization of ‘‘normal accidents.’’
2.4. The need for integratiÕe models
From our view, the third perspective — that which recognizes the interactive effects among social systems, technical systems, and operator cognitions — holds the most compelling arguments. Proponents of this thinking have conducted extensive qualitative
Ž
analyses, dissecting major accidents e.g., Perrow, .
1984; Vaughan, 1996 and contributing to our under-standing of causal phenomena. However, there is very little quantitatively based research involving surveys or archival data that would help to confirm or disconfirm the system–person sequence causal hypothesis. Although a few authors have now
pro-Ž
posed causal models e.g., Slappendel et al., 1993; .
DeJoy, 1996 , we found only two empirical tests ŽSavery and Wooden, 1994, Thompson et al., 1998 ..
Ž .
Thompson et al. 1998 addressed macro-level orga-nizational variables only, de-emphasizing factors related to the technical work environment or the attributes and attitudes of employees. Savery and
Ž .
the need for a causal model that includes both sys-tem and person factors, allowing comparison of their separate and combined effects.
3. A sociotechnical model of safe work behaviors
We sought to identify a balanced set of indicators in our efforts to develop a model of system–person causal predictions. Our review of the literature en-abled us to identify a number of variables, and preliminary field work helped us to determine the practical significance of the variables we chose to investigate. This preliminary work involved personal interviews with plant managers and safety profes-sionals in 10 manufacturing companies across sev-eral industries.
3.1. Safety hazards
For the purpose of this study, safety hazards were defined as tangible factors in the work environment Že.g., heavy items that must be carried, exposure to
. chemicals, moving objects, repetitive motion that may pose risks for possible injuries or ailments. Within our definition, hazards do not always result in accidents or injuries, but they lurk in work environ-ments, waiting for the right combination of circum-stances to come together. For example, consider an oil-slicked floor. This hazard will not produce an accident unless it interacts with other factors such as an employee who is running, poor traction on shoes, inadequate lighting, andror a water film that results from the invasion of rain from outdoors.
Workplace hazards may exist in many settings, but they are most likely to be found in higher risk industries such as forest products, mining,
transporta-Ž
tion, and heavy manufacturing National Safety .
Council, 1999 . A few authors have investigated Ž employee perceptions of workplace hazards e.g., Ritchie and McEwen, 1994; Savery and Wooden,
.
1993 , but they have examined rather limited hazard variable sets.
3.2. Safety climate
Ž .
Zohar 1980 uses the term safety climate to describe a construct that captures employees’ molar
perceptions of the role of safety within the
organiza-Ž .
tion. In contrast, Pidgeon 1991, p. 134 has used the term safety culture to describe ‘‘beliefs, norms, attitudes, roles, and the social and technical practices that are concerned with minimizing the exposure of employees, managers, customers, and members of the public to conditions considered dangerous or injurious.’’
Given the origins of the generic terms organiza-Ž
tional culture and organizational climate Schneider,
.
1990 , it appeared to us that safety climate was the more appropriate description of the construct we aimed to capture. However, we have departed some-what from the measurement approach taken by
Zo-Ž . Ž .
har 1980 and Hofmann and Stetzer 1996 . For example, in contrast to research on organizational climate and safety climate, we considered individual perceptions rather than an organizational aggregate, as our unit of analysis. This was because we wished to assess the effects of an employee’s cognitive interpretations on the person-based outcomes high-lighted in our model. Moreover, we speculated that an employee’s perception of climate would be col-ored by the tone that his or her immediate supervisor projects — safety climate may vary considerably within a large, complex organization.
3.3. Pressure for expediency oÕer safety
In many industrial settings, employees find them-selves torn between compliance with safety rules and
Ž
support of production quotas Ray et al., 1993; .
Brown, 1996 . For example, according to a National Public Radio Morning Edition report on Thursday, 11 June 1998, coal miners in the Appalachian region of the US sometimes turn off air quality monitors in order to avoid the economic consequences of mine
Ž .
3.4. CaÕalier attitudes toward safety risk
Numerous studies have demonstrated that individ-Ž uals differ in their willingness to take risks e.g., MacCrimmon and Wehrung, 1992; March and
.
Shapira, 1992 . In the context of workplace safety, we will use the label caÕalier attitude to characterize
Ž
those who possess a mix of arrogance justified or .
unjustified , innate risk orientation, and a tendency to rationalize risk-taking behavior. For the purpose of this study, then, we defined cavalier attitude as the extent to which an employee feels that he or she can ignore safety procedures without incurring the risk of an accident or injury.
3.5. Safety-efficacy
Safety-efficacy has been mentioned as a possible determinant of health behaviors in the workplace ŽDeJoy, 1996 , but does not appear to have been. empirically measured. We have adapted this term from the behavioral literature, where the more broadly defined self-efficacy refers to a belief in one’s capability to mobilize the cognitive resources, motivation, and courses of action needed to meet
Ž .
task demands Wood and Bandura, 1989 . Studies of self-efficacy have shown that people who have a high sense of self-efficacy for a particular task per-form better than those who have low self-efficacy for
Ž .
that task Gist and Mitchell, 1992 . For the purpose of this study, safety-efficacy was defined as an em-ployee’s confidence that he or she has the skill to work safely in the context of a specific environment.
3.6. Safe work behaÕiors
Ž
Safe work behaviors and, thus, their reciprocal, .
unsafe behaviors are important because of their widely acknowledged link with workplace accidents ŽMottel et al., 1995; Thompson et al., 1998 . We. chose this as the criterion variable for a predictive model that is described in the next section.
There were three important reasons why we did not consider workplace accidents, in themselves, as our ultimate model outcome. First, recordable acci-dents are of relatively low occurrence and may be random events outside of the control of individual employees or the organization. This can make it
difficult to uncover predictive relationships in a pop-ulation where most people have not had accidents ŽSavery and Wooden, 1994 . Second, self-reports of. accidents can be subject to certain flaws, particularly because of differences in definitions of what
com-Ž
prises an accident i.e., anything from a paper cut to
. Ž .
dismemberment . Finally, safe or unsafe behavior, rather than accidents, seemed to carry with it more solid implications for organizational action.
3.7. Relationships in the model
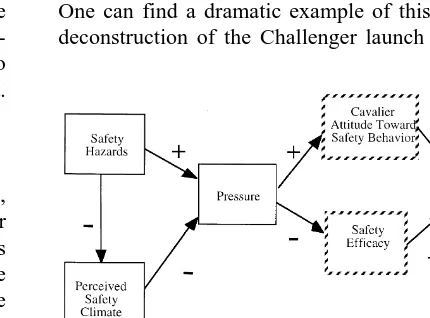
Fig. 1 illustrates our hypotheses about the rela-tionships among the constructs selected for this study. These predictions were drawn from the literature and from our extensive interviews in manufacturing plants. As the model flows from left to right, we move from factors that are distinctly representative of the social and technical systems, through a set of personal observationalrcognitiverattribute steps that are filtered by employee perceptions of the organiza-tional environment. Below, we provide support for predictions depicted in the model.
3.7.1. Consequences of safety hazards
It was our assumption that when employees ob-serve that managers have allowed hazards to accu-mulate, this sends a signal that the company carries a
Ž .
low commitment to health and safety Osada, 1991 . One can find a dramatic example of this effect in a deconstruction of the Challenger launch decision in
Ž .
1986 Vaughan, 1996 . Engineers had lived for so many years in an environment where unacceptable risks were allowed to continue unabated, that they became complacent. It was pure luck that an accident did not occur earlier, but because there had been no serious incidents, those involved began to see the hazards as ‘‘normal.’’ Increasingly complacent be-haviors escalated over time, building the potential for a major accident like a volcano waiting to erupt. As shown in the model, we hypothesized that an envi-ronment with hazardous conditions would lead to perceptions of a less desirable safety climate.
In addition to having an effect on safety climate, we believed that the presence of workplace hazards would play a role in influencing employees’ percep-tions of organizational pressures to value expediency
Ž .
over safety. For example, DeJoy 1996 implies that when job-related barriers make it difficult to perform a job safely, they influence employees’ attitudes about following safety rules and guidelines. If em-ployees believe that managers do not care enough to remove hazards, it communicates to employees that
Ž
the organization has other priorities i.e., getting .
products out the door .
3.7.2. Outcomes of safety climate
We predicted that a weak safety climate would be
Ž .
an additional factor in combination with hazards that could increase employees’ perceptions that there
Ž are pressures to take safety shortcuts. DeJoy 1996,
.
p. 67 supports this perspective, noting that ‘‘It is generally thought that safety climate serves as a frame of reference for guiding relevant behaviors in the workplace and that employees develop reason-ably coherent expectations regarding behavior-out-come contingencies in their environments.’’ Climate plays a role in communicating priorities.
3.7.3. Causes and consequences of caÕalier attitudes
Although cavalier attitudes have some of their basis in the inherent affective state of the individual, they can be influenced by organizational factors ŽHofmann et al., 1995; Hofmann and Stetzer, 1996 .. As shown in the model depicted in Fig. 1, we predicted that perceived organizational andror sub-unit pressures to value expediency over safety may increase the likelihood that an employee will assume a more cavalier attitude.
Furthermore, it was our prediction that if an em-ployee holds a cavalier attitude, he or she will be less likely to engage in safe behaviors — these individu-als are not averse and may, in fact, be risk-seekers. Based on research in high-danger law
en-Ž .
forcement environments Jermier et al., 1989 , as well as our interviews with company managers, we expected that the steel industry might attract people who have an affinity for high-risk situations. For example, in the plant where we conducted the study, managers described the great challenge they had faced in their efforts to convince operators to wear hard hats and flame retardant suits. Thus, we felt that cavalier attitudes would be an especially appropriate construct to consider in a steel plant. Given the variety of risks and subcultures within the organiza-tion that we studied, we expected to find variance across subjects.
3.7.4. Causes and consequences of safety-efficacy
We hypothesized that organizational pressure to value expediency over safety may lead operators to feel a sense of hopelessness about being able to work
Ž .
safely DeJoy, 1996 . First, there simply is not enough time to remove hazards when there are strong
Ž production pressures. Second, safety procedures e.g.,
. wearing safety glasses that might tend to fog-up may interfere with one’s ability to produce at a fast pace. Thus, we expected that higher levels of pres-sure to value expediency might undermine an em-ployee’s safety-efficacy.
We also predicted that people’s confidence in
Ž .
their abilities to work safely i.e., safety-efficacy would influence the extent to which they actually engage in safe or unsafe practices. Our reasoning here was based on the notion that self-efficacy per-ceptions influence subsequent effort and persistence ŽBanduara, 1997 ..
3.8. Summary of model relationships
fac-tors, influence personal decisions about whether or Ž
not to engage in safe behaviors our criterion vari-.
able . Of the five predictor variables included in the model, three reflect company or system
character-Ž .
istics safety hazards, safety climate, and pressure and two describe employee attitudes and beliefs Žcavalier attitude, safety efficacy ..
4. Methods
We addressed the research issues described above using data from a survey of 551 employees working in the steel industry. Our predominant data analysis
Ž .
method, covariance structure analysis CVA , al-lowed us to examine models using latent variables
Ž
with multiple indicators James et al., 1982; Bentler, .
1995 .
4.1. Sample and design
The subject firm for our study was a producer of high-performance alloy mill forms. At the time of the study, the company had several plants around the world. The research was conducted in the two largest of the company’s US facilities, both located in the southeastern US. One plant employed 950 people and the other employed 175 people. The two plants engaged in similar work and were located within short driving distance of each other.
Of 800 surveys initially distributed to employees in production areas, 593 were filled out and returned. Of those, 551 were sufficiently complete to be in-cluded in data analysis, producing a usable response rate of 69%. Plant A responses numbered 447 and Plant B responses numbered 104, providing fairly representative completion percentages. Of those re-sponding, the average age was 45 years and most
Ž
respondents were male 430 men; 18 women, 103 no .
response . Job categories included equipment
opera-Ž . Ž .
tor ns279 , maintenance ns47 , plant services Žns19 , other quality control, safety, etc., ns. Ž 93,
.
and no responses165 . Distributions were represen-tative of demographics in the two plants.
As previously mentioned, the survey items were developed based on in-depth plant tours and inter-views in several plants, two of which were the
facilities where the survey was administered for this study. The survey was initially pilot-tested in a focus group format with eight operating-level personnel and seven supervisory-level personnel from both of the plants where the study was to be conducted. It was also pilot-tested similarly with four supervisory personnel in a southern personal products plant. The final survey design utilized principles prescribed by
Ž .
Dillman 1978 for increasing survey response rates and reliability. Survey introduction to supervisors and managers, conducted by one of the authors and embellished with supporting commentary from top management, took place in the company auditorium. Supervisors were then given the responsibility of distributing the surveys to members of their work groups and encouraging participation. The company’s safety manager, who had come up through the ranks and was very well-respected, served as the chief sponsor of the survey, ensuring that it was taken seriously by all involved. His sponsorship of the study was important because questions about em-ployee safety attitudes and practices can be highly sensitive.
4.2. Measures
The constructs presented in the model had gener-ally not been measured before, leading us to develop new scales for the variables under consideration. This section describes the approach that we took and the rationale that we followed in developing each of these scales. More details about survey scale content, along with means and reliability statistics, are pro-vided in Appendix A.
4.2.1. Safety hazards
A central focus of this research was the creation of a safety hazards variable set. To create the set, one of the authors visited 10 manufacturing plants to gather data about possible hazards. Industries repre-sented in this preliminary work included steel, per-sonal products, aircraft, paper, automotive, machine tools, textiles, glass, and electronics. This investiga-tion produced a preliminary list of 101 items. We later screened these items for redundancy and clarity, creating a reduced, 80-item pool. The 80 items were subjected to a sorting process similar to that used in
Ž .
later adapted for the assessment of performance
ob-Ž .
stacles Brown and Mitchell, 1988, 1991, 1993 . The sorting process reduced the final set to 61 items.
Respondents were asked to rate the extent to which they considered an item to be a serious hazard and the frequency with which it occurred. Responses
Ž for the hazard seriousness items ranged from 1 not
. Ž .
at all to 7 to a great extent , and responses on the
Ž .
corresponding frequency items ranged from 1 never
Ž .
to 7 very often . We calculated an importance score for each hazard item by summing its seriousness rating with its frequency rating. This approach re-duces the potential for error magnification that may result when two items are multiplied and then used
Ž .
in subsequent predictive analyses Schmidt, 1973 . Our approach was modeled very closely after the
Ž
precedent set by Brown and Mitchell 1988, 1991, .
1993 , who found very few general differences in results when they compared the multiplicative and additive models — ultimately, they chose the addi-tive model as the safer approach, heeding Schmidt’s Ž1973. warnings about stability and theoretical soundness. As a consequence of the summing proce-dure, the possible score for each item ranged from
Ž . Ž
zero if it was not applicable to 14 if it received the highest possible rating of seven for each of the item
.
sub-components . The higher the rating, the more serious and more present the hazard.
We conducted an initial exploratory factor analy-sis using principal components with varimax rotation to examine the dimensionality of the workplace haz-ard variables. Ten factors explained 63.5% of the variance. A scree test demonstrated that explained variance fell off dramatically beyond these first 10 factors, all of which had eigenvalues greater than 1. Within the 10 hazard factors, we applied the decision rule that an individual item would be retained in our reduced data set if it had a factor loading of 0.5 or greater. This reduced the number of hazard items to 42. We also confirmed the results of this decision rule with assessments of reliability. The 10 resulting hazard categories and their item contents are dis-played in Appendix A.
In a further move toward data reduction, we averaged importance scores for individual items within categories to conserve degrees of freedom in model estimation, and for the sake of parsimony ŽJames et al., 1982 . Chronbach’s. a coefficients for
these 10 scales, presented in Appendix A, ranged from 0.74 to 0.80.
Our next step was to triangulate these results by observationally assessing the practical validity of the individual hazard items, asking for confirmatory in-terpretation from the safety manager, and comparing employee responses with those of managers and supervisors. Individual hazard items associated with moving objects, electrical current, and sharp edges on materials were rated as most important, as shown in Appendix A. Our tours through the two plants substantiated the significance of these hazard percep-tions. Examples of moving objects included over-head cranes carrying ladles of molten steel, and a seemingly endless flow of fork trucks. Electrical current was a constant factor in many of the opera-tions, and employees had to be alert to avoid associ-ated dangers. Sharp edges were particularly prevalent where sheets of metal were shot down conveyors at high speeds. These observations lent credence to survey results. We also broke the data down by department and reported the results to the safety manager, who corroborated our observations that employee ratings were realistic.
Another source of information came from a sur-vey of managers and supervisors that was conducted concurrently with the employee survey. This survey was focused on other issues, but it did include questions about hazards. The managers and supervi-sors were asked to rate the same 61 hazard items that operators did, but to indicate how they felt these factors affected employees. So, for example, an op-erator survey item that read ‘‘Tools that I need are difficult to reach.’’ was modified for the manager survey to read ‘‘Tools that employees need are difficult to reach.’’ Although the manager sample
Ž .
size was relatively small Ns122 , we did have enough data to provide for some comparisons. For the sake of reliability, we selected for this analysis the subjects in departments from which there were at least five manager respondents. In aggregate, man-agers agreed with operators about hazard importance. For the sum of the 10 hazard categories, the mean
Ž .
for managers was 61.8 Ns112, S.D.s20.0 and Ž
the mean for employees was 63.3 Ns428, S.D.s
. Ž .
22.2 ; Ts y0.655, not significant . Based on multi-company results reported by Brown and
Ž .
the field of attribution theory, we expected to find differences in numerical ratings between managers and supervisors for individual hazard categories. Our anticipations proved correct, as shown in Table 1. We were interested, though, in whether or not the two groups agreed on the rank-order importance of the 10 categories. Results of rank-order comparisons are displayed in Table 1.
As shown in Table 1, there was a consistent pattern in the rank-order similarities between man-agers and operators. Both groups rated moving ob-ject hazards as most important, and both groups agreed that the other hazards in the ‘‘top four’’ included back hazards, floor surface hazards, and material hazards. Moreover, Kendall’s Coefficient of Concordance — a measure of association between
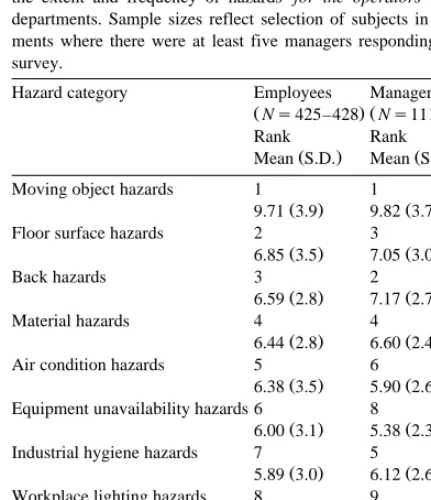
Table 1
Data for Kendall’s coefficient of concordance for safety hazards: employees vs. managers
Managers and supervisors were asked to rate their perceptions of the extent and frequency of hazards for the operators in their departments. Sample sizes reflect selection of subjects in depart-ments where there were at least five managers responding to the survey.
Hazard category Employees Managers
ŽNs425–428. ŽNs111–112.
Rank Rank
Ž . Ž .
Mean S.D. Mean S.D.
Moving object hazards 1 1
Ž . Ž .
9.71 3.9 9.82 3.7
Floor surface hazards 2 3
Ž . Ž .
6.85 3.5 7.05 3.0
Back hazards 3 2
Ž . Ž .
6.59 2.8 7.17 2.7
Material hazards 4 4
Ž . Ž .
6.44 2.8 6.60 2.4
Air condition hazards 5 6
Ž . Ž .
6.38 3.5 5.90 2.6 Equipment unavailability hazards 6 8
Ž . Ž .
6.00 3.1 5.38 2.3
Industrial hygiene hazards 7 5
Ž . Ž .
5.89 3.0 6.12 2.6
Workplace lighting hazards 8 9
Ž . Ž .
5.54 3.0 5.10 2.2
Sitting hazards 9 7
Ž . Ž .
5.07 3.1 5.85 2.8 Equipment handling hazards 10 10
Ž . Ž .
5.02 2.9 2.93 2.0
Ž .
sets of rank orders Churchill and Churchill, 1998
Ž .
— was 0.95 p-0.05 , thus, indicating strong agreement between the two sets of rankings and providing statistical support for our observations about parallels between operators and managers.
We extended this comparative validity check by breaking the data down by department. An informal analysis demonstrated strong agreement in hazard rank-ordering for the departments where sample sizes were large enough for comparison. For example, the cold draw department had the largest sample size for
Ž .
managers Ns22 and the rank-order comparison with operators was absolutely identical. For that group, air condition and back hazards were ranked first and second, respectively, revealing a contrast from the company-wide data, but agreement within the department. These results supported the patterns that we found at the broader level, and the triangula-tion provided us with additriangula-tional confidence in the validity of our measures.
4.2.2. Safety climate
Nine items were included in the survey to mea-sure climate. All items were rated on seven-point
Ž .
Likert-type scales ranging from 1 strongly disagree
Ž .
to 7 strongly agree . Principal components factor analysis resulted in two indicators of safety climate: a five-item scale representing perceived supervisory
Ž .
influences coefficient as0.94 , and a four-item
scale representing perceptions of upper manage-Ž
ment’s influence on workplace safety Chronbach’s .
as0.86 . Items were aggregated within each scale
Ž
to form the two indicators supervisory and manage-.
rial of the safety climate construct. From a practical standpoint, this division proved advantageous be-cause it gave us the potential to more clearly
distin-Ž
guish local effects across departments Thompson et .
al., 1998 .
4.2.3. Pressure
We assessed pressure to value expediency over
Ž .
safety with three items see Appendix A . Responses
Ž . Ž .
ranged from 1 never to 7 very often . Chronbach’s
a for the three-item scale was 0.69, but each item
Table 2
Fit indices for nested sequence of measurement models
2 2
Model x df CFI IFI PFI RMSEA x difference df CFI difference
)
Ž .1 Plant differences 441.79 240 0.95 0.95 0.74 –
)
Ž .2 Plants equivalent 466.43 258 0.95 0.95 0.80
2 vs. 1 contrast 24.64 18 0
)
Ž .3 Baseline measurement confirmatory F.A.Ž . 271.87 120 0.96 0.96 0.75 0.05
)
Ž .4 Single factor model 1991.16 135 0.54 0.54 0.47 0.19
)
4 vs. 3 contrast 1719.29 15 0.42
)
Ž .5 Equate hazards and climate 579.05 125 0.88 0.89 0.71 0.10
)
5 vs. 3 contrast 307.18 5 0.08
)
Ž .6 Equate hazards and pressure 614.14 125 0.88 0.88 0.71 0.10
)
6 vs. 3 contrast 342.27 5 0.08
)
Ž .7 Equate climate and pressure 634.89 125 0.87 0.87 0.71 0.11
)
7 vs. 1 contrast 363.02 5 0.09
)
Ž .8 Equate efficacy and cavalier 838.39 125 0.82 0.82 0.66 0.13
)
8 vs. 1 contrast 566.52 5 0.14
)
pF0.05.
4.2.4. CaÕalier attitude
Ž .
Three items see Appendix A measured the ex-tent to which the respondent held what we termed a ‘‘cavalier’’ attitude toward safety procedures. Once
Ž . Ž
again, responses ranged from 1 never to 7 very
.
often . Chronbach’s a for this three-item scale was
estimated at 0.79. Similar to the way in which we handled the pressure construct, we used the three items to serve as unique indicators of the cavalier construct.
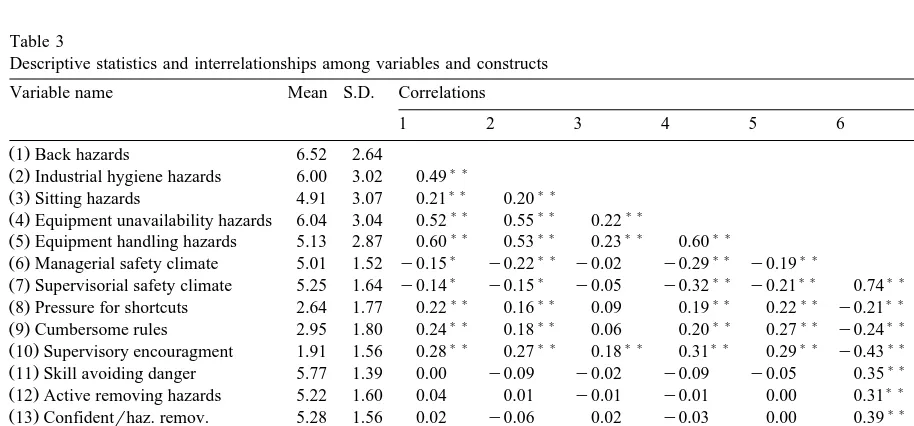
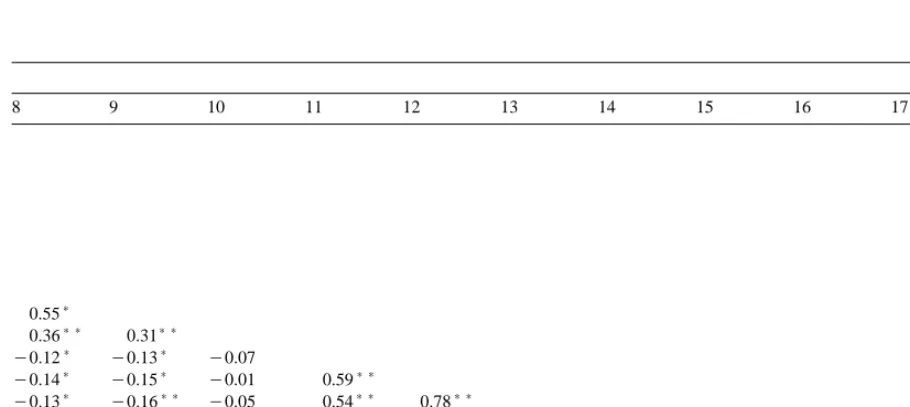
Table 3
Descriptive statistics and interrelationships among variables and constructs
Variable name Mean S.D. Correlations
1 2 3 4 5 6 7
Ž .1 Back hazards 6.52 2.64
) )
Ž .2 Industrial hygiene hazards 6.00 3.02 0.49
) ) ) )
Ž .3 Sitting hazards 4.91 3.07 0.21 0.20
) ) ) ) ) )
Ž .4 Equipment unavailability hazards 6.04 3.04 0.52 0.55 0.22
) ) ) ) ) ) ) )
Ž .5 Equipment handling hazards 5.13 2.87 0.60 0.53 0.23 0.60
) ) ) ) ) ) )
Ž .6 Managerial safety climate 5.01 1.52 y0.15 y0.22 y0.02 y0.29 y0.19
) ) ) ) ) ) ) )
Ž .7 Supervisorial safety climate 5.25 1.64 y0.14 y0.15 y0.05 y0.32 y0.21 0.74
) ) ) ) ) ) ) ) ) ) ) )
Ž .8 Pressure for shortcuts 2.64 1.77 0.22 0.16 0.09 0.19 0.22 y0.21 y0.18
) ) ) ) ) ) ) ) ) ) ) )
Ž .9 Cumbersome rules 2.95 1.80 0.24 0.18 0.06 0.20 0.27 y0.24 y0.17
) ) ) ) ) ) ) ) ) ) ) ) ) )
Ž10 Supervisory encouragment. 1.91 1.56 0.28 0.27 0.18 0.31 0.29 y0.43 y0.46
) ) ) )
Ž11 Skill avoiding danger. 5.77 1.39 0.00 y0.09 y0.02 y0.09 y0.05 0.35 0.35
) ) ) )
Ž12 Active removing hazards. 5.22 1.60 0.04 0.01 y0.01 y0.01 0.00 0.31 0.31
) ) ) )
Ž13 Confidentrhaz. remov.. 5.28 1.56 0.02 y0.06 0.02 y0.03 0.00 0.39 0.33
) ) ) ) ) ) ) )
Ž14 Work safely without rules. 1.91 1.45 0.11 0.11 0.08 0.14 0.17 y0.15 y0.20
) ) ) ) ) ) ) ) ) )
Ž15 Ignore rulesrsave time. 2.13 1.46 0.16 0.17 0.08 0.13 0.23 y0.23 y0.15
) ) ) ) ) ) ) ) ) )
Ž16 Safety proc. not necessary. 1.99 1.53 0.11 0.16 0.14 0.16 0.14 y0.18 y0.14
) ) ) ) )
Ž17 My safe behavior %. 82.82 16.54 y0.09 y0.03 y0.05 y0.06 y0.18 0.19 0.15
) ) ) ) )
Ž18 Coworker safe behavior %. 72.47 24.40 y0.07 y0.05 y0.04 y0.07 y0.12 0.19 0.16 )
pF0.05. ) )
4.2.5. Safety efficacy
Ž .
Based on Banduara’s 1986 recommendation re-garding the measurement of efficacy perceptions, we used three items that assessed safety-efficacy strength Žsee Appendix A . In general, respondents indicated. the extent to which they were confident that they could work safely and avoid safety hazards.
Re-Ž .
sponses ranged from 1 strongly disagree to 7 Žstrongly agree . Coefficient. a was 0.83, but for
modeling purposes we used each item as a separate indicator of the safety-efficacy construct.
4.2.6. Safe work behaÕior
Two items assessed safe work behavior, the crite-rion variable for our sociotechnical model. The first item asked subjects: ‘‘About what percent of the time do you follow all of the safety procedures for the jobs that you do?’’ Possible responses ranged from 0% to 100%, in 10% increments. The second item was measured similarly but asked respondents to indicate the percentage of time that their
cowork-ers followed safe work practices. Based on
attribu-tion theory, we felt that the addiattribu-tion of the second question would serve as a supplemental validity check on self reports of behavior. Self-estimates of safe
Ž .
behavior frequency averaged 82.82% S.D.s16.54 , ranging from 0% to 100%. Estimates of coworker
Ž .
safe behavior averaged 72.47% S.D.s24.40 , with a range of 0 to 100%. Although the difference was
Ž .
significant Ts9.074; p-0.0001 , the two items
Ž .
were highly correlated rs0.51; pF0.001 . For modeling purposes, we used the two estimates Žself and other as separate indicators of the safe. workplace behavior construct. Because the safe work items were measured differently than the variables
Ž
within the other constructs percent vs. seven-point .
scales , we were able to dampen some of the prob-lems associated with common method dependence. ŽAs we shall demonstrate later in this paper, we also were able to employ statistical tests to address this
. possible concern.
5. Results
Table 2 summarizes the results of the plant com-parison and measurement model tests, and Table 3 provides descriptive statistics of model indicators. In reference to measurement model tests in Table 2, CFI and IFI values of 0.90 and greater indicate
8 9 10 11 12 13 14 15 16 17 18
)
0.55
) ) ) )
0.36 0.31
) )
y0.12 y0.13 y0.07
) ) ) )
y0.14 y0.15 y0.01 0.59
) ) ) ) ) ) )
y0.13 y0.16 y0.05 0.54 0.78
) ) ) ) ) ) ) ) ) ) )
0.45 0.38 0.23 y0.18 y0.19 y0.15
) ) ) ) ) ) ) ) ) ) ) )
0.65 0.53 0.31 y0.16 y0.15 y0.15 0.52
) ) ) ) ) ) ) ) ) ) ) ) ) ) ) )
0.36 0.36 0.28 y0.16 y0.17 y0.16 0.54 0.55
) ) ) ) ) ) ) ) ) ) ) ) ) ) ) )
y0.31 y0.31 y0.07 0.24 0.25 0.25 y0.27 y0.34 y0.21
) ) ) ) ) ) ) ) ) ) ) ) ) ) ) ) ) ) )
Ž .
adequate model fit Bollen, 1989 . PFI values of 0.60 and greater are suggested as a rule of thumb
Ž
criterion for model retention Williams and Pod-.
sakoff, 1989 . RMSEA values of 0.08 or less indi-cate reasonable error of approximation, and values of
Ž
0.05 or less indicate a close fit Browne and Cudek, .
1992 .
5.1. Tests of between-plant differences
We wished to determine whether it was appropri-ate to combine data from the two plants, or whether they should be treated separately. For this purpose, we used a two-group Confirmatory Factor Analysis ŽCFA. ŽBollen, 1989 . We began with a model where. all factor loadings were constrained to be equal ŽTable 2, Model 2 and compared that to a model. where factor loadings were free to vary across groups ŽTable 2, Model 1 . An insignificant chi-square dif-. ference indicated that the measures were interpreted similarly across plants. This justified combining data from plants A and B for further analyses.
5.2. Testing the measurement model
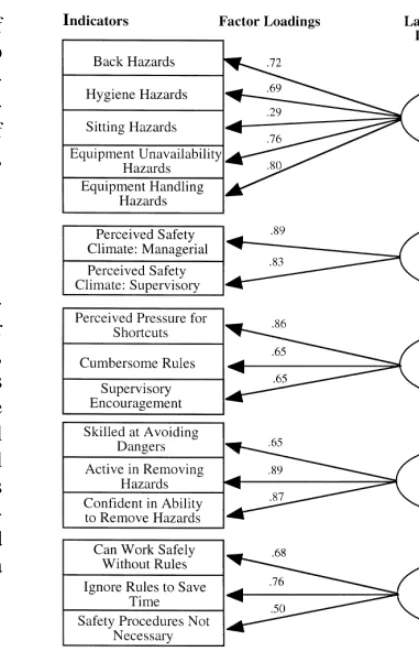
Following determination of construct equivalence across plants, we assessed the dimensionality of the constructs in our six-construct hypothesized model ŽFig. 1 . Before delving into predictive relationships,. we simply wanted to see if the measures made sense and whether the various constructs were theoretically independent. The results of the CFA appear in Fig. 2.
Fig. 2 highlights the factor loadings of the indica-tors associated with each of the six latent constructs included in our model. Most of these results matched the expectations we had when we designed the sur-vey, although some original survey items did drop out because of their weakness in explaining latent factor variation. For example, we had identified 10 hazard categories, but the latent hazard factor was adequately measured with just five categories. As
Ž
shown in Table 2, this baseline model Table 2, .
Model 3 fit the data well. Additionally, all standard-ized factor loadings were significant, averaging 0.72 ŽFig. 2 . A single factor model Table 2, Model 4. Ž . did not perform as well as the six factor model.
Fig. 2. Baseline measurement model. Comparative Fit Indexs 0.96; Incremental Fit Indexs0.96; Root Mean Square Error Approximations0.05.
Beyond the baseline and single factor tests for discriminant validity, we contrasted the baseline six-factor model with four other models, each of which presumed that two or more latent constructs were
Ž
actually measuring the same thing see Models 5, 6, .
7, and 8 in Table 2 . Sequential chi-square difference tests showed that constraining the system-level and person-level constructs to be equivalent produced significantly worse fitting models as compared with the baseline model. Moreover, decreases in CFI indi-cate a material reduction in model fit for each of the
Ž .
5.3. Structural model results
We began our structural analysis with a test of the system–person sequence model depicted in Fig. 1. Thus, we first examined whether system
character-Ž .
istics influence employees to follow or not follow safety procedures indirectly through their effects on
Ž .
person-based characteristics Fig. 3 . Next, we com-pared the first model to one that added direct links
Ž from system characteristics to safety outcomes Fig.
.
4 . Finally, the initial model was compared to a model where system and person influences on safety
Ž .
were separate Fig. 5 . All three of these models were tested using covariance structure analysis
pro-Ž .
cedures in Bentler’s 1995 EQS program. Model
Ž .
paths were evaluated for significance see Figs. 3–5 , and model fit was assessed by four fit indices: CFI, IFI, PFI, and RMSEA.
An indirect effects model based on our hypothe-sized system–person sequence, accurately explained patterns in the sample data, as indicated by the fit indices in Fig. 3. All structural parameter estimates
Ž .
were significant p-0.05 and in the predicted directions.
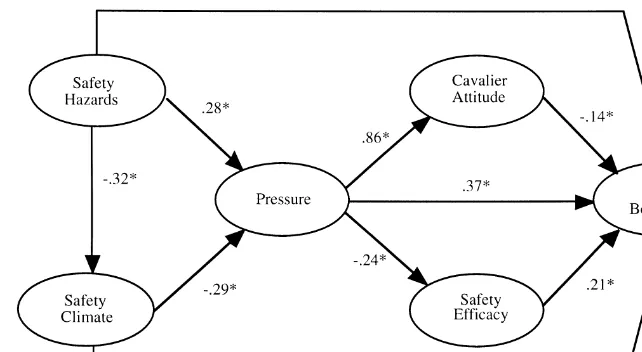
In the direct effects model depicted in Fig. 4, we assessed the propriety of adding direct paths from system characteristics to safety outcomes. We com-pared these results with those from the
system–per-Ž .
son sequence indirect effects model in Fig. 3 and found that the chi-square and CFI values were not
Ž 2
significantly different x differences3.29, 3 df ;
.
CFI differences0.00 . Moreover, the coefficients for the added model paths were insignificant. Be-cause the added paths did not allow us to explain more variance in the model, the contrast argued for accepting the more parsimonious system–person se-quence model.
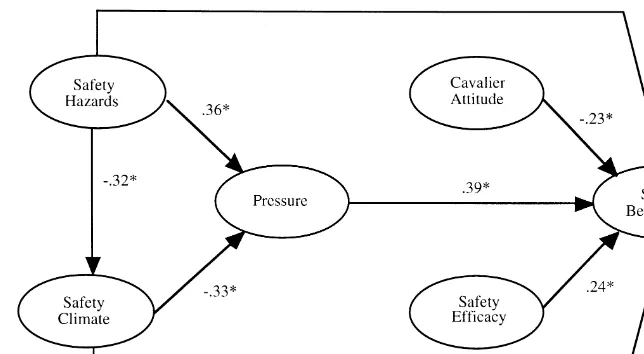
The next comparison assessed whether system and person influences on safety outcomes operate directly, rather than sequentially. As shown in Fig. 5, we tested this model by removing system links to personal factors, and found it to be less explanatory than the indirect system–person sequential model. The chi-square difference between the models was
Ž .
significant 168.64, p-0.05 and the CFI dropped from 0.95 to 0.91. These results reinforced our argu-ments for the system–person sequence model pre-sented in Fig. 3.
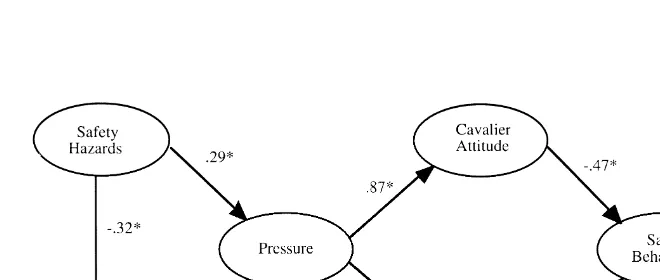
Of the structural models evaluated, the indirect
Ž .
model system–person sequence represented the best fitting parsimonious model. Results from this model ŽFig. 3 show that the presence of safety hazards can.
Ž .
degrade perceived safety climate y0.32 and in-crease operators’ feelings of pressure to value
expe-Ž .
diency over safety 0.29 . However, the perception of a strong safety climate can diminish feelings of
Ž .
pressure y0.30 . Thus, safety hazards influence perceived pressure directly and indirectly through climate. The significant path coefficients support our predictions regarding system factor relationships.
Fig. 3. Results: indirect effects model. The system–person sequence model for predicting safe work behaviors. Standardized path coefficients are displayed adjacent to influence arrows. x2s320.29); Comparative Fit Indexs0.95; Incremental Fit Indexs0.95;
Parsimonious Fit Indexs0.79; Root Mean Squared Error Approximations0.06; Degrees of Freedoms128.)Indicates p
Fig. 4. Results: dual effects model for predicting safe work behaviors. Standardized path coefficients are displayed adjacent to influence arrows.x2s317.00); Comparative Fit Indexs0.95; Incremental Fit Indexs0.95; Parsimonious Fit Indexs0.77; Root Mean Squared
Error Approximations0.06; Degrees of Freedoms125.)Indicates p
-0.05.
Structural results further show that system factors affect safe behaviors indirectly through person fac-tors. Specifically, pressure is positively related to
Ž .
cavalier attitude 0.87 and negatively related to
Ž .
safety efficacy y0.25 . Finally, person-linked fac-tors directly affect safe behaviors. A cavalier attitude
Ž .
results in less safe behavior y0.47 , and strong perceptions of safety efficacy lead to more safe
Ž .
behavior 0.23 .
5.4. Discussion
Managers make many assumptions about the rea-sons why employees engage in unsafe work behav-iors. Those subscribing to the Du Pont model, espe-cially if they interpret it on a superficial level, may assume that unsafe acts emerge solely from personal characteristics of the employee, and that they have no links to contextual factors in the operating envi-ronment. Our results provide evidence for another point of view: factors internal to the organization and within the scope of operating control have a mean-ingful influence on employee safety behaviors. The solution to the problem of unsafe acts goes beyond the training approach that is often at the center of safety programs. The model we have tested and
verified highlights several areas where managerial action can truly make a difference.
Encouraging employees’ safety goes well beyond the slogans and posters that so often serve as surro-gates for safety programs in industrial settings. Sin-cere, concerted company efforts aimed at all five of the predictor constructs identified in our model can produce effective change with lasting effects.
5.4.1. Safety hazards
Fig. 5. Results: direct effects model for predicting safe work behaviors. Standardized path coefficients are displayed adjacent to influence arrows. x2s488.93; Comparative Fit Indexs0.91; Incremental Fit Indexs0.91; Parsimonious Fit Indexs0.75; Root Mean Squared
Error Approximations0.08; Degrees of Freedoms127.)Indicates p
-0.05.
design may not negatively influence the safe behav-ior decision model because employees know they cannot be changed. A steel plant operator must work with molten metal in large, overhead ladles. A long-distance trucker must operate a large vehicle at high speeds. A fisher must work from a boat in high seas. This does not mean that these hazards will not cause accidents, but their omnipresence makes them less predictive of behavior. On the other hand, hazards that did explain variance were those that managers could remove or abate — employees apparently sensed that when ‘‘fixable’’ operating hazards per-sisted, managers did not really care.
5.4.2. Safety climate
Although climate is often viewed as a macro-level organizational characteristic, safety climate can man-ifest a degree of variability within an organization. Some of these variabilities come from the ways in which different groups of people perceive top-level communication. For example, in the case of the steel company studied here, the department where vocal union officials happened to work gave lower safety climate ratings than some other departments where there were no vocal union officials. A positive safety climate will be characterized by an open door policy for hazard and accident reporting, a sincere concern for employee well-being, and fairness in accident investigations. If these conditions exist, our results
indicate that employees are likely to work more safely.
5.4.3. Pressure
Perceptions of pressure to value expediency over safety, as we have demonstrated, are influenced by hazards and safety climate. Beyond those factors, managers can also effect changes in perceived pres-sure by clearly communicating priorities and keeping safety visible during times of ramp-up. Perhaps the most well-known example in this regard may be found in the Toyota plants in Japan. Visitors to those plants often express amazement at Toyota’s commit-ment to safety. Not until safety has been established do these plants begin to focus on quality, and not until quality is under control are speed and efficiency addressed.
5.4.4. CaÕalier attitudes about safety behaÕiors
As we have discussed previously, people possess some innate tendencies toward risk-taking. Addition-ally, some jobs and industries will attract more than their share of people who seek or avoid risks. How-ever, organizations can influence the variables within this construct, beginning with those that fall to the
Ž
left of cavalier attitudes in our model i.e., hazards, .
climate, pressure . In addition, they may endeavor to select employees who are not high-level risk-takers and they may introduce behaviorally-based safety programs that focus on employee work practices instead of accident outcomes.
5.4.5. Safety-efficacy
As with the other constructs on the right-hand side of our model, we recommend that managers carefully consider the variables that precede safety-efficacy: hazards, safety climate, and pressure. Addi-tionally, in keeping with findings reported in the literature on self-efficacy, we prescribe hands-on training in safety procedures because going beyond classroom lectures to allow employees to test their skills at safety practices will build confidence.
5.4.6. General obserÕations
The system–person sequential model holds pre-scriptions of its own: the operating environment, and its technical and social characteristics, influence em-ployee safety behaviors. Operations managers can benefit from careful consideration of the linkages we have uncovered. Additionally, they can take actions to influence the individual constructs that we have examined by addressing factors not explicitly shown in our model. Our primary recommendation is that operations managers in manufacturing settings should appreciate the interdependence among the social and technical variables in the system–person sequence model. A change along one dimension can cause a profound series of chain reactions.
5.5. Limitations
Although this study adds to our understanding of safe and unsafe work behaviors, we must acknowl-edge that it presents some limitations, indicating the need for further research. First, the study was con-ducted in one firm in a single industry. This focus
gives us a homogeneous sample of responses from the same environment, allowing for initial tests of instrument reliability and defensible interpretations of dimensionality. Moreover, we were able to demonstrate that our baseline measurement model was interpreted similarly in two different plants, providing some sense that the results may be repeat-able across settings. However, future research should attempt to replicate our findings in other environ-ments.
A second limitation is the use of same-source data; relying on self-report data can inflate relations among modeled variables. However, we tried to
Ž .
reduce this potential problem by a positioning mea-sures of the indicators in different locations
through-Ž .
out the larger survey, b measuring the indicators Ž . with different types of response categories, c using
Ž . observationally based validity checks, and d find-ing corroboration from managerial data. Further-more, we tested a same-source measurement model and found support for the multidimensional nature of our constructs. We therefore believe it is unlikely that a common method factor could have explained our results.
One could also question the validity of the direc-tional arrows and sequencing in our model. For example, who is to say that pressure produces a negative safety climate, rather than the reverse? We recognized that correlation does not always indicate cause, so we tested several alternative models where sequences were altered. The net effect was that none of these models explained as much variance as the one we had built upon our preliminary field work and literature review. We would encourage more work in this area, however, to test these findings in other settings.
A final limitation is that models in the present study specified only a small number of relevant influences on safety behavior. Previous literature indicates that age, gender, overtime hours worked, and time on the job can have effects on safe work behaviors, over and above the constructs included in our models. To address this potential limitation, we conducted a post hoc test to compare a model that included these control variables as predictors of safe behavior in the system–person sequential model.
Ž .
control variables, x2s380.4), dfs182, CFIs
0.94; without control variables, x2s303.89), dfs
2 ) .
128, CFIs0.95; SCDT x s76.54 , dfs54 . In
the revised model, none of the added control vari-ables had a significant effect on safe behavior, and the direction and significance of the original path estimates remained unchanged. This test provided additional evidence for the robustness of the influ-ence of sociotechnical factors on safe behaviors.
In sum, we believe that the dearth of theory development and testing in the safety arena, our focus on scale development and dimensionality, tri-angulation of results through additional sources, and our interest in formulating a new model, all support our methodology and our chosen sample. Future research can expand upon our methods by including multiple organizations, monitoring change over time, and considering a greater range of data sources.
6. Conclusions
From a practical standpoint, our results indicate that workplace safety cannot be packaged neatly into an isolated domain within an organization, and that the operations function plays an important role in preventing costly accidents. Safety hazards and pro-duction pressures, in particular, fall into the domain of operations managers and appear to influence em-ployees’ decisions about safe work practices.
Most operations managers consider an employee’s propensity to engage in unsafe work behaviors as a significant outcome variable. Du Pont,
acknowl-edged for its accomplishments in the safety arena, has long emphasized that most accidents are caused by unsafe acts. This position can lead those who are less familiar with the need for a systems perspective to make the naıve assumption that because unsafe
¨
acts are performed by people they are therefore caused by people. Our model, and the data that support it, help to underscore the need for a broader understanding of these issues — although the indi-vidual performs the act, factors in the operating and social environment play a role in the person’s dispo-sition toward safe practices. From an operations manager’s perspective, it is especially noteworthy that operating hazards do more than just cause acci-dents — their presence influences the safety behav-ior of operators. We have captured about 35% of the variance explaining safe or unsafe behaviors, and we speculate that other organizational variables not cur-rently included in our model can help to explain additional variance. Future research will add to our understanding of safety in manufacturing environ-ments.Acknowledgements
The authors wish to thank the Kenan Institute for Private Enterprise at the University of North Car-olina for its support in the data-gathering phase of this research. We are also appreciative of the helpful comments provided by Terry Mitchell, Rex Toh, and Clay Whybark.
Appendix A. Scale content, item means, reliabilities
Ž .
Construct Scale items Item mean S.D. Cronbach’s a
Back hazards 0.80
Ž .
I stand for long periods of time. 7.51 3.62
Ž .
Work surface heights are incorrect. 5.62 4.00
Ž .
I work in physically awkward positions. 7.13 4.12
Ž .
I lift objects that are too heavy. 7.18 4.16
Ž .
I lift objects that are too bulky or large. 6.40 4.11
Ž .
I work on elevated surfaces or walkways. 6.19 4.47
Ž .
Industrial hygiene 0.80 hazards
Ž .
I work near electrical current. 8.53 4.45
Ž .
I work near open flames. 5.35 4.32
Ž .
I am exposed to toxic chemicals. 7.36 4.52
Ž .
I am exposed to infectious agents. 5.01 4.30
Ž .
I am exposed to toxic gas. 5.81 4.46
Ž .
I am exposed to radiation. 3.61 3.23
Sitting hazards 0.76
Ž .
I sit in the same place for long periods of time. 5.50 3.54
Ž .
My chair is uncomfortable. 4.45 3.93
Ž .
My chair is not sturdy. 4.20 3.54
Floor surface 0.85
hazards
Ž .
Work areas are cluttered. 7.12 3.94
Ž .
There are liquid spills on the floor. 6.55 4.14
Ž .
The floor is slippery. 6.70 4.07
Air condition 0.82
hazards
Ž .
Room temperatures are too hot. 6.60 4.12
Ž .
Room temperatures are too cold. 6.31 4.07
Ž .
Room air is too humid or damp. 5.79 3.99
Workplace 0.75
lighting hazards
Ž .
The light in my work area is too bright. 4.18 3.02
Ž .
There is not enough light where I work. 6.56 4.28
Ž .
There is glare from work surfaces. 5.46 3.99
Ž .
The lights in the work area flicker on and off. 5.34 4.14
Material hazards 0.74
Ž .
There are rough spots on the surfaces of materials. 6.99 4.47
Ž .
There are sharp edges on work materials. 8.56 4.52
Ž .
There is glare from work materials. 5.76 4.25
Ž .
I work with or near high temperature 7.41 4.72 materials.
Ž .
I work with or near low temperature 4.20 3.56 materials.
Ž .
Materials are difficult to reach. 5.15 3.75
Moving object 0.77
hazards
Ž .
I work near moving machine parts. 9.36 4.41
Ž .
There are large moving objects in my 9.85 4.24 work area.
Equipment 0.79
unavailability hazards
Ž .
Safety equipment is not within easy reach. 5.38 3.71
Ž .
Ž . Tools or equipment do not work the way 7.56 4.24 they should.
Ž .
I do not have the correct tool for the job. 5.76 3.90
Equipment 0.77
handling hazards
Ž .
I work with equipment that vibrates a lot. 6.28 4.33
Ž .
I work with tools that are awkward to hold. 5.80 4.21
Ž .
Toolsrequipment are too cold to hold 3.47 2.89 comfortably.
Ž .
Toolsrequipment are too hot to hold 4.47 3.73 comfortably.
Supervisory safety 0.94
climate
Ž .
I feel comfortable reporting safety or health 5.29 1.87 hazards to my immediate supervisor.
Ž .
I feel comfortable reporting work injuries or 5.38 1.80 health effects to my immediate supervisor.
Ž .
My immediate supervisor believes work 5.05 1.91 place safety and health are very important.
Ž .
My immediate supervisor is a good resource 4.94 1.89 for helping me to solve safety and health
problems.
Ž .
My immediate supervisor values my ideas 5.05 1.90 about improving safety and health.
Managerial safety 0.86
climate
Ž .
Top management believes work place safety 5.14 1.87 and health are very important.
Ž .
The unionrcompany safety committee is 5.22 1.76 effective in improving workplace safety
and health.
Ž .
The company is concerned about my safety 4.55 2.00 and health when I am away from work.
Ž .
Overall, this is a safe place to work. 5.06 1.72
Safety efficacy 0.83
Ž .
I am skilled at avoiding the dangers of 5.70 1.43 work place hazards.
Ž .
I am very active in removing work place 5.20 1.60 safety and health hazards.
Ž .
I am confident in my ability to remove 5.20 1.58 work place safety and health hazards.
Cavalier attitude 0.79
toward safety procedures
Ž .
Ž . I ignore some safety procedures if I am 2.17 1.56 trying to save time.
Ž .
The safety procedures do not seem 1.99 1.51 necessary.
Pressure 0.69
Ž .
I take safety shortcuts when I feel pressure 2.60 1.79 to work fast.
Ž .
It is difficult to do a task while following 2.91 1.85 all of the safety rules.
Ž .
My supervisor encourages shortcuts in 1.95 1.85 safety procedures.
References
Banduara, A., 1997. Self-efficacy: The Exercise of Control. Free-man, New York.
Bentler, P.M., 1995. EQS Structural Equation Program Manual. Multivariate Software, Encina, CA.
Bigos, S.J., Battie, M.C., Spengler, D.M., Fisher, L.D., Fordyce, W.E., Hansson, T., Nachemson, A.L., Zeh, J., 1992. A longi-tudinal, prospective study of industrial back injury reporting.
Ž .
Clinical Orthopaedics and Related Research 279 , 21–34. Bollen, K.A., 1989. Structural Equations with Latent Variables.
Wiley, New York.
Brown, K.A., 1984. Explaining group poor performance: an
attri-Ž .
butional analysis. Academy of Management Review 9 1 , 54–63.
Brown, K.A., 1996. Workplace safety: a call for research. Journal
Ž .
of Operations Management 14 1 , 157–171.
Brown, K.A., Mitchell, T.R., 1988. Performance obstacles for direct and indirect labour in high technology manufacturing.
Ž .
International Journal of Production Research 26 11 , 1819– 1832.
Brown, K.A., Mitchell, T.R., 1991. A comparison of just in time and batch manufacturing: the role of performance obstacles.
Ž .
Academy of Management Journal 34 4 , 906–907.
Brown, K.A., Mitchell, T.R., 1993. Organizational obstacles: links with financial performance, customer satisfaction, and job
Ž .
satisfaction in a service environment. Human Relations 46 6 , 725–757.
Browne, M.W., Cudek, R., 1992. Alternative ways of assessing
Ž .
model fit. Sociological Methods and Research 21 2 , 230–258. Burk, A.F., Smith, W.L., 1990. Process safety management within
Ž .
Du Pont. PlantrOperations Progress 9 4 , 269.
Churchill, G.A., Churchhill, G.A. Jr., 1998. Marketing Research: Methodological Foundations. Dryden, New York.
DeJoy, D.M., 1986. A behavioral-diagnostic tools for self-protec-tive behaviors in the work environment. Professional Safety, 26–30, December.
DeJoy, D.M., 1994. Managing safety in the workplace: an attribu-tion theory analysis and model. Journal of Safety Research 25
Ž .1 , 3–17.
DeJoy, D.M., 1996. Theoretical models of health behavior and
Ž .
workplace self-protection. Journal of Safety Research 27 2 , 61–72.
Deming, W.E., 1986. Out of the Crisis. MIT Center for Advanced Engineering Study, Cambridge, MA.
Dillman, D.A., 1978. Mail and Telephone Surveys: The Total Design Method. Wiley-Interscience, New York.
Flanagan, J.C., 1954. The critical incident technique. Psychologi-cal Bulletin 51, 327–358.
Gist, M.E., Mitchell, T.R., 1992. Self-efficacy: a theoretical analy-sis of its determinants and malleability. Academy of
Manage-Ž .
ment Review 17 2 , 183–211.
Hofmann, D.A., Jacobs, R., Landy, F., 1995. High reliability process industries: individual, micro, and macro organizational influences on safety performance. Journal of Safety Research
Ž .
26 3 , 131–149.
Hofmann, D.A., Stetzer, A., 1996. A cross-level investigation of factors influencing unsafe behaviors and accidents. Personnel
Ž .
Psychology 49 2 , 307–339.
James, L.R., Mulaik, S.S., Brett, J.M., 1982. Causal Analysis: Assumptions, Models, and Data. Sage, Beverly Hills, CA. Jermier, J.M., Gaines, J., McIntosh, N.J., 1989. Reactions to
physically dangerous work: a conceptual and empirical
analy-Ž .
sis. Journal of Organizational Behavior 10 1 , 15–33. Komaki, J., Barwick, K.D., Scott, L.R., 1978. A behavioral
approach to occupational safety: pinpointing and reinforcing safe performance in a food manufacturing plant. Journal of
Ž .
Applied Psychology 6 4 , 434–445.
Komaki, J.D., Heinzman, A.T., Lawson, L., 1980. Effect of training and feedback: component analysis of a behavioral
Ž .
safety program. Journal of Applied Psychology 65 3 , 261– 270.
Latzko, W.J., Saunders, D.M., 1995. Four Days with Dr. Deming. Addison-Wesley, Reading, MA.
MacCrimmon, K., Wehrung, T., 1992. Taking Risks. Free Press, New York.
March, J., Shapira, Z., 1992. Variable risk preferences and the
Ž .
forces of attention. Psychological Review 99 1 , 172–183. Mitchell, T.R., Wood, R.E., 1980. Supervisors’ responses to
subordinate poor performance: a test of an attributional model.
Ž .
Organizational Behavior and Human Performance 25 2 , 123–138.
is Good Business: The Du Pont Story. Van Nostrand-Rein-hold, New York.
National Safety Council, 1999. Injury facts. National Safety Coun-cil, Itasca, IL.
Norman, D.A., 1988. The Design of Everyday Things. Doubleday Currency, New York.
Osada, T., 1991. The 5S’s: Five Keys to a Total Quality Environ-ment. Asian Productivity Organization, Tokyo.
Perrow, C., 1984. Normal Accidents. Basic Books, New York. Pidgeon, N.F., 1991. Safety climate and risk management in
Ž .
organizations. Journal of Cross Cultural Psychology 22 1 , 129–140.
Ray, P.S., Purswell, J.L., Bowen, D., 1993. Behavioral safety program: creating a new corporate culture. International Jour-nal of Industrial Ergonomics 12, 193–198.
Ritchie, K.A., McEwen, J., 1994. Employee perceptions of work-place health and safety issues. Can a questionnaire contribute
Ž .
to health needs assessment?. Occupational Medicine 44 3 , 77–82.
Savery, L.K., Wooden, M., 1994. The relative influence of life events and hassles on work-related injuries: some Australian
Ž .
evidence. Human Relations 47 3 , 283–305.
Schmidt, F.L., 1973. Implications of a measurement problem for expectancy theory research. Organizational Behavior and
Hu-Ž .
man Performance 10 2 , 243–251.
Ž .
Schneider, B. Ed. , Organizational climate and culture. Jossey-Bass, San Francisco.
Sedgwick, J., 1993. The complexity problem. In: Atlantic Monthly.
Ž .
pp. 6–104, March .
Slappendel, C., Laird, I., Kawachi, I., Marshall, S., Cryer, C., 1993. Factors affecting work-related injury among forestry
Ž .
workers: a review. Journal of Safety Research 24 1 , 19–32. Thompson, R.C., Hilton, T.F., Witt, L.A., 1998. Where the safety rubber meets the shop floor: a confirmatory model of manage-ment influence on workplace safety. Journal of Safety
Re-Ž .
search 29 1 , 15–24.
Williams, L.J., Podsakoff, P.M., 1989. Longitudinal field methods for studying reciprocal relationships in organizational behavior research: toward improved causal analysis. Research in Orga-nizational Behavior 11, 247–292.
Wood, R.E., Bandura, A., 1989. Social and cognitive theory of organizational management. Academy of Management Review
Ž .
14 3 , 361–384.
Vaughan, D., 1996. The Challenger Launch Decision: Risky Technology, Culture, and Deviance at NASA. University of Chicago Press, Chicago.
Zohar, D., 1980. Safety climate in industrial organizations: theo-retical and applied implications. Journal of Applied
Psychol-Ž .