RESISTIVITY AND REFRACTION SEISMIC MAPPING IN
PRAMBANAN TEMPLE AREA
Sismanto1, Eddy Hartantyo1, and Agus Waluyo2
1Geophysics Laboratory, University of Gadjah Mada
email address: [email protected]
2
Archaeological Site Office of Yogyakarta [Balai Pelestarian Peninggalan Purbakala Yogyakarta]
ABSTRACT
Due to the Yogyakarta’s earthquake of 5.9 Richter scale in May 2006, the Prambanan temple (Siwa temple) has deformation up to 5 cm in the body stone, and some of the surface rocks in the upper, middle, and foot of the temple body are collapsed. The effect of the earthquake will influence the stability of the rock or soil in the subsurface. Thus, It is very importance to study the condition of the subsurface rock of the Prambanan site by geophysical method, i.e., geo-electric and seismic technique. The acquisitions of resistivity and seismic data are carried out in January 16-17, 2007. Five seismic and resistivity lines have been measured and the Hagiwara method has been applied to estimate the interface de pth and velocity from the seismic data. The resistivity configuration system of in line position is dipole -dipole arrangement. The processing and the modeling use RES2DMOD and RES3DMOD. Two points are measured by vertical electrical sounding (VES) in Schlumberger configuration (between Siwa and Nandi temples) to know the resistivities distribution of soil vertically. The Progress 3.0 software was used for data processing. The results show that the bodies of temples are supported by hard rock velocity is 400 -500 m/s and the resistivity is > 200 ohm-m, whereas the depth of the hard rock is (4 -8) m from the surface. The thickness of the seal soil is about 8 m in the south area and 4 m in the north area. The low resistivity in front of the Siwa, Wisnu and Brahma temple at east side, was estimated as a drainage system of the Prambanan temple area. For more than 13 m depth finds water saturated sandstone.
Keywords: Prambanan Temple, VLF, Seismic
Makalah diterima 12 Agustus 2007
1. INTRODUCTION
Yogyakarta is frequently disturbed by severe natural disasters, such as subduction earthquakes, flooding, volcano eruptions, landslides, and tsunamis. These disasters are geologically coupled to the same process, i.e. the (5-7) cm per year tectonic convergence of the Australian plate beneath the Sunda plate. Yogyakarta is located close to the Merapi
magmatis and phreatomagmatic eruption. The eruptions are not so explosive at times, but the flow of pyroclastic almost happens in each eruption. The material of pyroclastic consists of blocks, tephra, and lapili (Camus, et.al., 2000). The Merapi activ ities make some material to be distributed around the body till the foot of Merapi. Distribution of the material, which depends on the topography and geographic condition, forms and characterizes a composition of pyroclastic material and flow (Ratdomopurbo and Andreastuti, 2000), so it makes an alluvial substratum system thick enough.
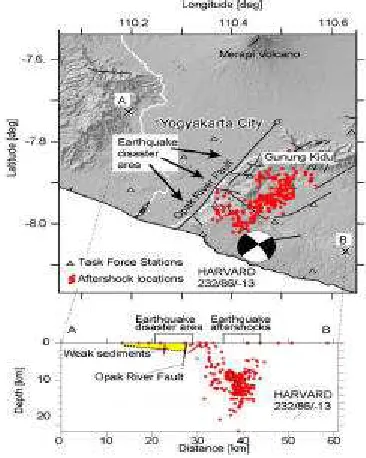
On Saturday 26 May 2006 Yogyakarta was struck by a shocking earthquake at 22:54 UTC (local time 5:54 am). Although the destruction area and the known fault traces suggested that the 26 May 2006 earthquake occurred along the Opak River Fault, but Walter, et.al, 2007 indicates in the preliminary aftershock study point towards a up till now unknown fault at (10-15) km distance to the east (Figure 2). They presume that the measure of destruction near the Opak River Fault was a factor of local site effects such as due to a weak alluvial substratum intensifying the destructive energy of shear waves related to the Mw6.4 event.
Due to Yogyakarta’s earthquake of 5.9 Richter scale in May 2006, the Prambanan temple (Figure 3) has deformation up to 5 cm, and some of the surface rocks in the upper, middle, and foot of the temple body were collapse (Figure 4). The effect of the earth-quake will influence the stability of the rock or soil in the subsurface. It is very importance to study the condition of the subsurface rock of the Prambanan site by geophysical method, i.e., geo-electric and seismic technique. Next, the geotechnical study is conducted for assessing soil condition that is necessary for simulating seismic motion and analyzing the stability of the foundation during an earthquake. In the structural analysis, the building’s response to an input seismic motion will be analyzed, as means of clarifying the causes of earthquake damage and examining the possibility of damage to the inner concrete structure. So that,
it needs microtremors measurement to assess fundamental dynamic characteristic of the buildings and the ground.
Figure 1. Yogyakarta city, Prambanan temple compound, Merapi Volcano, and the opak fault.
Figure 2. The earthquake disaster area was near the Opak River, initially implying that the Opak River Fault was the source of the earthquake.
In Figure 2, aftershock measurements recorded imme-diately after the main event suggests that
Yogyakarta
OPAK FAULT
Prambanan temple Coumpond
a fault at 10-15 km eastward distance is the earthquake location. Aftershocks are shown by red circles, seismometer stations by black triangles. The cross -section shows the location of the aftershocks, and the distance to the earthquake disaster area (Walter, et.al, 2007).
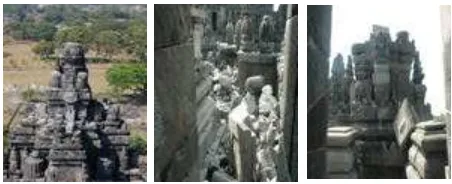
Figure 3. Overview of the beau tiful Prambanan temple coumpond
Figure 4. Some damages and collaps of stone on the summit and the body of the Prambanan temple coumpond due to the May 26 th, 2006 earthquake
2. METHODS
Seismic Method
The seismic method is one of the most practical and convenient method to determine subsurface geological condition and mechanical properties. By inference from the propagation veloc ity; attenuation and wave shape of a
propagating wave, we can indicate important
characteristic of in situ rock and soil. The
refraction seismic surveys use a source of wave energy (hammer) and some geophones to record the refraction wave that emerge on the surface. From the first break of the refraction wave at each geophone, we can make a time-distance curve that lead to estimate the velocity and depth of the refractor layer. The refractor layer is indicated by difference velocity and
characteristic of in situ rock or soil. Hagiwara
and Mashuda method had been used to estimate the interface depth and velocity. The comprehensive theory and method are described in Sheriff and Geldart, 1995.
Geo-electric Mapping
The geo-electrical mapping is a non-destructive survey to know the resistivities distribution of the soil laterally. The procedure is by injecting DC electrical current into the ground, and then measures the voltage on the surface by double potential electrodes at in line position. The configuration system of in line position is dipole -dipole arrangement. The comprehensive theory and method are described in Telford, et.al, 1976. The processing and the modeling use RES2DMOD and RES3DMOD. Two points are measured by vertical electrical sounding (VES) in Schlumberger configuration to know the resistivities distribution of soil vertically. The
data processing uses Progress 3.0 software.
Data acquisition
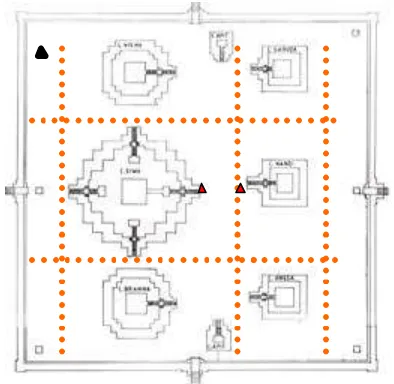
The acquisitions of geo-electric and seismic data are carried out in January 16-17, 2007.Five seismic and geo-electric lines are shown in Figure 5, i.e., US-1, US-2, US-3, TB-1, and TB-2, two points S1 and S2 are the vertical electrical sounding (between Siwa and Nandi temples).
mapping data with electrode space of 5 meter. Whereas, the measurements of sounding data were performed by Schlumberger configuration for determining the depth of temple stone remains.
Figure. 5. The five seismic and geo-electric lines are in the same position. Whereas, S1 and S2 are the vertical electrical sounding points
3. RESULTS
Geo-electrical survey
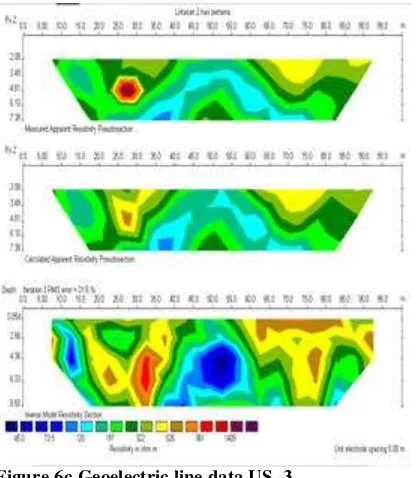
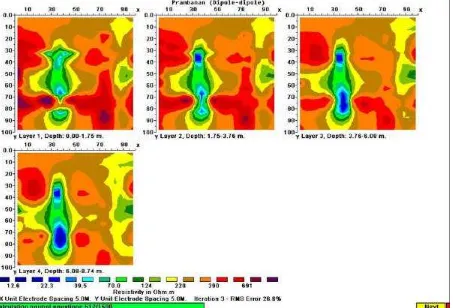
Figure 6a-6e, are the measurement result of resistivity distributions in dipole-dipole configuration for difference line i.e, US-1, US-2, US-3, TB-US-1, and TB-2. For each line, the upper data is the apparent resistivity of the measurement, the middle is the resistivity response of the interpretation model, and the resistivity interpretation model is at the bottom of figure. In the interpretation model it appears that there is a low resistivity zones (in blue to green color), and the rest are a high resistivity area. The horizontal slice of the resistivity distributions are shown in Figure 7. The depth of the anomaly is 2 m to 8 m; physically this may be caused by wet soil. According to Izjerman, in the Prambanan temple vicinity there is a lot of drainage system to absorb the surface water until 5.75 m depth of wet soil
under the floor (Jordaan, 1996). The anomalies (low resistivity zone) are interpreted as drainage system infiltration in the subsurface. Meanwhile, the high resistivity zone depth is about 7 to 8 m (the red one). The high resistivity zone indicates the hard rock layer that is a base of the soil. The existence of wet sand or soil in the subsurface rock is good for supporting the body of temple.
Figure 6a. Geoelectric line data US -1(left) (South
ßà North)
Figure 6 b. Geoelectric line data US -2 (right) (South ßà North)
S
T
T
U U U
Figure 6c Geoelectric line data US -3 (South ßà North)
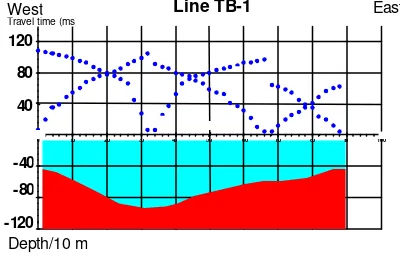
Figure 6d. Geoelectric line data TB -1 (West ßà East)
The vertical electrical sounding interpretation of point S1 and S2 are illustrated in Figure 8. S1 is located in east side of Siwa
and S2 is located in west side of Nandi. Based on the model, the thickness of the surface soil is less than 2 m, and there is about 2 m thickness of high resistivity layer (ohm-m) at Siwa floor. We interpret it as an andesitis rock or a foundation rock. However, in S2 the resistivity is not so high, and below this layer is low resistivity area, it may be a wet sandstone, wet soil, and gravel as a water level. According to Ijzerman in Jordaan, 1996 in the depth of 5.75 m under the floor, there was a container 41 cm long and wide and 53 cm deep. The top of lid, which is made of soft marlstone, diamond-shape and coping of soft, light-yellow sandstone fits into the container. The foundation consists of three layers of stone, which together achieve a thickness of 1.15 m. On digging further, round river stones in sand were discovered and water was discovered at 15.90 m.
Seismic Mapping
The seismic first break time measurement and processing data are plotted in Figures 9a -9e. The depths for each line are illustrated in those figures as well. The velocity for first layer (in white color) is about (200-270) m/s which is interpreted as surface rock. The velocity of the second layer in brown color is (400-500) m/s which is indicated as a hard rock. Figure 9a (line US-1) indicates that there is a different depth. The depth in the north side is relatively shallow (5 m), whereas the depth in the south side is about 8 m. For line US-2 (figure 9b), the depth of the hard rock is relatively flat in 8 m. The depth in line US-3 (figure 9c) is not so difference with line US-1, that is about 8 m in the south area and 5 m in the north side.
4. CONCLUSION
The results show that the bodies of temples are supported by hard rock whose velocity is (400-500) m/s and resistivity is > 200 ohm-m, whereas the depth of the hard rock is (4-8) m from the surface. The thickness of the seal soil is about 8 m in the south area and 4 m in the north area. The low resistivity in front of the Siwa, Wisnu and Brahma temple at east side, were estimated as a drainage system of the Prambanan temple area. In the depth of more than 13 m we will find sandstone with saturated of water.
REFERENCES
Camus, G., Gourgaud, a., Mossand-Berthommier, P.C., and Vincent, P.M., 2000. Merapi (Central Java, Indonesia) : An Outline of Structural and Magmatological Evolution, with a Special Emphasis to the Major
Pyroclastic Events, Journal of
Volcanology and Geothermal Research, Vol. 100, Elsevier Scientific Publishing Company, Amsterdam.
Jordaan, R.E., 1996. In Praise of Prambanan.
KITLV Press, Leiden, p.119-134.
Ratdomopurbo, A., dan Andreastuti, S., 2000.
Karakteristik Gunung Merapi, Balai Penyelidikan dan Pengembangan Teknologi Kegunungapian, Yogyakarta. Sheriff, R.E, and Geldart, L.P., 1995.
Exploration Seismology, 2nd edition, Cambridge University Press.
Telford, W. M., Geldard, L. P., Sheriff, R. E.,
and Keys, D. A., 1976. Applied
Geophysics, Cambridge University Press, London.
Walter T. R., B.-G. Luehr, R. Wang, Sobiesiak, H. Grosser, H. -U. Wetzel, C. Milkereit, J. Zschau, J. Wassermann, P.J. Prih Harjadi, S. W. , and Kirbani Sri
Brotopuspito, 2007, A city built on jello:
Figure. 7. Horizontal distribution modeling of resistivity data layer by layer (RES3DMOD)
Figure 8. Vertical electrical sounding interpretation of points S1 and S2 by Progress 3.0 Andesit (foundation?)
S-1 S-2
The surface soil
Sandstone, gravel, and wet soil
Figure 9a.Line US -1 seismic data and its depth interpretation in dm. The first layer velocity is (200-270) m/s, and the hard rock velocity is (40 0-500) m/s
Figure 9 b.Line US-2 seismic data and its depth interpretation in dm
-120 its depth interpretation in dm
-120
Figure 9d. Line TB-1 seismic data and its depth interpretation in dm
Figure 9e. Line TB -2 seismic data and its depth interpretation in dm
Depth/10 m
-120 120