Rural and Urban Differences in the Eye Health of High School Students
Andi Kusnawan,1 Ine Renata Musa,2 Jimmy Setiadinata3
1Faculty of Medicine, Universitas Padjadjaran, 2Department of Ophthalmology, Faculty of Medicine, Universitas Padjadjaran/National Eye Center, Cicendo Eye Hospital, Bandung,,
3Departement of Physiology, Faculty of Medicine, Universitas Padjadjaran
Abstract
Background: Visual impairment is a serious health problem. The World Health Organization (WHO) estimates that 80% of the incidence of visual impairment occurring globally could be prevented or treated. Several factors responsible for high rates of uncorrected refractive errors are the lack of awareness about the early detection on the unequal distribution regarding health services and a culture of compliance. This study was aimed to identify the differences of the level of visual acuity and self-perception of the visual functions between high school students in the urban and rural areas.
Methods: A cross sectional study was conducted among 94 high school students in two different schools, urban and rural areas during November 2012, using the simple random sampling technique. The study was performed through interviews and examination of visual acuity using Rapid Assessments of Avoidable Blindness. The collected data were analyzed using Mann-Whitney test.
Results: A total of 93.6% of respondents had good visual acuity. Self-perception of the visual functioning test showed that most respondents gave good answer. The statistical test using Mann-Whitney showed that there was no difference in level of visual acuity and self-perception of visual function between urban and rural students (p>0.05).
Conclusions: Most of the high school students have good visual acuity and good self-perception of their visual function but there is no difference between rural and urban areas. [AMJ.2015;2(3):448–52]
Keywords: High school students, rural, self-perception regarding visual function, urban, visual acuity.
Correspondence: Andi Kusnawan, Faculty of Medicine, Universitas Padjadjaran, Jalan Raya Bandung-Sumedang Km.21, Jatinangor, Sumedang, Indonesia, Phone: +6285723982556 Email: andikusnawan@yahoo.com
Introduction
Visual impairment is a serious health problem occurring worldwide. The World Health Organization (WHO) estimates that approximately 314 million people are visually impaired and 45 million of them are blind. WHO estimates that 80% of the incidence of visual impairment can be prevented or treated.1,2
Refractive error is one of the visual impairments that is common and easy to diagnose and can be corrected using glasses or contact lenses. In line with this, refractive errors can be detected by routine screening at a clinic or can also be screened in communities such as screening that was done at school.2-4 However, there are still obstacles in handling such cases. Moreover, there is still lack of
patient awareness regarding the vision problems
Several factors responsible for high rates of uncorrected refractive errors are the lack of awareness and early detection of the problem regarding visual impairment in the community. Unequal distribution of health services in each region and the lack of a culture of compliance also remains an obstacle that contributes to this problem.2
to evaluate their eye health and, sometimes, it
is the first and rare chance of vision assessment
for most students.3
Indonesia is still facing the problem of health care distribution, which has not been equally disseminated. It also occurs on the aspects of
eye health care. There is a deficiency in the
number of ophthalmologists and an uneven distribution across regions in Indonesia. Furthermore, the Indonesian Health Minister stated that 54 percent of ophthalmologists were gathered on Java Island and the rest were scattered on other islands of Indonesia. This condition can lead to different level of eye health care services in certain areas and could result in different eye health level between areas in this country.5,6
This study aimed at determining whether there are differences in the level of visual acuity and self-perception of the visual function in high school students in the urban and rural areas, who do not use a refractive correction device.
Methods
This is a cross sectional study, and was conducted to school children in two different high schools, an Urban high school in Bandung and a Rural high school in Sumedang. This study was conducted during November 2012. The participants of this study were students of a rural high school and an urban high school. Urban and rural high schools were assumed to have differences in eye health care service provider coverage. This could be seen from the distance of each high school to a nearby eye health care service; from urban high school, it was only as far as 1.1 km whereas from rural high school it was as far as 14.6 km. The participants were only the students of urban high school and rural high school
who did not use a refractive error correction device, eyeglasses, or contact lens. From urban high school, there were 325 students and 299 students from rural high school who did not use a refractive error correction device. Those
who did not follow the research until finished
and had a history of surgery involving the media refractive were excluded.
Respondents from each high school meeting the inclusion and exclusion criteria for this study would be selected randomly. The minimum sample size for this study was 31 participants from each high school. The proportion of children visual impairment in previous studies was 9.32% and 30% of minimal proportion difference, with power
test of 80% and 5% of significance level.
Visual acuity was measured using the Rapid Assessments of Avoidable Blindness (RAAB) technique. This technique used a chart with an “E” optotype size 18 of the Snellen chart and an “E” optotype size 60. On examination, respondents were asked to read the chart at 6 or 3 meters distance on each eye, right eye and left eye. From this examination visual acuity 6/18, 6/60, and 3/60 will be obtained7.
Self-perception of the visual function was measured using the WHO Prevention of Blindness and Deafness (PBD) Visual Functioning Questionnaire which has been validated. The questionnaire consists of 20 questions covering information regarding the respondent’s characteristics and perception about visual function. The information included name of the student, age, gender and address. Perception about visual function asked were about general vision, ocular pain
or discomfort, distance vision difficulty, near vision difficulty, glare, light or dark adaptation, color vision difficulty, role limitations, and
social functioning.8
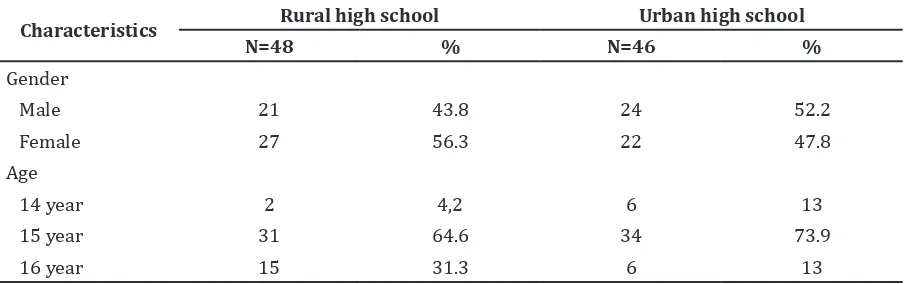
Table 1 Demographic Data
Characteristics Rural high school Urban high school
N=48 % N=46 %
Gender
Male 21 43.8 24 52.2
Female 27 56.3 22 47.8
Age
14 year 2 4,2 6 13
15 year 31 64.6 34 73.9
Results
Ninety-six (96) high school students participated in this study. The respondents consisted of 48 students (51.1%) from rural high school and 46 students (48.9%) from urban high school. The age of the students ranged from 14 to 16 years-old, most of them were 15 years-old. Thirty-one (31) students (64.6%) were from rural high school and 34 students (73.9%) were from urban high school. The numbers of male and female participants were almost equal. Table 1 systematically provides information regarding the characteristics of the studied participants.
The results of visual acuity measurements show that almost all students had normal visual acuity 6/18 in both eyes. Normal visual acuity of 6/18 in both eyes was found in 88 (93.6%) students. Visual acuity 6/60, in at least one eye, was found in 6 (6.4%) students. Table 2 shows visual acuity from rural high school and urban high school.
According to the location of the occurring visual impairment, there were four students with impaired vision in both eyes and two students with impaired vision in only one eye. The number of students who had impaired vision in urban high school were four students whereas at rural high school were two students.
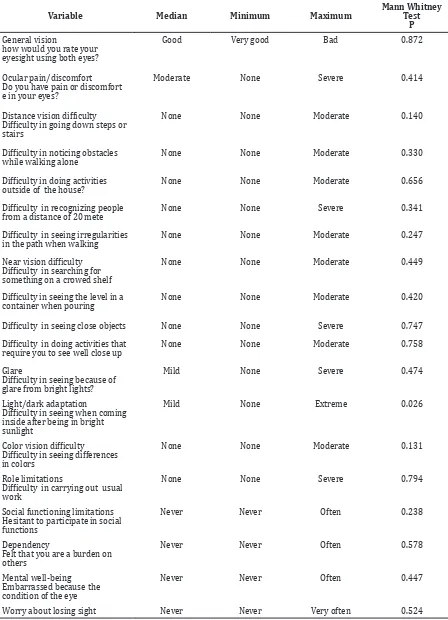
Self-perception of high school students regarding visual function in general was at good level. Only nine students stated that their conditions were very good. The rest stated that their conditions were good to bad. Table 3 systematically provides information about the distribution of data on self-perception according to the median, maximum, and minimum.
The Mann-Whitney test for comparison of the visual acuity in rural high school and urban high school was p = 0.372. The results demonstrate that visual acuity in both schools
did not have significant difference.
In general, self-perception of the visual
function did not show any significant
differences in both high schools. The Mann Whitney test showed p values were generally greater than 0.05. However, comparisons to questions regarding light or dark adaptation, the Mann Whitney test showed p = 0.026.
Discussion
In this research, the level of visual acuity in both high school students almost (93.6%) showed normal conditions. This might occur because the subjects in this study were high school students who did not use refractive correction devices. Children in the age range 14 to 16 years-old are the Middle Adolescence.9 At this level, a child can express feelings that occurred to him, including those t to his eyes. Therefore,if there is abnormality in their body, including in the eye condition, they will immediately consult or complain to someone, either to teachers or parents. If this has been consulted, eye disorders may be corrected immediately.
The number of students who had visual impairment in urban high school were four students and two students at rural high school. According to the Mann Whitney test there
was no significant difference in visual acuity
between urban high school and rural high school students. In the concept of public health, several factors can affect the level of health. These include genetics, social environment, social and economic status, health service, and behavior.10
Self-perception of the visual function performed in both high schools in this study
showed no significant difference. It is shown in
the assessment of the condition of the eyesight. Students in both high schools had given similar answer. Most of them answered that their eyesight was in good condition which is in accordance with the results of visual acuity tests showing that 93.6% of the respondents have visual acuity in good condition.
Data collection was performed in Table 2 Visual Acuity
Visual acuity
Rural high school n=48
Urban high school n=46
Two eyes one eye Two eyes one eye
6/18 46(95.8%) 1(2.08%) 42(91.3%) 3(6.52%)
6/60 1(2.08%) 1(4.16%) 1(2.17%) 3(6.52%)
Table 3 Self Perception about Visual Function
Variable Median Minimum Maximum
Mann Whitney Test
P
General vision
how would you rate your eyesight using both eyes?
Good Very good Bad 0.872
Ocular pain/discomfort Do you have pain or discomfort e in your eyes?
Moderate None Severe 0.414
Distance vision difficulty Difficulty in going down steps or
stairs
None None Moderate 0.140
Difficulty in noticing obstacles
while walking alone
None None Moderate 0.330
Difficulty in doing activities
outside of the house?
None None Moderate 0.656
Difficulty in recognizing people
from a distance of 20 mete
None None Severe 0.341
Difficulty in seeing irregularities
in the path when walking
None None Moderate 0.247
Near vision difficulty Difficulty in searching for
something on a crowed shelf
None None Moderate 0.449
Difficulty in seeing the level in a
container when pouring
None None Moderate 0.420
Difficulty in seeing close objects None None Severe 0.747
Difficulty in doing activities that
require you to see well close up
None None Moderate 0.758
Glare
Difficulty in seeing because of
glare from bright lights?
Mild None Severe 0.474
Light/dark adaptation
Difficulty in seeing when coming
inside after being in bright sunlight
Mild None Extreme 0.026
Color vision difficulty
Difficulty in seeing differences
in colors
None None Moderate 0.131
Role limitations
Difficulty in carrying out usual
work
None None Severe 0.794
Social functioning limitations Hesitant to participate in social functions
Never Never Often 0.238
Dependency
Felt that you are a burden on others
Never Never Often 0.578
Mental well-being Embarrassed because the condition of the eye
Never Never Often 0.447
conjunction with student’s academic hours. That condition lead to the data collection process in this study, which was not a randomized in all classes. Due to the limitations of the research competences of the instruments used to measure visual acuity, the instruments could only pass judgment on the cut of point of visual acuity condition, normal, and visual impairment.
In conclusion, there is no difference in visual acuity between the students in rural high school and in urban high school. There was also no difference between self-perception of the visual function in both high schools. Although
there were no significant differences, some
students still had poor visual acuity level. The level of visual acuity or visual impairment can be affected by other factors such as genetic. This factor causes abnormal refractive media condition or daily behavior; such as the habit of looking at the screen intensely, the intensity of reading books, and the position when reading a book. Therefore, routine screening program organized by the school in collaboration with the school health unit (usaha kesehatan sekolah/UKS) and public health center (pusat kesehatan masyarakat/PUSKESMAS), should have some improvements. Henceforth, the students who have visual acuity in bad condition should be provided with further examination and correction refractive device. Although this study has been answered and the conclusion has been drawn, this study is still open for further analysis. It could be achieved by using different research methods or different measurements methods and with more respondents included in the study.
References
1. WHO. Action plan for the prevention of avoidable blindness and visual impairment 2009–2013. Geneva: WHO Library Cataloguing Data; 2010.
2. WHO. Sight test and glasses could dramatically improve the lives of 150
million people with poor vision. [Cited 2012 April]; Available from: http:// w w w. w h o . i n t / m e d i a c e n t r e / n e w s / releases/2006/pr55/en/.
3. Toledo CC, Paiva APG, Camilo GB, Maior MRS, Leite ICG, Guerra MR. Early detection OF visual impairment and its relation to academic performance. Brazil; 2010 (Cited Agustus 2015). Available from http:// www.scielo.br/pdf/ramb/v56n4/en_13. pdf
4. Ilyas S, Yulianti SR. Ilmu penyakit mata. 4thed. Jakarta: Badan Penerbit FKUI; 2011. p. 72–82.
5. Mikail B. Masih dibutuhkan banyak dokter mata. Padang: Kompas.com; 2012 [Cited 2012 December] available from: http://health.kompas.com/ read/2012/01/12/10234743/Masih. Dibutuhkan.Banyak.Dokter.Mata
6. Indonesia kekurangan banyak dokter mata. JAKARTA; 2012 [Cited 2012 December] available from : http://m.pikiran-rakyat. com/node/214335
7. Limburg H, Meester W. Rapid assessment of avoidable blindness (RAAB) instruction manual. London: International Centre for Eye Health London School of Hygiene & Tropical Medicine; 2007:20-22.
8. WHO. Consultation on development of standards for characterization of vision loss and visual functioning. Geneva: WHO; 2003; [Cited 2012 April]; Available from: http://www.who.int/ ncd/vision2020_actionplan/documents/ VisualStandardsSept03report.pdf.
9. Sadock BJ, Sadock VA. Kaplan & Sadock’s synopsis of psychiatry. 10thed. Philadelphia: Lippincott Williams & Wilkins; 2007. p.38.