http://www.sciencepublishinggroup.com/j/jhrm doi: 10.11648/j.jhrm.20160406.12
ISSN: 2331-0707 (Print); ISSN: 2331-0715 (Online)
The Use of Talent Management Instruments and
Procedures in Germany: A Broad Explorative Study of
Effectiveness and Success Factors
Jens Landwehr
Faculty of Management, Economics and Social Sciences, Seminar of Personnel Economics and HRM, University of Cologne, Cologne, Germany
Email address:
[email protected]To cite this article:
Jens Landwehr. The Use of Talent Management Instruments and Procedures in Germany: A Broad Explorative Study of Effectiveness and Success Factors. Journal of Human Resource Management. Vol. 4, No. 6, 2016, pp. 77-99. doi: 10.11648/j.jhrm.20160406.12
Received: November 25, 2016; Accepted: December 7, 2016; Published: January 5, 2017
Abstract:
While talent management has become a fixed term on HR agendas worldwide, it appears that that quality of talent management practices, infrastructure, and success measurements of talent management in German organizations is still low. This explorative empirical study – one of the largest ever done on this topic in Germany - shows that roles and responsibilities in the talent management process remain often unclear, processes and tools such as an IT infrastructure are often weak, and success measures are often not applied. But there is also surprising evidence that companies in Germany largely apply the wrong measures. It seems that in many German organizations, instruments and procedures are being applied which either have a rather neutral or even can have a counterproductive effect on talent management success. Reversely, instruments which can be linked empirically to talent management success, are not being applied as consistently as you would expect based on HR professionals knowledge on the subject matter. This paper presents the results of an explorative study on the scope of talent management in German organizations, the use of specific instruments and procedures, and links the use of instruments to various measures of success, most notably the assessment by talent management professionals. The results are both startling and surprising: Instruments most widespread in German organization are those which often have a neutral or even negative effect on talent management success. Starting with the question, how important talent management from the perspective of the organization, the study provides a detailed view on the use of specific measures and the processes applied by German organizations. Based on the responses of 125 participants of an online survey with talent managers and other HR professionals, we found a lack of commitment to talent management processes by leadership as a possible explanation for the state of talent management in Germany.Keywords:
Talent Management, Success Factors, Success Measures, Infrastructure, Information Technology, Benchmarking, HR Processes, Explorative Study1. Introduction
While the majority of organizations in Germany apply some sort of talent management, objective success measures, IT support or even external benchmarking is used to a much lesser degree. As a result, the quality of talent management in German organizations is low, and also German employees are often unsatisfied with the HR talent management measures applied in their organizations (Deloitte LLC study series 2009, 2012).
Historically, talent management received little attention in
strategic personnel management.
Since the term was first used in 1997 in the context of the war of talents claimed by McKinsey, not a single consistent or concise definition of talent management has emerged (Aston, Morton 2005). Lewis & Heckman (2006) identified a ‘disturbing lack of clarity regarding the definition, scope, and overall goals of talent management’, and identified three key streams of thought: Talent management as substitute for human resource management, talent management as the development of talent pools, and finally the management of talented people. Collings & Mellahi, (2009) define talent management more precisely as ‘activities and processes that involve the systematic identification of key positions’ differentially contributing to the success of the organization, the development of talent pools, and the HR architecture or processes to help fill these positions.
Today, talent management strategies continue to be one of the areas within modern HR with particularly high interest. It seems quite paradoxical that despite the large professional interest, little research has been done to identify the real success factors of instruments and procedures, and how these link to financial benefits for the organization. In addition, there is largely a low theoretical understanding on how talent management practice differs across countries and links to culture. The literature defines talent management as strategic HR activities in the areas of recruiting, performance management, skill and competency management, compensation and succession management with the objective of balancing expectations of critical workforce segments with the requirements of the organization. Most authors explicitly separate talent management from strategic workforce planning which includes the long-term cost and benefit simulations of talent management and always includes both quantitative and qualitative talent criteria.
While the increase in importance is clear and backed by the results of this paper, the literature is unclear about its reasons (Festing, Schäfer & Scullion, 2013). Organizations try to align their talent management programs to their needs, may it be driven either by requirements in the area of recruiting, succession management, personnel development, or diversity and are largely basing their approaches on different schools of thought.
Some authors link the increased interest in talent management to stronger demands from the business towards the HR function (as a support function). These demands include balancing the supply and demand of the workforce in light of the demographic change (Capelli, 2008) as well as HR process efficiency (Ulrich, 2008). Other authors link the increase of talent management largely to increasing demands from new generations of applicants’ with changed values and preferences (Ng, Burke, 2005). Recently, authors assume that the interest for talent management could be based on an intended façade (Brunson, 1989).
The theoretical basis of talent programs is thin. A major driver for talent is clearly rewards theory, however recently it has been emphasized that monetary benefits are less responsible for good performance than internal motivators.
Other theoretical concepts educating good talent management are equilibrium theory, and goal achievement theory with very little self-determination theory, self-regulation theory (Van Nuland, 2010).
While the most commonly stated benefit of talent management is to identify, develop and retain the most valuable critical employees (Leigh 2009; Germain 2010), some authors stress how potentially harmful it can be for an organization to focus on a small group of people while the contribution of the others is ignored (Pfeffer 2001). Other studies are more pragmatic and emphasize the use of effective talent instruments (Stahl 2007).
In sum, these developments have led over the past years to a striking expansion of talent management systems and instruments in many organizations. However, in many instances the effectiveness of instruments is not clear and the most effective instruments are not necessarily used most often. Specifically, in German organizations talent management is applied for the wrong reasons such as external demands from the business whereas true understanding of cause and effect of talent processes are highly undervalued and not sufficiently understood especially with respect to younger applicants. This has led in Germany to the use of wrong of wrong instruments and procedures.
2. Research Questions
The aim of this study is to establish empirically the relationship between the use of specific instruments and procedures and objective success measures in Germany. In order to clarify the linkages between instruments and talent management success, we will draw separate hypotheses for different talent management components indicating quality, such as processes, infrastructure and instruments. Thus, we will try to explore the reason why companies in Germany systematically and consistently apply talent instruments and procedures which are counterproductive.
Initially, we measure today’s weight of talent management in German organizations and establish a complete overview over the prevalence of specific instruments and procedures. By linking the use of instruments to several measures of success (assessment of talent management success, external recruiting rate, fluctuation), we – for the first time - identify several clear success factors of talent management. The aim is to both develop a structured approach to assessing the effectiveness of instruments, processes and procedures as well as identifying objective success factors.
We expect an increasing importance of talent management and low levels of infrastructure and commitment towards talent management roles. In addition, we expect relatively low use of success-critical instruments. Moreover, we also expect a relatively low use of other success factors as reason for the relatively low levels of contentedness with talent management processes.
management with two different lines of thought. The study was designed to help identify factors either in support or in contradiction to one of these hypotheses. Thus, our research is guided by the following research questions and hypotheses:
Hypothesis 1: The importance of talent management is generally on the rise (even during crisis years which tends to produce a talent surplus). Talent management is more important now than before, due to various reasons (demands from the business, demands from employees/applicants).
Hypothesis 2: Talent management is neither managed (clear roles, low infrastructure) nor practiced well in German organizations, as success-critical instruments are less in use compared to other instruments. This is the reason, why talent management is not successful in the eyes of management and employees.
3. Methods
Sample
In the spring of 2009, the department for personnel management at the University of Cologne contacted the personnel departments of the largest 1200 companies in Germany – measured by revenue. Initially, only the objectives of the study were revealed with the request to identify the talent manager or expert. In about 260 cases, a talent manager or expert was identified to whom the online questionnaire with the 52 questions was sent. Of this group, about one half completed the online survey (125), resulting in
a response rate of almost 50%. One third of the participants identified as talent managers, another third as other HR professionals and another third as personnel managers or general managers. The average number of employees of the participating organizations was about 20,000, with all major industries being represented.
The study also assesses the effectiveness of instruments and identifies several success factors of talent management from the perspective of HR professionals.
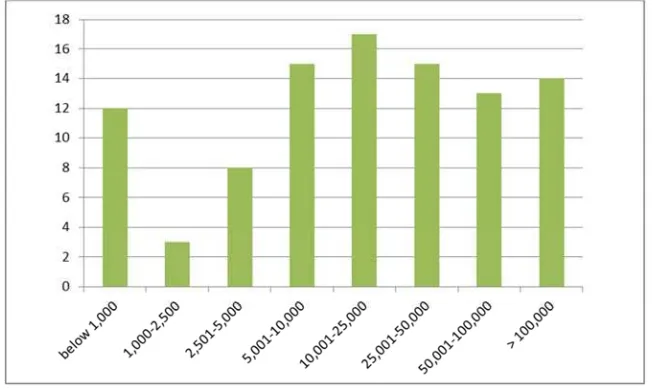
Figure 1 provides an overview of the participating industries; Figure 2 shows a breakdown by company size:
Figure 1. Overview of the participating industries.
Figure 2. Breakdown by company size (number of employees).
The collection of data was carried out between March and May 2009. The participants were asked to take about 30 minutes for answering the questions, which were structured in 5 parts:
Assessment of the importance of talent management (in the organization)
Identification of instruments and processes used Objectives of talent management
Success factors
Socio demographic data of the participating individuals and organizations
4. Design and Procedure
hierarchy of the organization.
In the second part of the questionnaire, participants were asked to identify the instruments in use for different target groups based on a list of 32 instruments grouped into 5 process areas (cf. Table 1b). In addition, participants were asked separately to identify the most effective and ineffective instruments from their perspective. In addition, in this section the participants were also asked to differentiate between their own, top management’s and overall employee’s perspective.
In the third part, the orientation of talent management and reasons for preferences from the perspective of HR were assessed. The questions in this section were chosen to identify success-critical processes and procedures and to collect key metrics (cf. Table 1c). In this section, too, the participants were asked to differentiate between their own, top management’s and overall employee’s perspective.
The fourth part, participant’s views about the effectiveness of instruments, processes and procedures – such as successes of talent management – were assessed.
5. Measures
5.1. Use of Instruments
Participants were asked to state the use of instruments by target group (top and senior management; middle
management; employees without management responsibility).
5.2. Coverage of Processes and Procedures (Target Groups)
Participants were asked on the basis of a 5 item scale (from strongly agree or strongly disagree) to agree or disagree to statements on the use of processes and procedures as well as target groups for talent management.
5.3. Success of Talent Management
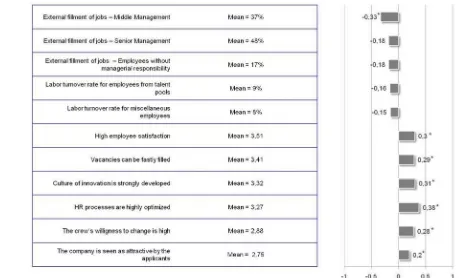
In order to generate a viable and reliable indicator for success, we asked as a first step the talent managers or other respondents of the survey for their assessment of the talent management success (‘How do you assess the success of talent management in your organization?’). In a second step, this subjective assessment of success was analyzed for consistency with other objective (quantitative) success metrics as well as comparisons of practices and procedures in successful versus less successful companies. The success indicator used correlates strongly and significantly n the expected directions: For example, it correlates negatively with external recruitment of candidates and positively with employee satisfaction and employer attractiveness and was thus deemed valid for this purpose. Figure 3 provides an overview over all correlations.
Figure 3. Respondents’ assessment of the success of talent management in their organizations.
6. Results
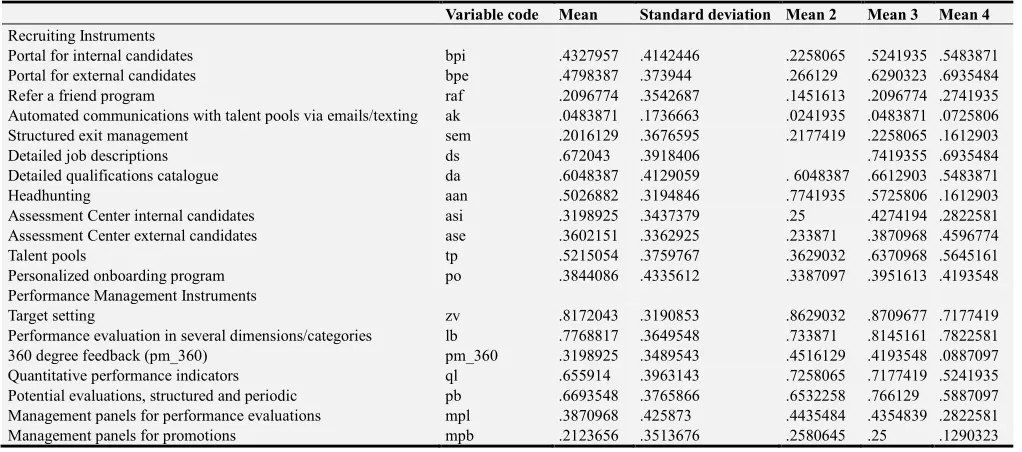
Table 1a. Overview of main indices, variables and items.
Variable code Mean Standard
deviation Range
Cronbach’s alpha
Importance of Talent Management
How do you rank the significance of talent management ranked in your
organization? stew_tm 4.01626 .8296132 1-5 0,63
Has the significance changed during the (current) crisis delt_stew_tm 1.98374 .9494065 1-3
Is there a position/department dealing dealing mainly with talent management? pos_tm .8016529 .400413 1-2
Is there an explicit talent strategy? strat_tm .557377 .4987452 1-2
Do you measure the success of talent management? erfmes_tm .4545455 .5 1-2
Do you use an IT tool? itunt_tm .3801653 .4874457 1-2
Do you use external benchmarking for talent management? exbench_tm .1848739 .3898367 1-2
Target groups
Top management zielg_tm_tm .5645161 .4978316 0-1
Senior management zielg_tm_sm .6854839 .4662065 0-1
Other employees with management responsibility zielg_tm~mfv .8790323 .3274127 0-1
Other employees without management responsibility zielg_tm~ofv .7016129 .4594065 0-1
Roles
Main responsibility with (HR) beteilgesv~o .8145161 .3902664 0-1
Tool design (HR) beteilausa~o .9435484 .231728 0-1
Process execution (HR) beteildurc~o .9193548 .273394 0-1
Process evaluation (HR) beteileval~o .8951613 .3075883 0-1
Commitment
HR Department ant_tm_perso .7790598 .2584135 1-3
Executives ant_tm_fk .5150862 .2705244 1-3
Top Management ant_tm_tm .5884615 .3275026 1-3
Contentedness with talent management instruments in use (leadership)
Recruiting zufuntl_tm_rec 1.522936 .554382 1-3 0,51
Performance management zufuntl_tm_per 1.536364 .5695205 1-3
Compensation management zufuntl_tm_comp 1.657407 .5984722 1-3
Skill and competency management zufuntl_tm_skm 1.719626 .5954924 1-3
Succession management Zufuntl_tm_lnp 1.880734 .662833 1-3
Contentedness with talent management instruments in use (employees)
Recruiting zufmit_tm_rec 1.59633 .5291374 1-3 44%
Performance management zufmit_tm_per 1.836364 .5506839 1-3
Compensation management zufmit_tm_comp 1.962963 .56247 1-3
Skill and competency management zufmit_tm_skm 1.925234 .508437 1-3
Succession management Zufmit_tm_lnp 2.192661 .5177777 1-3
Importance of Talent Management Target Group
Roles of Talent Management Commitment Roles
Contentedness with instruments (leadership and employees)
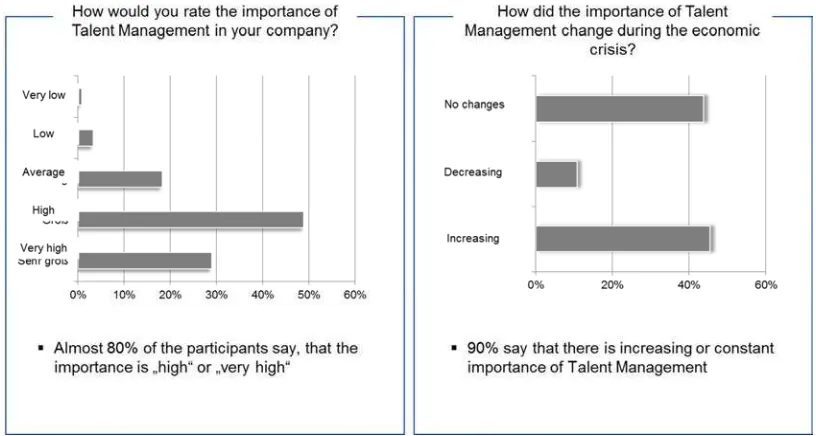
The majority of respondents, (almost 80 percent) describe the importance of talent management in their organizations as "big" or "very big". Asked for any changes as part of the 2009 financial crisis, 90 percent of the interviewees claim a rising or at least constant importance of talent management.
Despite the generally high perceived importance of talent management it surprises that a suitable infrastructure is often relatively weak. It appears that talent management is a topic whose importance is recognized on the abstract level but is (perhaps due to its complexness) hardly addressed on the concrete level. Everybody knows and agrees that it is important to care for talents, but there is an obvious lack of
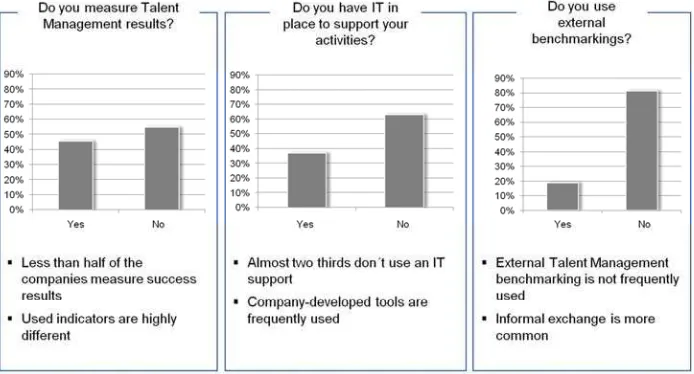
real strategies and knowledge of concrete facts – it appears that HR managers are kind of flying blind in this field. For example, measuring and tracking of results takes place only in half of the participating organizations and there are very few established metrics indicating the success of talent management activities. Also, in almost two thirds of the enterprises surveyed, talent management is carried out without an integrated IT solution facilitating the interaction between managers, HR and employees. In addition, most IT tools used are self-developed and therefore don’t take advantage of external best practice. Not surprisingly, external benchmarking is the exception.
Figure 5. Results measurement, IT support and external benchmarking in talent management.
After all, in 80% of the participating organizations there exists an HR section predominately involved with talent management, whereas only 55% have an explicit talent management strategy.
Study participants were asked which talent management instruments are applied in their organizations and for which different target groups. 90% of the participants indicate that talent management refers to mid-level executives and in 70%
to senior management. In 70% of the participating organizations employees without managerial responsibilities are a target group. However, filtering for organizational size shows that large-scale organizations (with more than 20,000 employees) often restrict their talent management to middle and upper executives; thus talent management is often not a comprehensive process.
As for the distribution of tasks, a very clear picture arises: while HR is evenly involved in all aspects of talent management from concept to evaluation of tasks, executives are expected to take the lead in implementation. Despite this high responsibility, executives’ commitment to perform these tasks is often too low, which appears to be one of the main challenges of successful talent management. Despite the great importance attached to talent management in general, there appears to be a significant lack of awareness and commitment among executives and thus a lack of support for the implementation of talent management activities.
Asked about whether the intended roles are executed with full commitment, the executives clearly score lowest in the opinion of the participants who obviously have identified a lack of responsibility. Only in little more than half of the organizations is this role executed with full conviction as perceived by the participants. This is especially significant in light of the finding that the organizations in which executives do fill their roles with high levels of commitment have a significantly higher likelihood of being a successful organization. This means, the executives themselves represent a highly significant success factor for talent management.
Figure 7. Distribution of talent management tasks, and commitment.
Overall, the organizations which are able to set up successful talent management processes create more value from "human capital" available to them, because they can identify and allocate talents better, must recruit less externally and lose less talents. A lot speaks for the fact that
such investments are exceptionally profitable.
Finally, satisfaction levels with talent management instruments are higher among executives compared to employees indicating that talent management is understood as investment however with limited payoff so far.
Table 1b. Specific talent management instruments.
Variable code Mean Standard deviation Mean 2 Mean 3 Mean 4
Recruiting Instruments
Portal for internal candidates bpi .4327957 .4142446 .2258065 .5241935 .5483871
Portal for external candidates bpe .4798387 .373944 .266129 .6290323 .6935484
Refer a friend program raf .2096774 .3542687 .1451613 .2096774 .2741935
Automated communications with talent pools via emails/texting ak .0483871 .1736663 .0241935 .0483871 .0725806
Structured exit management sem .2016129 .3676595 .2177419 .2258065 .1612903
Detailed job descriptions ds .672043 .3918406 .7419355 .6935484
Detailed qualifications catalogue da .6048387 .4129059 . 6048387 .6612903 .5483871
Headhunting aan .5026882 .3194846 .7741935 .5725806 .1612903
Assessment Center internal candidates asi .3198925 .3437379 .25 .4274194 .2822581
Assessment Center external candidates ase .3602151 .3362925 .233871 .3870968 .4596774
Talent pools tp .5215054 .3759767 .3629032 .6370968 .5645161
Personalized onboarding program po .3844086 .4335612 .3387097 .3951613 .4193548
Performance Management Instruments
Target setting zv .8172043 .3190853 .8629032 .8709677 .7177419
Performance evaluation in several dimensions/categories lb .7768817 .3649548 .733871 .8145161 .7822581
360 degree feedback (pm_360) pm_360 .3198925 .3489543 .4516129 .4193548 .0887097
Quantitative performance indicators ql .655914 .3963143 .7258065 .7177419 .5241935
Potential evaluations, structured and periodic pb .6693548 .3765866 .6532258 .766129 .5887097
Management panels for performance evaluations mpl .3870968 .425873 .4435484 .4354839 .2822581
Variable code Mean Standard deviation Mean 2 Mean 3 Mean 4
Recommended distribution of performance categories evl .2473118 .3984409 .25 .266129 .2258065
Forced distribution fd .0564516 .2113397 .0645161 .0483871 .0564516
Compensation Management Instruments
Variable pay components in general vgka .7741936 .3361625 .8709677 .8225806 .6290323
Variable pay components on the basis of team performance vgkt .3682796 .3960477 .3387097 .3870968 .3790323
Variable pay components on the basis of individual performance vgki .6827957 .3750455 .75 .7580645 .5403226
Optional unpaid vacation sabbatical uu .2553763 .3967093 .1854839 .2741935 .3064516
Variable benefits vzl .2284946 .3690045 .2822581 .2580645 .1451613
Variable pay components on the basis of company performance vgku .6827957 .3701969 .8387097 .7016129 .5080645
Skill and competency Instruments
Personalized development plans pep .6129032 .4085515 .5322581 .7016129 .6048387
Employee portal for training and continuing education mp .5322581 .4576349 .4354839 .5725806 .5887097
Competency model km .6155914 .4121996 .5887097 .6935484 .5645161
Management training, external mt .6424731 .3213943 .8145161 .8064516 .3064516
Succession planning Instruments
Probability assessment for turnover rates ba .2419355 .3539395 .2903226 .2983871 .1370968
Personalized career paths pl .2043011 .3284457 .1854839 .2580645 .1693548
Alternative career paths aak .3037634 .355654 .1612903 .3306452 .4193548
Mid and long-term succession plans mnlp .5430108 .3332459 .7580645 .6612903 .2096774
Domino lists dl .1129032 .2546305 .1532258 .1451613 .0403226
Requirements / potential alignments abp .3145161 .4016732 .3145161 .3870968 .2419355
Mean=All employees
Mean 2=Top and senior management Mean 3=Middle management
Mean 4=Employees without management responsibility
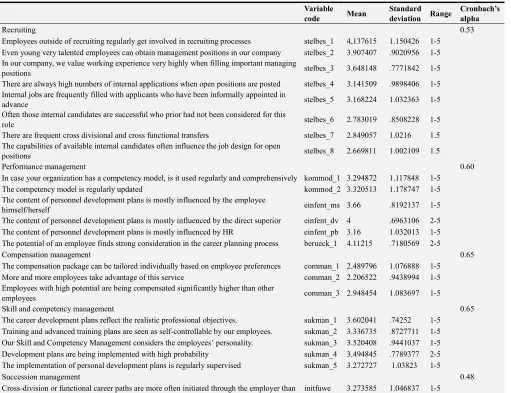
Table 1c. Quality of talent management processes.
Variable
code Mean
Standard
deviation Range
Cronbach’s alpha
Recruiting 0.53
Employees outside of recruiting regularly get involved in recruiting processes stelbes_1 4,137615 1.150426 1-5 Even young very talented employees can obtain management positions in our company stelbes_2 3.907407 .9020956 1-5 In our company, we value working experience very highly when filling important managing
positions stelbes_3 3.648148 .7771842 1-5
There are always high numbers of internal applications when open positions are posted stelbes_4 3.141509 .9898406 1-5 Internal jobs are frequently filled with applicants who have been informally appointed in
advance stelbes_5 3.168224 1.032363 1-5
Often those internal candidates are successful who prior had not been considered for this
role stelbes_6 2.783019 .8508228 1-5
There are frequent cross divisional and cross functional transfers stelbes_7 2.849057 1.0216 1.5
The capabilities of available internal candidates often influence the job design for open
positions stelbes_8 2.669811 1.002109 1.5
Performance management 0.60
In case your organization has a competency model, is it used regularly and comprehensively kommod_1 3.294872 1.117848 1-5
The competency model is regularly updated kommod_2 3.320513 1.178747 1-5
The content of personnel development plans is mostly influenced by the employee
himself/herself einfent_ms 3.66 .8192137 1-5
The content of personnel development plans is mostly influenced by the direct superior einfent_dv 4 .6963106 2-5
The content of personnel development plans is mostly influenced by HR einfent_pb 3.16 1.032013 1-5
The potential of an employee finds strong consideration in the career planning process berueck_1 4.11215 .7180569 2-5
Compensation management 0.65
The compensation package can be tailored individually based on employee preferences comman_1 2.489796 1.076888 1-5
More and more employees take advantage of this service comman_2 2.206522 .9438994 1-5
Employees with high potential are being compensated significantly higher than other
employees comman_3 2.948454 1.083697 1-5
Skill and competency management 0.65
The career development plans reflect the realistic professional objectives. sukman_1 3.602041 .74252 1-5 Training and advanced training plans are seen as self-controllable by our employees. sukman_2 3.336735 .8727711 1-5 Our Skill and Competency Management considers the employees’ personality. sukman_3 3.520408 .9441037 1-5
Development plans are being implemented with high probability sukman_4 3.494845 .7789377 2-5
The implementation of personal development plans is regularly supervised sukman_5 3.272727 1.03823 1-5
Succession management 0.48
Variable
code Mean
Standard
deviation Range
Cronbach’s alpha
individual employees
Global mobility assignments are more often initiated through the employer than individual
employees initausent 2.095745 .951164 1-5
The employees’ personal objectives are strongly considered for their career development. berueck_2 3.682243 .7721342 1-5 The overall personality of an employee finds recognition in their career development berueck_3 4.046729 .7187932 2-5 The individual situation of each employee is considered when designing time and content of
their job berueck_4 3.27619 .7531375 1-5
The company enables personalized career paths based on the employees’ interest and life
objectives nukman_1 3.04902 1.137806 1-5
Maternity leave, sabbaticals and other leave of absent is being considered in career
management nukman_2 3.213592 1.16863 1-5
The use of flexible time-off policy obstructs a structured succession management nukman_3 2.535354 1.081506 1-5
Quality of Talent Management processes and procedures
Table 1b and 1c provide an overview over the use of specific instruments sorted by life cycle, as well as processes and procedures respectively. In order to get a first overview of how widespread specific talent management instruments are used in practice, the participants were asked to mark in a closed list of 36 instruments the ones used in their organization as well as their target population, which shows
large differences in the use of specific instruments across all target groups. As a result, lists of instruments could be distilled which are almost unanimously perceived as effective, others which had been assessed as rather "neutral", other which are rather polarizing and also instruments which have been classified by the majority of participants as more or less ineffective.
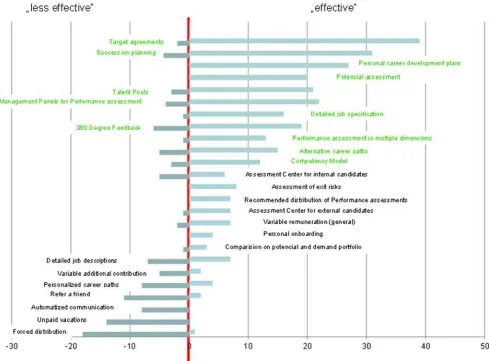
Figure 8. Assessment of instruments by talent managers as less or more effective.
As an example, goal settings, succession planning, personalized development plans and talent pools are assessed almost unanimously as effective due to their
distribution’, a performance management process as carried out at the American group General Electric, has been assessed nearly unanimously negatively by the respondents. Generally, it appears that the most widespread instruments are not necessarily the most effective. In contrast, quite often relatively little use is made of the most effective instruments (i.e. personalized career paths, exit management, automated communication with talent pools).
By separately analyzing the talent portfolio of companies with high subjective success of talent management together with companies in which this is not the case, it was possible to identify both instruments and specific procedures which describe successful companies as opposed to less successful companies. While causalities cannot clearly be determined, this analysis revealed some interesting patterns.
For example, one of the success factors appears to be the use of instruments to systematically measure the employee potential and to identify special talents on the basis of this information. Our analysis shows that successful companies use systematic potential appraisals significantly more often than less successful ones. Besides, it seems important to trust not only the judgment of the direct executive, but to confirm this assessment clear and understandably by others. Often internal assessment centers are used for this. Surprisingly, management panels in which several executives discuss together potential and performance evaluations or promotional decisions are seldom used in the participating companies. However, it appears that companies with
overall successful talent management processes use such performance panels significantly more frequently.
A key issue in the identification of talents in companies is that executives tend not to differentiate enough when assessing potential due to positivity bias and dissonance reduction. In many companies, frequently very different performance levels find application in different functional areas. However, the development of uniform assessment standards is important to be able to compare talents across functional areas. It appears that successful companies use significantly more often recommended performance and potential ratings to support executives applying the same differentiation criteria. However, companies using the stricter ‘forced distribution’ tend to assess their talent management as less successful. Talent managers seem to share the skepticism cited towards the forced distribution systems. In contrast, talent pools are often the central instrument to promote a group of especially gifted employees. They are being used in 72% of the less successful companies, but in 86% of the successful ones.
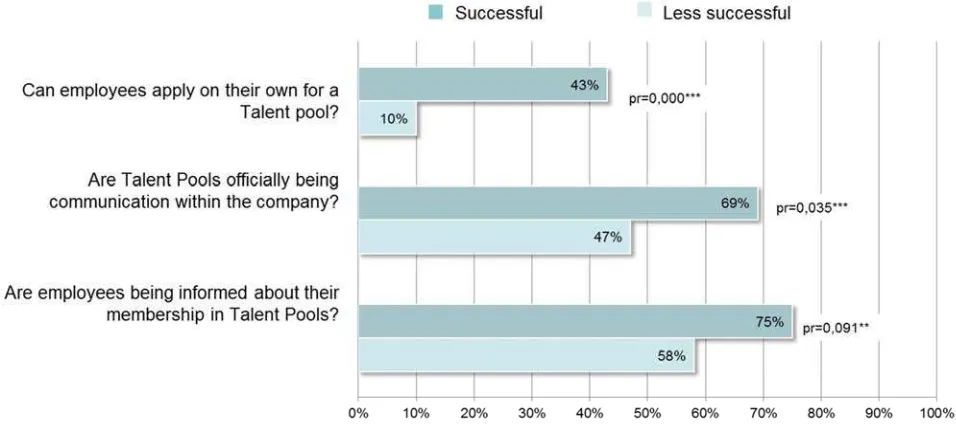
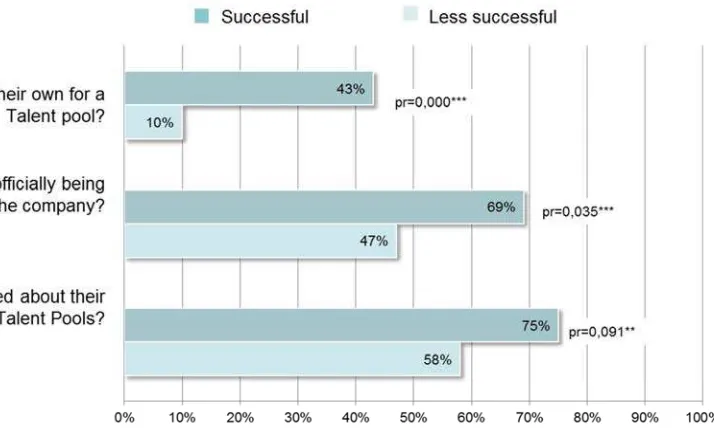
Nevertheless, the study also points out that successful enterprises handle the subject of talent management much more openly and produce more transparency than less successful companies. They communicate the existence of talent pools more openly and inform the employees about their talent pool affiliation. Remarkably, successful enterprises also significantly more often permit a self-application process for employees for admission to talent pools, which is also in line with findings in fairness research: Fairness and openness constitute important motivational factors for employees.
Figure 9. Openness and transparency about talent pools.
In addition, the analysis of effectiveness of a balanced set of talent processes underlines the importance of a functioning clear internal job market also from an employee's view. This is found, for example, based on the significantly higher approval rate in successful companies
Figure 10. Internal recruiting.
Success factor ‘Alternative career paths’
In the area of career and succession planning, the traditional nuclear area of talent management, the most effective instruments are not necessarily the widespread ones. While offers of alternative career paths (for example, an expert's career) as well as personalized career paths likewise
seem to be signs for successful talent management (pr=0.000, pr=0.002), these offers still are rather the exception. The chart below summarizes the significance levels of specific instruments linked to career and succession planning in indicating successful vs. less successful companies:
Figure 11. Talent pools.
Success factor ‘Management of separations’
Surprisingly, in times of a financial crisis, during which many companies need to adjust staff levels, the importance of good separation management seems to be underestimated by
Figure 12. Distribution of recruiting tools in target groups.
Success factor ‘Incentive management’
The structured measurement of performance and in particular the variable reimbursement of team achievements also appears success-critical for talent management. In this regard, the study points in particular to the importance of team bonus payments, which are used by more successful enterprises significantly more often than in the comparative group. Team bonus systems can generate a positive influence on the solidarity, the willingness to co-operate and the identification with the success of the organization. In such a climate talent management can better function, because, for example, the acceptance of performance differentiation rises if the organization as a whole benefits.
In order to test the hypothesis about success factors of talent management, separate hierarchical regression analyses were carried out for each talent management area sorted by life cycle. Tables 3 and 4 show the results for talent management instruments and processes respectively. Table 3 confirms the negative effect of forced distribution, as well as the positive effect of variable pay, personalized career paths and the probability assessment of turnover intention. Table 4 clearly confirms the expected direction and significance levels for openness and transparency of the recruiting processes, inclusion of potential, as well as self-control.
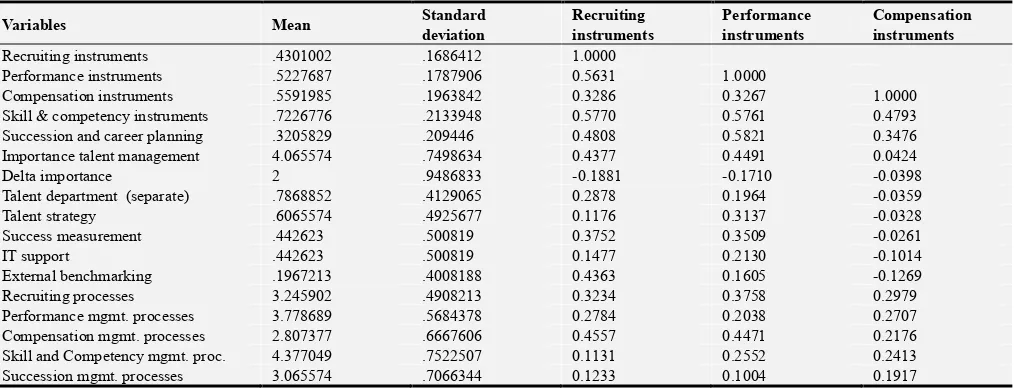
Table 2 shows the correlations among the groups of talent management instruments and processes sorted by life cycle.
Table 2. Means, standard deviations and correlations for all variables.
Variables Mean Standard
deviation
Recruiting instruments
Performance instruments
Compensation instruments
Recruiting instruments .4301002 .1686412 1.0000
Performance instruments .5227687 .1787906 0.5631 1.0000
Compensation instruments .5591985 .1963842 0.3286 0.3267 1.0000
Skill & competency instruments .7226776 .2133948 0.5770 0.5761 0.4793
Succession and career planning .3205829 .209446 0.4808 0.5821 0.3476
Importance talent management 4.065574 .7498634 0.4377 0.4491 0.0424
Delta importance 2 .9486833 -0.1881 -0.1710 -0.0398
Talent department (separate) .7868852 .4129065 0.2878 0.1964 -0.0359
Talent strategy .6065574 .4925677 0.1176 0.3137 -0.0328
Success measurement .442623 .500819 0.3752 0.3509 -0.0261
IT support .442623 .500819 0.1477 0.2130 -0.1014
External benchmarking .1967213 .4008188 0.4363 0.1605 -0.1269
Recruiting processes 3.245902 .4908213 0.3234 0.3758 0.2979
Performance mgmt. processes 3.778689 .5684378 0.2784 0.2038 0.2707
Compensation mgmt. processes 2.807377 .6667606 0.4557 0.4471 0.2176
Skill and Competency mgmt. proc. 4.377049 .7522507 0.1131 0.2552 0.2413
Table 2. Continued.
Variables Skill and Competency
instruments
Succession and career planning
Importance talent management
Delta importance
Talent department (separate)
Recruiting instruments Performance instruments Compensation instruments
Skill & competency instruments 1.0000
Succession and career planning 0.5307 1.0000
Importance talent management 0.2284 0.2589 1.0000
Delta importance -0.1990 -0.2423 -0.1171 1.0000
Talent department (separate) 0.2481 0.1287 0.4227 -0.2127 1.0000
Talent strategy 0.1471 0.2108 0.3418 -0.0713 0.4003
Success measurement 0.1670 0.4254 0.3652 -0.1052 0.3026
IT support 0.1930 0.0194 0.3208 0.2105 0.2220
External benchmarking 0.2750 0.4054 0.1782 -0.1315 0.2575
Recruiting processes 0.3304 0.4518 0.2660 -0.1534 0.0397
Performance mgmt. processes 0.3358 0.3492 0.2888 -0.1854 0.0620
Compensation mgmt. processes 0.5017 0.4031 0.2840 -0.2635 0.1965
Skill and Competency mgmt. proc. 0.3205 0.3234 0.3248 -0.3036 0.1289
Succession mgmt. processes 0.2239 0.1913 0.0442 -0.0994 0.0677
Table 2. Continued.
Variables Talent strategy Success
measurement IT support
External benchmarking
Recruiting processes
Recruiting instruments Performance instruments Compensation instruments Skill & competency instruments Succession and career planning Importance talent management Delta importance
Talent department (separate)
Talent strategy 1.0000
Success measurement 0.2448 1.0000
IT support 0.2448 0.2026 1.0000
External benchmarking 0.2297 0.2232 0.2232 1.0000
Recruiting processes 0.2788 0.2472 -0.0821 0.1010 1.0000
Performance mgmt. processes 0.1005 0.1742 0.1596 0.2308 0.3114
Compensation mgmt. processes 0.1333 0.2970 0.1473 0.2221 0.2581
Skill and Competency mgmt. proc. 0.0022 0.0805 0.1026 -0.0014 0.2928
Succession mgmt. processes 0.0594 0.0736 -0.1462 0.0910 0.4562
Table 2. Continued.
Variables Performance mgmt.
processes
Compensation processes
Skill and competency mgmt. processes
Succession mgmt. processes zation
Recruiting instruments Performance instruments Compensation instruments Skill & competency instruments Succession and career planning Importance talent management Delta importance
Talent department (separate) Talent strategy
Success measurement IT support
External benchmarking Recruiting processes
Performance mgmt. processes 1.0000
Compensation mgmt. processes 0.4518 1.0000
Skill and Competency mgmt. proc. 0.6052 0.5356 1.0000
Table 3. Results of regression analysis: Specific talent management instruments (dependent variable: success of talent management).
Variable code Model 1a Model 1b
Beta P Beta p
Talent Infrastructure Index3481012 1.35284 0.000*** 1.420249 0.000***
Size Dummy 1 Groesse1 -.2224479 0.328 -.0333204 0.894
Size Dummy 2 Groesse2 .0265365 0.910 -.011669 0.962
Size Dummy 3 Groesse3 .3768717 0.234 .5978306 0.064*
Size Dummy 4 Groesse3 -.144085 0.648 -.1423524 0.661
Industry Dummy 1 BrancheECP .4689061 0.353 .4957256 0.316
Industry Dummy 1 BrancheMFM .4507686 0.379 .5179958 0.307
Industry Dummy 2 Branche ESP .6841903 0.204 .7514022 0.159
Industry Dummy 3 BrancheDL .6684645 0.179 .6719543 0.172
Detailed job descriptions ds -.123951 0.628 -.0842929 0.764
Detailed qualifications catalogue da .1804446 0.456 .1840955 0.470
Portal for internal candidates bpi .1761951 0.506 .668813 0.807
Portal for external candidates bpe -.5182974 0.079* -.5257731 0.076*
Headhunting aan -.4237579 0.159 -.5216906 0.091*
Refer a friend program raf -.0136689 0.955 -.1181005 0.659
Assessment Center internal candidates asi .3663592 0.203 .4097124 0.150
Assessment Center external candidates ase -.2586388 0.386 -.4017831 0.198
Personalized onboarding program po .1907678 0.355 .3294601 0.128
Talent pools tp -.2362821 0.430 -.3760893 0.224
Automated communications with talent pools via emails/texting ak .5617921 0.234 .3082604 0.540
Structured exit management sem .3312138 0.175 .3452505 0.216
Target setting zv 1.236023 0.008***
Quantitative performance indicators ql .1058041 0.682
Performance evaluation in several dimensions/categories lb -.4134865 0.178
Potential evaluations, structured and periodic pb -.0001398 1.000
Management panels for performance evaluations mpl -.1096695 0.651
Management panels for promotions mpb .0312002 0.911
Recommended distribution of performance categories evl .3917538 0.113
Forced distribution fd -.7594503 0.083*
360 degree feedback pm_360 .1396283 0.636
Variable pay components in general vgka
Variable pay components on the basis of individual performance vgki
Variable pay components on the basis of team performance vgkt
Variable pay components on the basis of company performance vgku
Variable benefits vzl
Optional unpaid vacation sabbatical uu
Competency model km
Personalized development plans pep
Employee portal for training and continuing education mp
Management training, external mt
Mid and long-term succession plans mlnp
Domino lists dl
Probability assessment for turnover rates ba
Personalized career paths pl
Alternative career paths aak
Table 3. Continue.
Model 1c Model 1d Model 1e
Beta P Beta P Beta P
Talent Infrastructure 1.364057 0.001*** 1.425939 0.001*** 1.112232 0.009***
Size Dummy 1 .0378418 0.891 -.0046086 0.987 -.0377296 0.893
Size Dummy 2 .0015224 0.995 .004458 0.987 -.0272967 0.922
Size Dummy 3 .6801725 0.061* .6552141 0.082 .671713 0.061
Size Dummy 4 -.0145503 0.967 -.1019273 0.801 .2794939 0.493
Industry Dummy 1 .3303174 0.535 .2887545 0.602 .5238046 0.334
Industry Dummy 1 .3880313 0.484 .3754632 0.511 .5413961 0.337
Industry Dummy 2 .5672545 0.315 .4983534 0.398 .5791386 0.335
Industry Dummy 3 .461597 0.388 .4102836 0.458 .7176466 0.186
Detailed job descriptions -.1847765 0.534 -.2371361 0.443 -.1022027 0.737
Detailed qualifications catalogue .2157462 0.411 .2551201 0.348 .150074 0.567
Portal for internal candidates -.0385718 0.898 -.0372869 0.905 -.2749831 0.379
Portal for external candidates -.3885838 0.231 -.4274173 0.215 -.2716825 0.427
Headhunting -.3249872 0.353 -.3281831 0.373 -.434616 0.222
Refer a friend program -.1388939 0.625 -.1792015 0.541 -.0326061 0.908
Assessment Center internal candidates .3611018 0.233 .2799895 0.387 .2622951 0.403
Assessment Center external candidates -.4801453 0.160 -.5112813 0.166 -.8121311 0.029**
Personalized onboarding program .2443975 0.297 .1973509 0.451 .1715061 0.494
Talent pools -.4000778 0.222 -.3835881 0.307 -.3449411 0.335
Automated communications with talent pools via emails/texting .47738 0.400 .507496 0.394 .8572348 0.152
Structured exit management .3287432 0.282 .3561229 0.278 -.030902 0.925
Target setting 1.2913 0.026** .925794 0.225 1.372303 0.066
Quantitative performance indicators .2346549 0.397 .2869787 0.328 .3014728 0.288
Performance evaluation in several dimensions/categories -.4916659 0.143 -.5399499 0.129 -.8138742 0.023**
Potential evaluations, structured and periodic .1474921 0.690 .1815392 0.634 .210243 0.579
Management panels for performance evaluations -.1058116 0.681 -.154874 0.576 -.263566 0.333
Management panels for promotions .0601883 0.839 .0191834 0.951 .0791771 0.797
Recommended distribution of performance categories .4701114 0.098* .4939455 0.096 .5071549 0.075*
Forced distribution -.8254613 0.073* -.8692931 0.067* -.8335877 0.066
360 degree feedback .0979783 0.754 .0686231 0.836 .1991845 0.537
Variable pay components in general .3252295 0.550 .5601821 0.365 -.0396858 0.950
Variable pay components on the basis of individual performance -.4231089 0.249 -.4959891 0.199 -.3379457 0.393
Variable pay components on the basis of team performance .4344887 0.101 .4407149 0.110 .4617061 0.083*
Variable pay components on the basis of company performance -.360432 0.351 -.4518015 0.275 -.3861785 0.354
Variable benefits -.0857042 0.739 -.1642547 0.549 -.3513894 0.195
Optional unpaid vacation sabbatical -.0224516 0.937 -.019009 0.950 -.1019584 0.731
Competency model -.1275149 0.660 -.2456204 0.373
Personalized development plans .2064299 0.495 -.0203655 0.945
Employee portal for training and continuing education .1368972 0.537 .0371273 0.867
Management training, external .2983478 0.545 .0618844 0.898
Mid and long-term succession plans .217107 0.540
Domino lists .2200618 0.532
Probability assessment for turnover rates .4587327 0.086
Personalized career paths .599207 0.071*
Alternative career paths .4593924 0.138
Requirements / potential alignments .1634299 0.532
Model 1a=Recruiting Instruments
Model 1b=Recruiting, Performance Management Instruments
Model 1c=Recruiting, Performance Management, Compensation Instruments
Model 1d=Recruiting, Performance Management, Compensation, Skill and Competency Management Instruments
Table 4. Results of regression analysis: Talent management processes (dependent variable: success of talent management).
Variable code Model 4a
Beta P
Talent Infrastructure Index3481012 .8857811 0.001***
Size Dummy 1 Groesse1 -.2608415 0.166
Size Dummy 2 Groesse2 .1003501 0.613
Size Dummy 3 Groesse3 .543855 0.053*
Size Dummy 4 Groesse4 .0375399 0.885
Industry Dummy 1 BrancheECP -.5670589 0.276
Industry Dummy 1 BrancheMFM -.3041089 0.567
Industry Dummy 2 BrancheESP -.4289761 0.436
Industry Dummy 3 BrancheDL -.253393 0.622
Recruiting
Employees outside of recruiting regularly get involved in recruiting processes stelbes_1 .042232 0.501
Even young very talented employees can obtain management positions in our company stelbes_2 .1320555 0.110
In our company, we value working experience very highly when filling important managing positions stelbes_3 .1546857 0.097*
There are always high numbers of internal applications when open positions are posted stelbes_4 .0589841 0.499
Internal jobs are frequently filled with applicants who have been informally appointed in advance stelbes_5 -.1575584 0.037**
Often those internal candidates are successful who prior had not been considered for this role stelbes_6 .0739434 0.440
There are frequent cross divisional and cross functional transfers stelbes_7 .1921245 0.016**
The capabilities of available internal candidates often influence the job design for open positions stelbes_8 .1880938 0.016**
Performance management
In case your organization has a competency model, is it used regularly and comprehensively kommod_1
The competency model is regulary updated kommod_2
The content of personnel development plans is mostly influenced by the employee himself/herself einfent_ms
The content of personnel development plans is mostly influenced by the direct superior einfent_dv
The content of personnel development plans is mostly influenced by HR einfent_pb
The potential of an employee finds strong consideration in the career planning process berueck_1
Compensation management
The compensation package can be tailored individually based on employee preferences comman_1
More and more employees take advantage of this service comman_2
Employees with high potential are being compensated significantly higher than other employees comman_3
Skill and competency management
The career development plans reflect the realistic professional objectives. sukman_1
Training and advanced training plans are seen as self-controllable by our employees. sukman_2
Our Skill and Competency Management considers the employees’ personality. sukman_3
Development plans are being implemented with high probability sukman_4
The implementation of personal development plans is regularly supervised sukman_5
Succession management
Cross-division or functional career paths are more often initiated through the employer than individual
employees initfuwe
Global mobility assignments are more often initiated through the employer than individual employees initausent
The employees’ personal objectives are strongly considered for their career development. berueck_2
The overall personality of an employee finds recognition in their career development berueck_3
The individual situation of each employee is considered when designing time and content of their job berueck_4
The company enables personalized career paths based on the employees’ interest and life objectives nukman_1
Maternity leave, sabbaticals and other leave of absent is being considered in career management nukman_2
Table 4. Continued.
Model 4b Model 4c
Beta p Beta P
Talent Infrastructure .9027067 0.002*** .9062525 0.004***
Size Dummy 1 -.1092416 0.620 -.2600979 0.339
Size Dummy 2 -.4535582 0.035** -.4952078 0.046
Size Dummy 3 .2759887 0.453 -.3342114 0.547
Size Dummy 4 -.2384558 0.354 -.188159 0.501
Industry Dummy 1 -.4266642 0.369 -.2550171 0.626
Industry Dummy 1 -.0349108 0.941 .1492993 0.770
Industry Dummy 2 -.4114813 0.432 -.1074388 0.862
Industry Dummy 3 -.1042405 0.828 .0110698 0.983
Recruiting
Employees outside of recruiting regularly get involved in recruiting processes .0213284 0.744 -.0211687 0.790
Even young very talented employees can obtain management positions in our company -.0344788 0.715 -.0263753 0.805 In our company, we value working experience very highly when filling important managing
positions .0558536 0.585 .0766429 0.548
There are always high numbers of internal applications when open positions are posted .0423707 0.685 .0678299 0.592 Internal jobs are frequently filled with applicants who have been informally appointed in
advance -.1283875 0.074* -.0725441 0.381
Often those internal candidates are successful who prior had not been considered for this role .0284435 0.773 .1458616 0.239
There are frequent cross divisional and cross functional transfers .0605978 0.499 .0269297 0.802
The capabilities of available internal candidates often influence the job design for open positions .1886698 0.027* .1624356 0.097*
Performance management
In case your organization has a competency model, is it used regularly and comprehensively .0086568 0.922 -.1268 0.276
The competency model is regulary updated .0700618 0.391 .0771163 0.462
The content of personnel development plans is mostly influenced by the employee
himself/herself -.1249292 0.234 -.0188415 0.877
The content of personnel development plans is mostly influenced by the direct superior -.1074201 0.388 -.2528966 0.116
The content of personnel development plans is mostly influenced by HR .0936694 0.363 .1309224 0.270
The potential of an employee finds strong consideration in the career planning process .3913051 0.006*** .477645 0.003***
Compensation management
The compensation package can be tailored individually based on employee preferences -.1796482 0.181
More and more employees take advantage of this service .2070879 0.070*
Employees with high potential are being compensated significantly higher than other employees .0482976 0.630
Skill and competency management
The career development plans reflect the realistic professional objectives.
Training and advanced training plans are seen as self-controllable by our employees.
Our Skill and Competency Management considers the employees’ personality.
Development plans are being implemented with high probability
The implementation of personal development plans is regularly supervised
Succession management
Cross-division or functional career paths are more often initiated through the employer than individual employees
Global mobility assignments are more often initiated through the employer than individual employees
The employees’ personal objectives are strongly considered for their career development.
The overall personality of an employee finds recognition in their career development The individual situation of each employee is considered when designing time and content of their job
The company enables personalized career paths based on the employees’ interest and life objectives
Maternity leave, sabbaticals and other leave of absent is being considered in career management
Table 4. Continued.
Model 4d Model 4e
Beta P Beta P
Talent Infrastructure 1.018326 0.002*** .7598152 0.087*
Size Dummy 1 -.2818806 0.296 -.3133407 0.461
Size Dummy 2 -.4363605 0.084 -.3402887 0.534
Size Dummy 3 -.2932539 0.614 -.1940033 0.790
Size Dummy 4 -.248198 0.427 .0678368 0.877
Industry Dummy 1 .1156808 0.841 .2017389 0.780
Industry Dummy 1 .5078372 0.370 .1857962 0.778
Industry Dummy 2 -.0009511 0.999 .0351826 0.969
Industry Dummy 3 .3155639 0.586 .1261902 0.853
Recruiting
Employees outside of recruiting regularly get involved in recruiting processes -.12622 0.174 -.0735535 0.649
Even young very talented employees can obtain management positions in our company -.0810929 0.441 -.0498201 0.712 In our company, we value working experience very highly when filling important managing
positions .0732782 0.584 -.0154252 0.939
There are always high numbers of internal applications when open positions are posted .0232421 0.860 -.0477897 0.811 Internal jobs are frequently filled with applicants who have been informally appointed in
advance -.0529715 0.526 .0520191 0.687
Often those internal candidates are successful who prior had not been considered for this role .2333906 0.087 .1992869 0.392
There are frequent cross divisional and cross functional transfers .0684533 0.517 .2939046 0.127
The capabilities of available internal candidates often influence the job design for open positions .1132433 0.276 -.1108996 0.491 Performance management
In case your organization has a competency model, is it used regularly and comprehensively -.0639458 0.580 .1062855 0.546
The competency model is regulary updated -.0428333 0.739 -.1714262 0.376
The content of personnel development plans is mostly influenced by the employee
himself/herself -.0558809 0.686 .1033929 0.643
The content of personnel development plans is mostly influenced by the direct superior -.0842115 0.610 .145805 0.585
The content of personnel development plans is mostly influenced by HR .1579854 0.224 .0110431 0.954
The potential of an employee finds strong consideration in the career planning process .3409076 0.054* .2952716 0.237 Compensation management
The compensation package can be tailored individually based on employee preferences -.0576357 0.686 .0132091 0.943
More and more employees take advantage of this service .1048259 0.400 .0667341 0.712
Employees with high potential are being compensated significantly higher than other employees -.0269372 0.796 .0486277 0.749 Skill and competency management
The career development plans reflect the realistic professional objectives. -.0984333 0.505 -.2056505 0.360
Training and advanced training plans are seen as self-controllable by our employees. .2383684 0.057* .2314655 0.202
Our Skill and Competency Management considers the employees’ personality. -.0304722 0.757 .0419856 0.803
Development plans are being implemented with high probability .1836311 0.206 .2137193 0.273
The implementation of personal development plans is regularly supervised .0258398 0.833 .1203227 0.592
Succession management
Cross-division or functional career paths are more often initiated through the employer than
individual employees .0141818 0.898
Global mobility assignments are more often initiated through the employer than individual
employees -.108562 0.465
The employees’ personal objectives are strongly considered for their career development. .0278395 0.910
The overall personality of an employee finds recognition in their career development -.0267703 0.886
The individual situation of each employee is considered when designing time and content of
their job -.2473398 0.268
The company enables personalized career paths based on the employees’ interest and life
objectives .131001 0.398
Maternity leave, sabbaticals and other leave of absent is being considered in career management -.0106393 0.939
The use of flexible time-off policy obstructs a structured succession management .0020805 0.988
Model 1a=Recruiting processes
Model 1b=Recruiting, Performance Management processes
Model 1c=Recruiting, Performance Management, Compensation processes
Model 1d=Recruiting, Performance Management, Compensation, Skill and Competency Management processes
Model 1e=Recruiting, Performance Management, Compensation, Skill and Competency Management, Succession Management processes Legend: P<0,001:***; p<0,05:**; p<0,1:*
7. Discussion
The key finding of this study is that talent management is given high business relevance by talent managers and HR professionals in Germany despite the crisis of 2009. A the
management as high or very high, and talent management practice in German organizations is deemed more important than before (and increasing). This is not surprising, given that talent management is rated as one of the pivotal levers for organizations to generate competitive advantages. The study therefore points to an important paradox of talent management: While best practice of talent management is often known, many organizations still rely on traditional instruments which appear to provide less benefit.
As a result, despite the deemed high importance, the talent infrastructure is often weak and - as a result of low levels of success measurement - often the wrong instruments and procedures are being applied. These findings are relevant given the low performance of talent management in many organizations in Germany and the apparent insecurity of talent managers to implement required measures (Moser & Saxer, 2008). The findings also confirm previous findings that there is not enough evidence based research on talent management available, and that clear success factors of talent management are not reliably identified and understood (Tarique & Schuler, 2010). success factors. At the same time, in practice many leaders take this task not seriously enough to be successful and often also don’t have sufficient knowledge about people behavior.
This study builds on existing theories of talent management and supports the criticism of McKinsey style, selection oriented talent process in favor of development oriented talent management instruments and procedures (Collings & Mellahi, 2009).
Besides providing evidence for the lack of good talent management in German organizations, the study implies cultural reasons for the preference of traditional talent management in Germany.
Talent management still not well understood
Whereas drivers of the high interest in talent management are increased challenges facing companies in attraction, retention, allocation, and motivation of key personnel, the ineffectiveness and discontent can be explained at least partially with the widespread confusion about talent management both in practice and in research (Lewis & Heckman, 2006; Collings & Mellahi, 2009). Many companies still appear to be unclear about the effects and clear benefits of talent management. There is often a lack of available data to identify and measure relevant developments including effects of the demographic change with an expected scarcity of talents in the short and midterm, the very different economic context in which companies make their mid and long-term personnel demand forecasting, as well as what really differentiates (if any) generation X and Y entering the workforce. It is also
surprising that despite the current internal and external pressures there is still a widespread lack of clear objectives and strategic orientation despite the large pressure to produce qualified talent management output and results.
Lewis and Heckman (Lewis & Heckman, 2006) were among the first to lament the lack of clarity in defining talent management, and many organizations today still appear to be unclear about the benefits and effects of talent management. They largely follow the workforce segmentation approach to talent management, which is based on identifying current and future A-players in the organizations and trying to attract, retain and develop them. This view was initially claimed by McKinsey consultants who were directly benefiting from consulting projects offering talent management solutions. Their line of thought links the rise of talent management mostly to demands from the business for the need of qualified labor as well as increased HR efficiency (Ulrich, 2002). As a result, the main driver for the increased interest in talent management is its expected business value. According to this line of thought, HR professionals should therefore be guided by serving business objectives and less by the younger generation’s personal growth and career aspirations. This ‘efficiency hypothesis’ also links the early HR transformation argument (Ulrich, 2002) that was synthesized by Jäger (2009) and the hybrid personnel strategy argument. Jäger (2008) argues that modern HR management is driven by increasing efficiencies (driven by Ulrich’s three tiered model of HR service centers, Centers of Excellence and Business Partners) combined with the development of an HR value proposition from a business perspective. Collings & Mellahi (2009) emphasize the strategic element in talent management and linking it to strategic decision making. Furthermore, the authors make a comprehensive effort to further define talent management and propose a model for measuring the effects of talent management. Against this background, the development of talent management instruments and processes has largely been guided by expectations for increased efficiencies, i.e. in post merger integrations, restructurings, or organization’s growth strategies.
Driven by these demands from the business, HR tends to neglect the ‘development argument’, i.e. the perspective of the employee who is increasingly interested in opportunities for personal development. Many younger employees entering the workforce demand more transparent and development-oriented tools and processes which are currently largely not applied due to the excessive business orientation of HR. Our findings therefore confirm largely the arguments of the ‘critical’ talent management research, who criticize the focus on A-players in talent management (Tarique & Schuler, 2010; McDonnell et al 2010). However, there are very few to no studies discussing the effectiveness of specific talent instruments and processes from a people perspective.
High importance but weak infrastructure