LAMPIRAN A
PERHITUNGAN STATISTIK KURVA BAKU
Data Kurva Baku Propranolol HCl dalam Larutan Dapar Fosfat Isotonis pH 7,4 Pengujian I
Konsentrasi (ppm)
Absorbansi X2 Y2 XY
5,03 0,113 25,3009 0,0128 0,5684
15,09 0,279 227,7081 0,0778 4,2101
25,15 0,492 632,5225 0,2421 12,3738
35,21 0,690 1239,7441 0,4761 24,2949
45,27 0,861 2049,3729 0,7413 38,9774
= 4174,6485
= 1,5501
= 80,4246
Data Kurva Baku Propranolol HCl dalam Larutan Dapar Fosfat Isotonis pH 7,4 Pengujian II
Konsentrasi (ppm)
Absorbansi X2 Y2 XY
5,01 0,097 25,1001 0,0094 0,4860
15,03 0,263 225,9009 0,0692 3,9529
25,05 0,466 627,5025 0,2172 11,6733
35,07 0,682 1229,9049 0,4651 23,9177
45,09 0,855 2033,1081 0,7310 38,5519
= 4141,5165
= 1,5095
Data Kurva Baku Propranolol HCl dalam Larutan Dapar Fosfat Isotonis pH 7,4 Pengujian III
Konsentrasi (ppm)
Absorbansi X2 Y2 XY
5,02 0,115 25,2004 0,0132 0,5773
15,06 0,282 226,8036 0,0795 4,2469
25,10 0,497 630,0100 0,2470 12,4747
35,14 0,691 1234,8196 0,4775 24,2817
45,18 0,870 2041,2324 0,7569 39,3066
= 4158,0660
= 1,5741
= 80,8872
X2 XY Y2 N Ssi RDF
I 4174,6485 80,4246 1,5501 5 0,0007 4 II 4141,5165 79,0426 1,5095 5 0,0009 4 III 4158,0660 80,8872 1,5741 5 0,0006 4
12474,2310 240,3544 4,6337 0,0022 SSc = ∑ Yc – [( ∑ Xyc)2 / ∑ Xc ]
= 4,6337 – [ (240,3544)2 / 12474,2310 ] = 0,0025
SSp = SS1 + SS2 + SS3
= 0,0007 + 0,0009 + 0,0006 = 0,0022
Fhitung = ( SSc SSp / k 1 ) / ( SSp / 12)
LAMPIRAN B
PERHITUNGAN MOISTURE CONTENT (MC)
Formula a
W (gram) Wp (gram) Wa (gram) MC (%)
0,1933 0,1632 0,0301 16,04
0,2140 0,1790 0,0350 16,36
0,2222 0,1856 0,0366 16,49
Formula a
W (gram) Wp (gram) Wa (gram) MC (%)
0,2631 0,1821 0,0810 30,7868
0,2771 0,1936 0,0835 30,1268
0,2804 0,1952 0,0852 30,3665
Formula b
W (gram) Wp (gram) Wa (gram) MC (%)
0,2006 0,1660 0,0346 17,2265
0,1806 0,1481 0,0325 17,9827
0,1944 0,1613 0,0331 17,0079
Formula ab
W (gram) Wp (gram) Wa (gram) MC (%)
0,3511 0,2358 0,1153 32,8275
0,3436 0,2329 0,1107 32,2149
0,3381 0,2286 0,1095 32,3683
Keterangan : W = berat mula-mula Wp = berat kering
Wa = selisih antara W dan Wp
LAMPIRAN C Anova:
Single Factor SUMMARY
Groups Count Sum Average Variane Column 1 3 48,89 16,2966 0,05363 Column 2 3 91,280 30,4267 0,11161 Column 3 3 52,217 17,4057 0,26164 Column 4 3 97,410 32,4702 0,10161 ANOVA
Source of
Variation SS df MS F
P-value F crit Between
Groups 647,35 3 215,783 1633,15
1,74E-11
4,066 1 Within
Groups 1,0570 8 0,13212 Total
648,40
LAMPIRAN D
HASIL AKURASI DAN PRESISI PENETAPAN KADAR PROPRANOLOL HCL DALAM LARUTAN DAPAR FOSFAT
ISOTONIS PH 7,4 DALAM FORMULA BLANGKO AB Repli
kasi % Abs FP C(ppm)
C (teoritis)
% perolehan
kembali
1 80 0,259 5 64,8428 64,768 100,11
100 0,320 5 80,8000 80,960 99,80
120 0,382 5 97,0188 97,152 99,86
2 80 0,256 5 65,1044 65,024 100,12
100 0,322 5 81,3232 81,280 100,05
120 0,384 5 97,4128 97,536 99,87
3 80 0,257 5 64,3196 64,256 100,09
100 0,318 5 80,2768 80,320 99,95
120 0,380 5 96,4957 96,384 100,16
Contoh perhitungan :
Dari hasil serapan dimasukan ke dalam persamaan kurva baku terpilih yaitu y = 0,0191x + 0,0113
Dimana: y = Serapan dan x = Konsetrasi teramati Kemudian Hitung % perolehan kembali dengan rumus :
Misal : data replikasi 1 y = 0,0191x + 0,0113 0,259 = 0,0191x + 0,0113 x = 64,8428.
LAMPIRAN E
HASIL PENETAPAN KADAR PATCH PROPRANOLOL HCL
Formula Uji Abs FP C
(ppm)
C (mg/cm2)
%
kadar X ± SD -1 1 0,322 5 81,290 4,065 99,62
2 0,319 5 80,506 4,025 98,66 4,029 ± 0,033 3 0,317 5 79,983 3,999 98,02
a 1 0,295 5 74,227 3,711 90,97
2 0,301 5 75,797 3,789 92,89 3,755 ± 0,039 3 0,299 5 75,274 3,764 92,24
b 1 0,324 5 81,814 4,091 100,26
2 0,320 5 80,767 4,038 98,98 4,082 ± 0,040 3 0,326 5 82,337 4,117 100,90
ab 1 0,309 5 77,889 3,894 95,45
UJI ANOVA PENETAPAN KADAR PROPRANOL HCl Anova: Single Factor
SUMMARY
Groups Count Sum Average Variance Column 1 3 12,08 4,02966 0,00110 Column 2 3 11,26 3,75466 0,00158
Column 3 3 12,24 4,082 0,00162
Column 4 3 11,78 3,929 0,00162
ANOVA Source of
Variation SS df MS F
P-value F crit Between
Groups 0,18708 3 0,06236 42,0390
3,04E-05 4,06618 Within
Groups 0,01186 8 0,00148
LAMPIRAN F
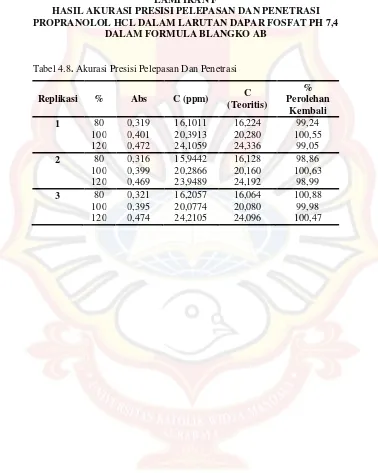
HASIL AKURASI PRESISI PELEPASAN DAN PENETRASI PROPRANOLOL HCL DALAM LARUTAN DAPAR FOSFAT PH 7,4
DALAM FORMULA BLANGKO AB
Tabel 4.8. Akurasi Presisi Pelepasan Dan Penetrasi
Replikasi % Abs C (ppm) C
(Teoritis)
% Perolehan
Kembali
1 80 0,319 16,1011 16,224 99,24
100 0,401 20,3913 20,280 100,55
120 0,472 24,1059 24,336 99,05
2 80 0,316 15,9442 16,128 98,86
100 0,399 20,2866 20,160 100,63
120 0,469 23,9489 24,192 98,99
3 80 0,321 16,2057 16,064 100,88
100 0,395 20,0774 20,080 99,98
LAMPIRAN G
DATA PELEPASAN PROPRANOLOL HCL 1. Hasil Uji Pelepasan Patch Propranolol Formula -1
Replikasi t(jam) Abs Cn’(ppm) FP Qt (µg/cm
2
)
1 0,25 0,129 6,1617 5 261,64
0,5 0,178 8,7258 5 370,52
0,45 0,211 10,4526 5 443,85
1 0,237 11,8132 5 501,62
1,5 0,277 13,9063 5 590,50
2 0,315 15,8948 5 674,94
2,5 0,362 18,3543 5 779,37
3 0,397 20,1858 5 857,15
4 0,478 24,4244 5 1037,13
5 0,505 25,8373 5 1097,12
6 0,583 29,9189 5 1270,44
2 0,25 0,132 6,3187 5 268,31
0,5 0,184 9,0398 5 383,85
0,45 0,219 10,8713 5 461,63
1 0,261 13,0691 5 554,95
1,5 0,313 15,7902 5 670,50
2 0,345 17,4647 5 741,60
2,5 0,376 19,0869 5 810,48
3 0,409 20,8137 5 883,81
4 0,469 23,9534 5 1017,13
5 0,535 27,4071 5 1163,78
6 0,576 29,5526 5 1254,89
3 0,25 0,136 6,5280 5 277,20
0,5 0,189 9,3014 5 394,96
0,45 0,224 11,1329 5 472,74
1 0,265 13,2784 5 563,84
1,5 0,293 14,7436 5 626,05
2 0,321 16,2088 5 688,27
2,5 0,355 17,9880 5 763,82
3 0,387 19,6625 5 834,92
4 0,446 22,7499 5 966,02
5 0,519 26,5699 5 1128,23
6 0,569 29,1863 5 1239,33
2. Hasil Uji Pelepasan Patch Propranolol Formula a
Replikasi t(jam) Abs Cn’(ppm) FP Qt (µg/cm2 )
1 0,25 0,124 5,9001 5 250,53
0,5 0,148 7,1559 5 303,86
0,45 0,169 8,2548 5 350,52
1 0,228 11,3422 5 481,62
1,5 0,292 14,6913 5 623,83
2 0,341 17,2554 5 732,71
2,5 0,364 18,4589 5 783,82
3 0,388 19,7148 5 837,15
4 0,422 21,4940 5 912,70
5 0,459 23,4301 5 994,91
6 0,503 25,7326 5 1092,68
2 0,25 0,117 5,5338 5 234,98
0,5 0,139 6,6850 5 283,86
0,45 0,157 7,6269 5 323,86
1 0,225 11,1852 5 474,96
1,5 0,296 14,9006 5 632,72
2 0,339 17,1507 5 728,27
2,5 0,357 18,0926 5 768,26
3 0,373 18,9299 5 803,82
4 0,431 21,9649 5 932,69
5 0,466 23,7964 5 1010,46
6 0,519 26,5699 5 1128,23
3 0,25 0,129 6,1617 5 261,64
0,5 0,143 6,8943 5 292,75
0,45 0,155 7,5222 5 319,42
1 0,223 11,0806 5 470,51
1,5 0,293 14,7436 5 626,05
2 0,328 16,5751 5 703,83
2,5 0,381 19,3485 5 821,59
3 0,406 20,6567 5 877,14
4 0,436 22,2266 5 943,80
5 0,471 24,0581 5 1021,57
6 0,511 26,1512 5 1110,46
3. Hasil Uji Pelepasan Patch Propranolol Formula b
Replikasi t(jam) Abs Cn’(ppm) FP Qt (µg/cm
2
)
1 0,25 0,121 5,7428 5 243,85
0,5 0,154 7,4695 5 317,18
0,45 0,182 8,9346 5 379,39
1 0,286 14,3765 5 610,47
1,5 0,325 16,4172 5 697,12
2 0,367 18,6149 5 790,44
2,5 0,389 19,7661 5 839,32
3 0,443 22,5917 5 959,31
4 0,509 26,0452 5 1105,95
5 0,551 28,2429 5 1199,27
6 0,606 31,1208 5 1321,48
2 0,25 0,129 6,1614 5 261,63
0,5 0,175 8,5684 5 363,84
0,45 0,202 9,9812 5 423,83
1 0,242 12,0742 5 512,70
1,5 0,311 15,6847 5 666,02
2 0,357 18,0917 5 768,22
2,5 0,376 19,0859 5 810,44
3 0,448 22,8533 5 970,42
4 0,531 27,1964 5 1154,84
5 0,561 28,7662 5 1221,49
6 0,589 30,2313 5 1283,71
3 0,25 0,119 5,6381 5 239,41
0,5 0,142 6,8416 5 290,51
0,45 0,185 9,0916 5 386,06
1 0,261 13,0684 5 554,92
1,5 0,306 15,4231 5 654,91
2 0,325 16,4172 5 697,12
2,5 0,356 18,0393 5 766,00
3 0,439 22,3824 5 950,42
4 0,522 26,7254 5 1134,84
5 0,553 28,3475 5 1203,72
6 0,592 30,3883 5 1290,37
4. Hasil Uji Pelepasan Patch Propranolol Formula ab
Replikasi t(jam) Abs Cn’(ppm) FP Qt (µg/cm
2
)
1 0,25 0,118 5,5861 5 237,20
0,5 0,128 6,1094 5 259,42
0,45 0,145 6,9990 5 297,20
1 0,204 10,0863 5 428,29
1,5 0,247 12,3365 5 523,84
2 0,291 14,6389 5 621,61
2,5 0,355 17,9880 5 763,82
3 0,417 21,2323 5 901,59
4 0,477 24,3721 5 1034,91
5 0,519 26,5699 5 1128,23
6 0,541 27,7211 5 1177,12
2 0,25 0,119 5,6384 5 239,42
0,5 0,131 6,2664 5 266,09
0,45 0,144 6,9466 5 294,97
1 0,192 9,4584 5 401,63
1,5 0,249 12,4411 5 528,29
2 0,286 14,3773 5 610,50
2,5 0,343 17,3600 5 737,16
3 0,389 19,7671 5 839,37
4 0,443 22,5929 5 959,36
5 0,488 24,9477 5 1059,35
6 0,553 28,3490 5 1203,78
3 0,25 0,118 5,5861 5 237,20
0,5 0,134 6,4233 5 272,75
0,45 0,149 7,2083 5 306,08
1 0,226 11,2376 5 477,18
1,5 0,269 13,4877 5 572,73
2 0,312 15,7378 5 668,27
2,5 0,341 17,2554 5 732,71
3 0,403 20,4997 5 870,48
4 0,455 23,2208 5 986,02
LAMPIRAN H
DATA PENETRASI PROPRANOLOL HCL 1. Hasil Uji Penetrasi Patch Propranolol Formula -1
Replikasi t(jam) Abs C n’(ppm) Qt (µg/cm2 )
1 0,25 0,137 6,5803 55,88
0,5 0,215 10,6620 90,54
0,45 0,286 14,3773 122,10
1 0,374 18,9822 161,21
1,5 0,421 21,4417 182,09
2 0,478 24,4244 207,43
2,5 0,514 26,3082 223,42
3 0,565 28,9770 246,09
4 0,586 30,0759 255,42
5 0,762 39,2857 333,64
6 0,823 42,4778 360,74
2 0,25 0,142 6,8420 58,11
0,5 0,221 10,9759 93,21
0,45 0,292 14,6913 124,77
1 0,382 19,4008 164,76
1,5 0,408 20,7614 176,31
2 0,474 24,2151 205,64
2,5 0,519 26,5699 225,64
3 0,591 30,3375 257,65
4 0,633 32,5353 276,31
5 0,754 38,8671 330,08
6 0,839 43,3150 367,86
3 0,25 0,149 7,2083 61,22
0,5 0,218 10,8189 91,88
0,45 0,296 14,9006 126,54
1 0,357 18,0926 153,65
1,5 0,436 22,2266 188,76
2 0,481 24,5814 208,76
2,5 0,522 26,7268 226,98
3 0,57 29,2386 248,31
4 0,613 31,4887 267,42
5 0,756 38,9717 330,97
6 0,842 43,4720 369,19
2. Hasil Uji Penetrasi Patch Propranolol Formula a
Replikasi t(jam) Abs C n’(ppm) Qt (µg/cm2 )
1 0,25 0,119 5,6384 47,88
0,5 0,125 5,9524 50,55
0,45 0,133 6,3710 54,11
1 0,152 7,3653 62,55
1,5 0,173 8,4642 71,88
2 0,187 9,1968 78,10
2,5 0,258 12,9121 109,66
3 0,333 16,8367 142,99
4 0,466 23,7964 202,09
5 0,582 29,8666 253,64
6 0,689 35,4657 301,19
2 0,25 0,116 5,4814 46,55
0,5 0,122 5,7954 49,22
0,45 0,141 6,7896 57,66
1 0,158 7,6792 65,22
1,5 0,177 8,6735 73,66
2 0,207 10,2433 86,99
2,5 0,249 12,4411 105,65
3 0,295 14,8482 126,09
4 0,484 24,7384 210,09
5 0,577 29,6049 251,42
6 0,691 35,5704 302,08
3 0,25 0,117 5,5338 46,99
0,5 0,129 6,1617 52,33
0,45 0,136 6,5280 55,44
1 0,164 7,9932 67,88
1,5 0,179 8,7781 74,55
2 0,198 9,7724 82,99
2,5 0,255 12,7551 108,32
3 0,309 15,5808 132,32
4 0,468 23,9011 202,98
5 0,589 30,2329 256,75
6 0,702 36,1460 306,97
3. Hasil Uji Penetrasi Patch Propranolol Formula b
Replikasi t(jam) Abs C n’(ppm) Qt (µg/cm2 )
1 0,25 0,171 8,3595 70,99
0,5 0,196 9,6677 82,10
0,45 0,226 11,2376 95,43
1 0,248 12,3888 105,21
1,5 0,278 13,9587 118,55
2 0,298 15,0052 127,43
2,5 0,324 16,3658 138,98
3 0,442 22,5406 191,43
4 0,604 31,0178 263,42
5 0,738 38,0298 322,97
6 0,869 44,8849 381,18
2 0,25 0,177 8,6735 73,66
0,5 0,189 9,3014 78,99
0,45 0,223 11,0806 94,10
1 0,264 13,2261 112,32
1,5 0,286 14,3773 122,10
2 0,301 15,1622 128,76
2,5 0,359 18,1973 154,54
3 0,492 25,1570 213,64
4 0,647 33,2679 282,53
5 0,773 39,8613 338,53
6 0,862 44,5186 378,08
3 0,25 0,173 8,4642 71,88
0,5 0,194 9,5631 81,21
0,45 0,221 10,9759 93,21
1 0,262 13,1214 111,43
1,5 0,283 14,2203 120,76
2 0,331 16,7321 142,09
2,5 0,409 20,8137 176,76
3 0,474 24,2151 205,64
4 0,635 32,6400 277,19
5 0,763 39,3380 334,08
6 0,849 43,8383 372,29
4. Hasil Uji Penetrasi Patch Propranolol Formula ab
Replikasi t(jam) Abs C n’(ppm) Qt (µg/cm2 )
1 0,25 0,112 5,2721 44,77
0,5 0,138 6,6327 56,32
0,45 0,154 7,4699 63,43
1 0,189 9,3014 78,99
1,5 0,278 13,9587 118,54
2 0,391 19,8718 168,76
2,5 0,464 23,6918 201,20
3 0,518 26,5175 225,20
4 0,568 29,1340 247,42
5 0,682 35,0994 298,08
6 0,725 37,3496 317,19
2 0,25 0,118 5,5861 47,44
0,5 0,14 6,7373 57,22
0,45 0,159 7,7316 65,66
1 0,202 9,9817 84,77
1,5 0,269 13,4877 114,54
2 0,382 19,4008 164,76
2,5 0,46 23,4825 199,42
3 0,527 26,9885 229,20
4 0,602 30,9131 262,53
5 0,663 34,1052 289,64
6 0,737 37,9775 322,52
3 0,25 0,124 5,9001 50,10
0,5 0,144 6,9466 58,99
0,45 0,153 7,4176 62,99
1 0,202 9,9817 84,77
1,5 0,277 13,9063 118,10
2 0,335 16,9414 143,87
2,5 0,441 22,4882 190,98
3 0,489 25,0000 212,31
4 0,619 31,8027 270,08
5 0,679 34,9424 296,75
6 0,729 37,5589 318,97
LAMPIRAN I
HASIL UJI ANOVA PELEPASAN PROPRANOLOL HCL DENGAN DESAIN FAKTORIAL
.
Response 1 pelepasan
ANOVA for selected factorial model
Analysis of variance table [Partial sum of squares - Type III] Sum of Mean F p-value Source Squares df Square Value Prob > F
Model 2192.83 3 730.94 31.50 < 0.0001 sinificant A-cmc na 316.21 1 316.21 13.63
B-menthol 11.60 1 11.60 0.50 AB 1865.01 1 1865.01 80.37 Pure Error 185.64 8 23.20
Cor Total 2378.47 11
The Model F-value of 31.50 implies the model is significant. There is only a 0.01% chance that a "Model F-Value" this large could occur due to noise. Values of "Prob > F" less than 0.0500 indicate model terms are significant. In this case A, AB are significant model terms.
Values greater than 0.1000 indicate the model terms are not significant. If there are many insignificant model terms (not counting those required to support hierarchy),
model reduction may improve your model.
Std. Dev. 4.82 R-Squared 0,9219 Mean 165.85 Adj R-Squared 0.8927 C.V. % 2.90 Pred R-Squared 0.8244
PRESS 417.69 Adeq Precision 12.656
The "Pred R-Squared" of 0.8244 is in reasonable agreement with the "Adj R-Squared" of 0.8927.
"Adeq Precision" measures the signal to noise ratio. A ratio greater than 4 is desirable. Your
Coefficient Standard 95% CI 95% CI Factor Estimate df Error Low High VIF Intercept 165.85 1 1.39 162.64 169.06 A-cmc na -5.13 1 1.39 -8.34 -1.93 1.00 B-menthol 0.98 1 1.39 -2.22 4.19 1.00 AB 12.47 1 1.39 9.26 15.67 1.00
Final Equation in Terms of Coded Factors: pelepasan = +165.85
-5.13 * A +0.98 * B +12.47 * A * B
The Diagnostics Case Statistics Report has been moved to the
Diagnostics Node. In the Diagnostics Node, Select Case Statistics from the View Menu.
Proceed to Diagnostic Plots (the next icon in progression). Be sure to look at the:
1) Normal probability plot of the studentized residuals to check for normality of residuals.
2) Studentized residuals versus predicted values to check for constant error.
3) Externally Studentized Residuals to look for outliers, i.e., influential values.
4) Box-Cox plot for power transformations.
LAMPIRAN J
HASIL UJI ANOVA PENETRASI PROPRANOLOL HCL DENGAN DESAIN FAKTORIAL
Response2penetrasi
ANOVA for selected factorial model
Analysis of variance table [Partial sum of squares - Type III] Sum of Mean F p-value Source Squares df Square Value Prob > F
Model 121.68 3 40.56 129.97 < 0.0001 significant A-cmc na 28.86 1 28.86 92.48 < 0.0001
B-menthol 92.57 1 92.57 296.65 < 0.0001 AB 0.24 1 0.24 0.78 0.4027 Pure Error 2.50 8 0.31
Cor Total 124.18 11
The Model F-value of 129.97 implies the model is significant. There is only
a 0.01% chance that a "Model F-Value" this large could occur due to noise. Values of "Prob > F" less than 0.0500 indicate model terms are significant. In this case A, B are significant model terms.
Values greater than 0.1000 indicate the model terms are not significant. If there are many insignificant model terms (not counting those required to support hierarchy),
model reduction may improve your model.
Std. Dev. 0.56 R-Squared 0.9799 Mean 49.38 Adj R-Squared 0.9724 C.V. % 1.13 Pred R-Squared 0.9548 PRESS 5.62 Adeq Precision 26.840
The "Pred R-Squared" of 0.9548 is in reasonable agreement with the "Adj R-Squared" of 0.9724.
"Adeq Precision" measures the signal to noise ratio. A ratio greater than 4 is desirable. Your
Coefficient Standard 95% CI 95% CI
Factor Estimate df Error Low High VIF Intercept 49.38 1 0.16 49.01 49.75
A-cmc na -1.55 1 0.16 -1.92 -1.18 1.00 B-menthol 2.78 1 0.16 2.41 3.15 1.00 AB -0.14 1 0.16 -0.51 0.23 1.00 Final Equation in Terms of Coded Factors:
penetrasi = +49.38 -1.55 * A +2.78 * B -0.14 * A * B
The Diagnostics Case Statistics Report has been moved to the Diagnostics Node. In the Diagnostics Node, Select Case Statistics from the View Menu. Proceed to Diagnostic Plots (the next icon in progression). Be sure to look at the:
1) Normal probability plot of the studentized residuals to check for normality of residuals.
2) Studentized residuals versus predicted values to check for constant error.
3) Externally Studentized Residuals to look for outliers, i.e., influential values.
4) Box-Cox plot for power transformations.
LAMPIRAN K
POINT PREDICTION DENGAN DESAIN FAKTORIAL
Factor Name Level Low
Level Hight Level Std. Dev Coding
A CMC Na 1.00 -1.00 1.00 0.000 Actual
B Menthol 1,00 -1.00 1.00 0.000 Actual
Resp onse Predic tion SE Me an 95 % CI Lo w 95 % CI Hig h SE Predic tion 95 % PI Lo w 95 % PI Hig h 99% of Population 95 % TI Lo w 95 % TI Hig h Pelep asan
174.16 4.8
2
167, 75
180, 58
5,56 161,
34 186, 99 147, 76 200, 57 Penetr asi
50.46 0,5
6 49,7
2 51,2
1
0,65 48,9