Rapid Techniques for Mapping
Experiences
Rapid Techniques for Mapping Experiences
by Jim Kalbach
Copyright © 2017 O’Reilly Media, Inc. All rights reserved. Printed in the United States of America.
Published by O’Reilly Media, Inc., 1005 Gravenstein Highway North, Sebastopol, CA 95472. O’Reilly books may be purchased for educational, business, or sales promotional use. Online editions are also available for most titles (http://oreilly.com/safari). For more information, contact our corporate/institutional sales department: 800-998-9938 or [email protected].
Editor: Angela Rufino
Revision History for the First Edition
2016-12-22: First Release
The O’Reilly logo is a registered trademark of O’Reilly Media, Inc. Rapid Techniques for Mapping Experiences, the cover image, and related trade dress are trademarks of O’Reilly Media, Inc.
While the publisher and the author have used good faith efforts to ensure that the information and instructions contained in this work are accurate, the publisher and the author disclaim all
responsibility for errors or omissions, including without limitation responsibility for damages
resulting from the use of or reliance on this work. Use of the information and instructions contained in this work is at your own risk. If any code samples or other technology this work contains or describes is subject to open source licenses or the intellectual property rights of others, it is your responsibility to ensure that your use thereof complies with such licenses and/or rights.
Rapid Techniques for Mapping
Experiences
In 1997, Steve Jobs returned to Apple after having been asked to leave the company he founded. In a town hall meeting, he said:
You’ve got to start with the customer experience and work back toward the technology.
With this, he gave insight into how he was going to turn Apple around: by reversing the equation of product development.
At the time, his approach that lead to the meteoric rise of Apple seemed revolutionary. To some degree it was. But it wasn’t necessarily new. In 1960, writing in his famous article “Marketing Myopia,” Theodore Levitt, the famous Harvard professor wrote:
An industry begins with the customer and his needs, not with a patent, a raw material, or a
selling skill…The industry develops backwards, first concerning itself with the physical delivery of customer satisfaction.
Much of the business literature of 1950s and 1960s reflects similar perspectives. So, Jobs’ comment really represents a return to core business principles that were already present in theory but not in practice. The notion of “starting with the experience and working back toward the technology” symbolizes the renaissance in customer-centric thinking.
We see other signs of a shift in business thinking. For instance, in 2015 Mark Benioff, the CEO of SalesForce said:
The business of business isn’t just about creating profits for shareholders—it’s also about improving the state of the world and driving stakeholder value.
Most notable, the notion of “shared value,” a concept in business put forth by business strategy guru Michael Porter, also reflects change in business thinking. With shared value, companies gain
competitive advantage by innovating business models that consider the end consumer and society as a whole first.
The signs are there: we’re witnessing a shift in business of Copernican proportions: today, customers don’t revolve around the business; rather, the businesses must figure out how they fit into the lives of their customers. This requires a new mindset.
Visualizing the Experience
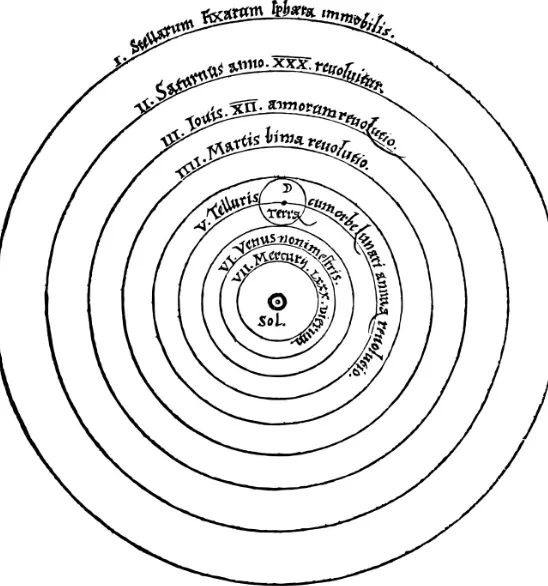
In 1543, Copernicus created the diagram shown in Figure 1-1 to explain his observations of the solar system. This allowed others to grasp his revolutionary discovery: the earth revolves around the sun,
1
2
3
4
not the other way around.
Just as Copernicus modeled his observations of the solar system, organizations can model their customer experiences. A diagram of the individual’s experience serves as a tangible model around which the teams can rally. More important, visualizations allow the viewer to grasp interlocking relationships at once.
Figure 1-1. The Copernican model of the solar system
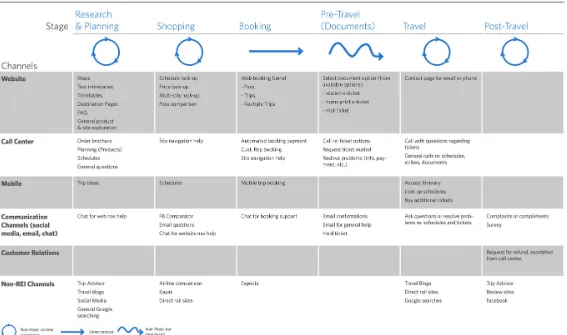
Figure 1-2 shows an example of such a diagram. In this case, it’s an experience map for organizing an event such as a conference. The map reflects the perspective of the organizers. It aligns many facets of information (rows) across different stages in a timeline (columns). With this, teams can assess how they fit into the customer’s universe.
Overall, these diagrams seek to align an internal organizational perspective to the outside world. They’re models of the experience individuals have when interacting with a company’s offering, or when they are just trying to get a job done.
Figure 1-2. An example of a hi-fidelity experience map, in this case for the experience of organizing a conference
But creating a diagram is not about artistic talent. It’s about creating a visualization that breaks organizational silos and aligns teams around a common view of the experience. You can do this quickly and with low-fidelity diagrams.
Consider the diagram in Figure 1-3 created by Eric Berkman, a design strategist and author of
Designing Mobile Interfaces (O’Reilly, 2011). It’s visually minimal, but reveals key insights about both negative and positive service aspects at a Starbucks coffee shop.
a team, this is an effective way to achieve alignment. Depending on your situation, this might be all that’s needed to communicate observations of an experience to others.
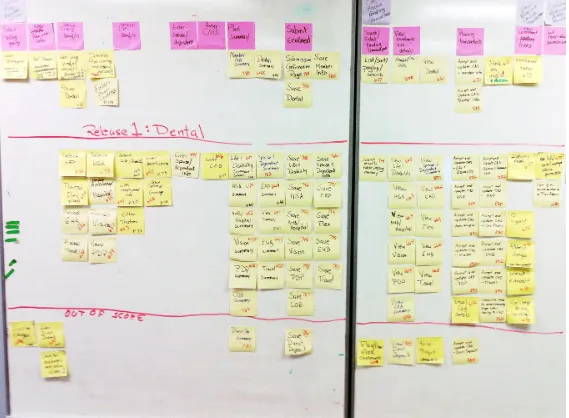
Figure 1-4. An example of a user story map created on a wall with sticky notes
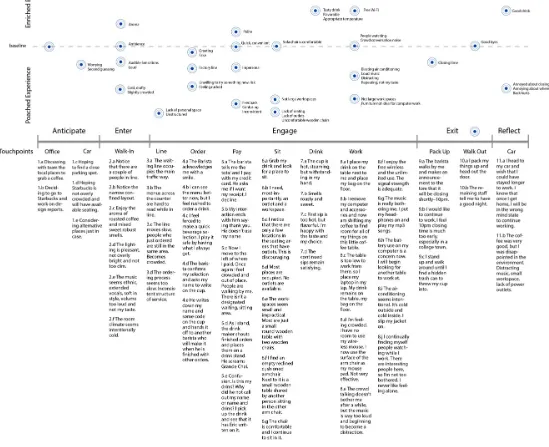
This report focuses on specific techniques to map experiences in a short time frame—within a week or two from beginning to end. A key point to remember is that you should involve others throughout the process. In rapid contexts, the map will be co-created, with input at each of the stages.
BENEFITS OF MAPPING EXPERIENCES
From my work with dozens of companies, I have seen teams with the best intentions focused too much on internal processes. They are wrapped up in a type of organizational navel-gazing. Many simply don’t know what customers actually go through.
What’s needed is a change in viewpoint—from inside-out to outside-in. Organizations must have a clear understanding of the experiences they create. This is not limited to just frontline
personnel; everyone must empathize with the individuals they serve.
Organizational silos prevent alignment. Aligned organizations instead work across functional boundaries. They have a relentless focus on doing whatever it takes to ensure that their
constituents have great experiences.
They build empathy, shifting an organization’s view from inside-out to outside-in. Mapping experiences gives teams a common big picture.
Mapping experiences help break organization silos. Visualizations bring focus to organizations.
Alignment diagrams point to opportunities for improvement and innovation.
The key is to focus on gaining an outside-in perspective of your customers and fostering team alignment. There are many types of diagrams that can help do this, and they don’t need to take long to create.
A General Process for Rapid Mapping
Mapping helps us to understand complex systems of interaction, particularly when dealing with abstract concepts like experience. But the map itself doesn’t make decisions for you. Instead, an organization must use the diagram as a means to foster discussion and debate to arrive at a shared sense of reality.
The key is to focus on the verb mapping rather than the noun map. The journey is as important—if not more so—than the destination. It’s better that your team has the same perspective and the same basis for decision-making than having a good-looking diagram. And that can be accomplished with a simple, low-fidelity map.
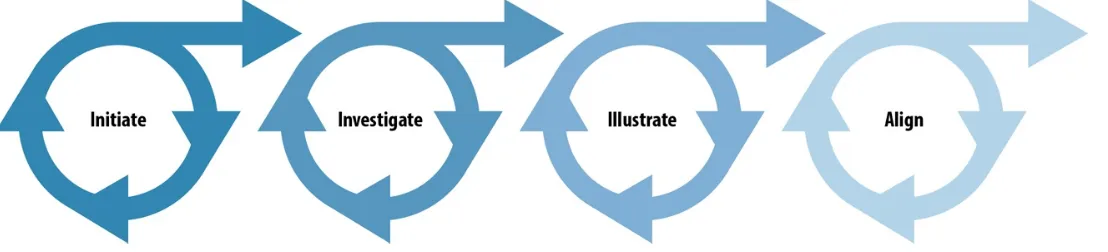
Figure 1-5 shows the four steps of mapping. We can use these stages to describe any effort, small or large. Note that the process might not be completely linear, and iteration within and between each stage might be possible, as well.
Figure 1-5. The four stages of mapping experiences
The sections that follow detail each of these stages for mapping experiences. Here’s a brief overview:
Initiate
Investigate the experience with research so that your map is grounded in reality. This outlines how to perform research before creating a diagram.
Illustrate
Create an illustration of the experience so that others can visualize it and come to a common understanding.
Align
Align the team to the experience in a workshop, and use that opportunity to envision future experiences and solutions.
It’s important to reiterate that visualizations don’t provide answers outright; they foster conversations. Diagrams are compelling artifacts that draw interest and attention from others in the organization. They are a means to engage others in discourse. Visualizations point to opportunities and serve as springboards into innovation.
Initiate: Make It Relevant
I’m often asked how to get started. Knowing where to begin isn’t easy. There are many questions to address before embarking on the effort.
Part of the problems is that experience defies precise definition. It’s a broad and fuzzy concept. You need to first untangle it and figure out what’s most appropriate.
Ultimately it’s a matter of selection. As the mapmaker, it’s up to you to decide on which aspects to include and which to leave out. Maps are purposefully created, and it’s up to you to frame the effort appropriately.
This includes setting client and stakeholder expectations from the outset. You won’t be able to map every experience of every actor in your ecosystem of customer interactions. You need to decide and define which experiences and which elements you’ll include and, at the same time, what you’ll leave out.
To get started, answer the five key questions for setting up a mapping effort. For some of them, the answer might be obvious and take no deliberation. In other cases, you might need to meet with your client or project sponsor to negotiate a decision. Either way, you can typically initiate an effort in a single, extended meeting at most.
The goal is to ensure that the diagram is relevant to the organization. Focus on answering the following five questions to get started.
1. What is your point of view?
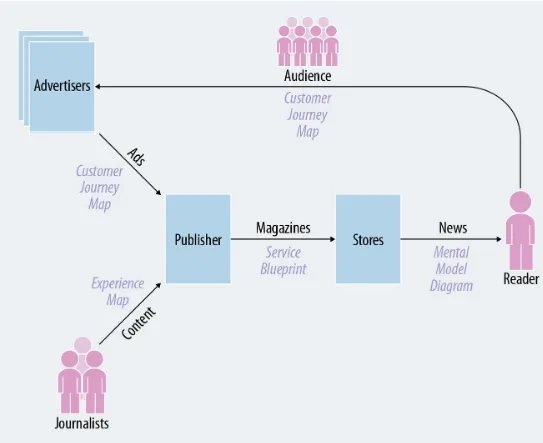
For instance, a news magazine might serve multiple audiences: readers and advertisers. They also deal with journalists and have distributors. You could map the experience of any of these actors and their interactions with the publisher.
One thing I recommend doing up front is to create a concept map of all of the actors and entities involved, called a stakeholder map. The example in Figure 1-6 shows a high-level map of an ecosystem for a news magazine publisher.
Figure 1-6. An example stakeholder map
From left to right, we can follow the interaction between stakeholders: journalists write content that is printed by the publisher in the magazine. Advertisers pay for advertising, which is a main source of revenue for the publisher. Then, the publisher distributes the magazine to news outlets. The reader consumes the news after buying it from an outlet. Advertisers see value in their advertising only after readers have purchased and read the magazine.
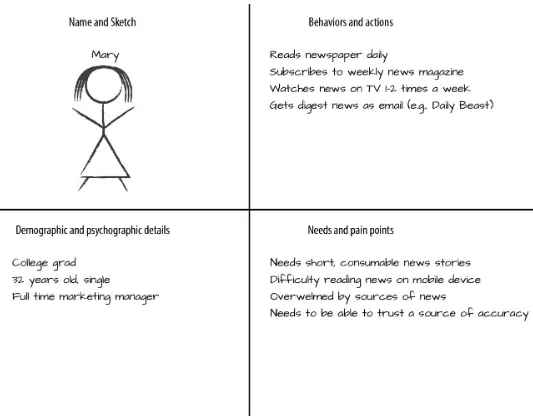
You can also derive personas from the stakeholder map. If you don’t already have personas, create proto-personas quickly. They are depictions of who you believe your target audience is, based on what you know today.
Proto-personas can be outlined on a simple grid with four squares, as shown in Figure 1-7. There are four main elements: name and sketch, demographic and psychographic details, behaviors and actions, needs and pain points.
Figure 1-7. A simple proto-persona based on current knowledge and assumptions
The proto-persona gives the team an easy way to refer to the individuals involved in the mapping effort early on. Instead of saying user, you can refer to Mary, for instance. Fully-fledged personas can then be created later as the project unfolds, if needed, after you’ve completed more in-depth research.
2. What is the scope of the experience?
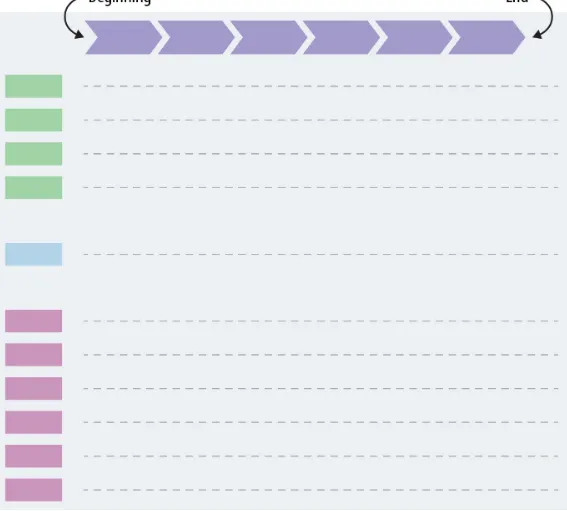
Scope refers to the breadth of the experience, from beginning to end. What are the boundaries? Where does it begin and end? There are no right or wrongs, only appropriate or not appropriate for your context.
Figure 1-8. The scope of the diagram determines when it begins and ends
In a customer journey map, for example, the experience often begins with becoming aware of a product or service. But it also could begin with the individual’s prior knowledge or experience just before she becomes aware. On the other end, the journey might end with renewing a subscription, but it could also entail leaving a service and even returning.
The point is that you’ll need to determine the scope of the experience and what parts you’ll include and not include.
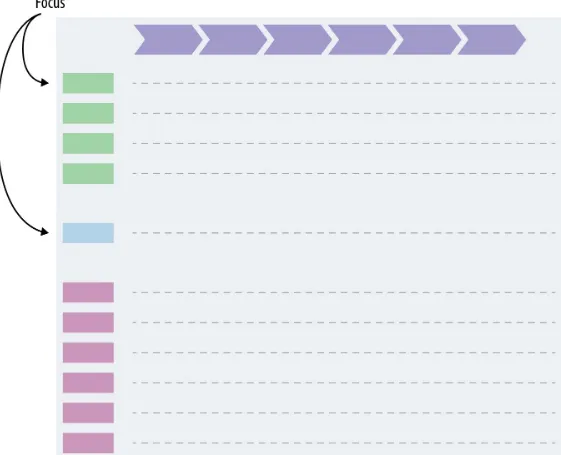
3. What is your focus?
Typically, maps of an experience focus on physical artifacts, actions, thoughts, and feelings. But you also could highlight needs, goals, and challenges. And, there are specific situations you might include, such as mobile contexts or the interaction with other actors.
There is no right or wrong, so it’s up to you to find out what aspects are most relevant to your organization. For a chronological diagram, think of your focus as the rows of information you’re going to include.
Figure 1-9. The focus of a diagram determines what aspects and elements you’ll include to visualize the experience
4. How will you structure the diagram?
Diagrams differ in structure. The most common scheme is chronological. This is usually represented in a large table-like arrangement with rows and columns.
Apart from chronological maps, other organizational schemes are possible. These include
Figure 1-10. Structure: how will you arrange and represent the information in the diagram?
Even at very early stages of the mapping project, you can create a back-of-the-napkin sketch of what you think the diagram might end up looking like. This gives you a chance to involve others and solicit input from stakeholders, helping to further set their expectations. It also will help you to move faster later on because you’ll have the overall target format toward which you’re working.
5. How will you use the map?
Finally, keep the intended use of a diagram in mind from the very beginning.
others wanting more.
Also, consider what the purpose is of the diagrams. Frame the effort in a way that is appropriate for your team’s needs. What questions does the organization have that a diagram can address? What gaps in knowledge does it fill?
Finally, ask yourself how the diagram will be used. Typically, you’ll facilitate work sessions that engage a diverse team with the map (see the section “Align and Envision: Make It Actionable” later in this report). Schedule this well in advance to ensure that you’ll get everyone’s time and attention.
Summary of Rapid Techniques for Initiating
Table 1-1 presents a synopsis of the activities you’ll perform when initiating a mapping project. Table 1-1. A summary of activities when initiating a mapping project
Stage Duration People Outcome
1. Answer the five questions
to getting started 1 hour (orless) 2–3 people, including sponsors ordecision makers Set expectations on objective of the effort
2. Create a stakeholder map 1–2 hours 3–5 people Understand all possible, relevant experiences to includeand decide which to focus on 3. Rough sketch of the form of
the map 1 hour (orless) Get alignment on the possible ways to structure adiagram 4. Schedule an extended
working session 1 hour (orless) 2–3 people Ensure that you’ll get time for a workshop with theextended team
Total time Half day
In the end, there is no right or wrong way to map experiences. It’s up to you as the mapmaker to ensure that the effort is on target and appropriate for your situation.
When working rapidly, you can initiate a project in about a half day or less. The important thing to keep in mind is your goal at this stage: ensuring that the effort is relevant to the team and to the organization.
Investigate: Make It Real
The aim at this stage is to ground your mapping effort in reality. Of course, many teams might already know a lot about the individual’s experience. That’s a good sign, and you should take advantage of existing knowledge where and when you can.
inspiration for innovation.
How much investigation is needed? There is no right or wrong answer. But some investigation is better than none. In a rapid context, as outlined in this report, you’ll want to limit this stage to few days of work.
Note that due to dependencies on other people and activities, such as recruiting participants, the actual duration of time needed can be spread out beyond a few days. In other words, you might not be able to move from initiating a project to investigation from one day to the next due to scheduling. However, the total person-hours should add up to only a few days when working rapidly.
There are four activities to include in your investigation, which I outline in the following sections.
1. Review Existing Sources of Information
Begin with existing sources of information. Review previous marketing studies, usability test findings, customer support log data, and even industry reports and whitepapers.
You probably won’t find a single source of information about an end-to-end customer experience. Most industry reports and whitepapers only focus on slices of an overall experience. And unless your organization has already done work mapping experiences, it’s unlikely that you’ll have any
preexisting research in house.
Instead, you’ll need to pick through and identify the relevant bits of information. This is a bottom-up process that takes patience to uncover related insight. An industry report, for instance, might include only a few facts useful for your particular project.
Comb through existing data and create a list of relevant observations. Be sure to note the sources for each fact so that you can reference the data in your diagram later, if needed.
I often consolidate information from existing sources in a simple table. Table 1-2 shows an example of this approach, in this case for a software company investigating its onboarding and installation process.
Table 1-2. Source 1: Email Feedback
Evidence Interpretations Experience Implications
Many emails indicate trouble with installation, e.g.:
“After going through the instructions and process several times, I gave up.” + — Trial customer
People lack the skills and knowledge to complete the installation process and thus become frustrated.
People don’t have the time or patience to read the instructions carefully.
Installation is a problematic phase in the journey.
There were frequent questions about having administrator rights to install the software, e.g.:
“I got the message ‘Please contact your IT admin’ and didn’t know what to do.”
For security reasons, many companies don’t allow employees to install software.
It can be difficult or time consuming for employees to contact an IT administrator.
Some emails praised customer support, e.g.:
“The customer service agent I spoke with was really knowledgeable and helpful!”
People like to be able to speak with a “real” person.
People feel like they are getting personal attention with live agents.
Customer support is a positive aspect of the current experience.
After you have a list of relevant insights, you can find interesting patterns that might inform the creation of your diagram.
2. Create a Touchpoint Inventory
Take inventory of current touchpoints between the individual and the organization. One way to do this is with mystery shopping, a type of role playing in which you go through a process as if you were a customer.
As you experience the product or service, record the touchpoints they come in contact with, including physical evidence, digital touchpoints, and in-person encounters. The objective is to gather a list of all possible points of interaction between an individual and an organization.
Figure 1-11 shows an example of a simple touchpoint inventory, in this case created by Chris Risdon of Adaptive Path for a service called Rail Europe. It’s a simple table with a list of existing points of interaction.
You should include images and screenshots of key points in the experience for reference. You also should include quantitative information about the experience. Keep this information on hand to include in your final diagram.
Overall, creating a touchpoint inventory will help you to understand the details and interactions of the current experience.
3. Interview Internal Stakeholders
Mapping experiences necessarily involves investigation with people within the organization. Seek out a range of people to interview beyond just the main client or project sponsors. Include managers, sales representatives, engineers and technicians, and frontline personnel.
At this point, your investigation is exploratory: you want to uncover the main themes to research further with real customers. The sample of people you have access to might be fairly small—about four to six stakeholders.
Internal stakeholder interviews can be informal and take anywhere from 30 to 60 minutes. If the stakeholders work in the same location, it might take only a day to complete. Phone interviews also are possible if you can’t get with everyone face-to-face.
Figure 1-12. Example of a sketch created during a stakeholder interview
4. Conduct Research Externally
Research with actual customers typically focuses on qualitative interviews and observations. I recommend conducting interviews on location so that you can also make direct observations of the customer’s environment. An alternative is to conduct remote interviews by phone, and
teleconferencing software is also a viable option.
When interviewing, keep your questions open and avoid getting yes or no answers. Let participants speak about their experience in their own words. Prompt them to keep talking with phrases like, “tell me more about that,” or, “help me understand that better.” Dig deep to find key insights to include in your diagram.
Take notes during each interview and record the audio of the session if you can. After each interview, begin compiling your insights in a table that resembles your target diagram. Use the phases of your touchpoint map or draft diagram to structure the table.
For instance, Figure 1-13 shows a spreadsheet that that you can use to capture research findings across several interviews. This is a modified version of a data-collection sheet I used on a past project investigating a chronic, life-threatening illness. It allowed multiple people to contribute the research and helped focus the effort to collect relevant information only.
Figure 1-13. Capture research insights in a spreadsheet to organize them quickly
Summary of Rapid Techniques for Investigating
Table 1-3. A summary of activities when investigating a mapping project
Step Duration People Outcome
1. Review existing sources of
information 2–4 hours 1–2 people, including the keyinvestigators and mapmakers Gather initial data from existing sources 2. Create a touchpoint
inventory 4 hours 1–2 investigators Understand the interactions of the currentexperience 3. Conduct internal
interviews 4–8 hours 1–2 researchers plus 5–8 stakeholdersto interview Research what others already know about thecustomer experience 4. Conduct external research 1–2 days 2–3 investigators plus 5–8 participants Ground your investigation in reality through directcontact with customers
Total time 3–4 days
Note that recruiting external users might take some coordination and contribute to delays in these estimates in terms of overall duration. Plan ahead as much as possible and strive to keep the timelines short.
Illustrate: Make It Visual
Creating a diagram is not about artistic talent. You don’t need to be a graphic designer to map an experience. As you can see so far, the process is really about including others and engaging your team.
But have no doubt about one thing: visualization is a key part of the technique. A written report
summarizing the findings of your investigation might span 10 or more pages, but you know it won’t be read carefully, if at all.
Instead, a visualization allows others to grasp the entirety of the experience at once without
necessarily leaving out the detail. A visual representation is compelling and engaging, and it invites conversation as a team.
There are two approaches to building a diagram at this point: Create a diagram together with your team
Schedule a workshop with an extended team of 8 to 12 people to build the diagram together. You can do this by using sticky notes on a whiteboard or wall. This typically needs four hours to complete as a group. Making this is a team activity helps galvanize understanding and buy-in. After all, people support what they help make.
Draft a diagram ahead of time
in activities, such as brainstorming and ideation.
A combination of these two approaches is also possible. Use the information you’ve gathered so far to create a partially complete diagram to bring into a team workshop. For instance, you can determine the point of view and define the scope with some high-level phases. Then, you can complete a few rows of information in the diagram but leave others blank for the team to fill in.
The advantage of bringing a partially complete map to a team workshop is that you’ll avoid becoming derailed over disagreements on things like whose experience are you focusing on and what the phases of interaction are. Determine those elements in advance to let the group focus on more important issues, such as the interaction around touchpoints and where the customer experience breaks down. Regardless of your approach, there are three key considerations when illustrating the diagram, which we’ll look at in the following sections.
1. Lay Out the Diagram
Typically, diagrams have a table-like structure. But it’s worthwhile to consider alternative forms, as well. Used correctly, the layout itself can enhance the overall story the diagram tells. For instance, for repetitive processes, a circular diagram might be more appropriate than a table.
Figure 1-14 shows some possible layouts and formats.
Figure 1-14. A summary of possible layouts for alignment diagrams of various kinds
2. Compile the Content
to just the key points that are more meaningful to your team. This is more difficult than it sounds, and you can lose a lot of time consolidating information. Try to move quickly by keeping the objectives of the overall effort in mind.
Note that at this point that you’re focused on describing the current state experience. It’s important to first understand how the world currently works before envisioning a new future. In the next stage (see the section “Align and Envision: Make It Actionable” later in this report), you’ll be looking at ways to improve and innovate.
3. Represent the Information
People like information that is rich in presentation. Content that is presented with color, texture, and style has relevance to our lives and our work. The visual presentation of a diagram influences how others understand the information.
Even when creating a diagram in real time using sticky notes with your team, strive to create a consistent visual language that amplifies your storyline. What insights should be highlighted? What are the key messages that you want to communicate? How can you make the diagram approachable, aesthetically pleasing, and more compelling?
Pay attention to things like color coding, position of elements, and consistent use of language. You can hack simple spreadsheets to make a meaningful diagram that have a consistent representation of
Figure 1-15. It isn’t necessary to create diagrams in graphics programs to be effective; this example was created in Excel
Summary of Rapid Techniques for Illustrating
Table 1-4 presents an overview of the activities you’ll perform when illustrating a mapping project. Table 1-4. A summary of activities when illustrating a mapping project
Step Duration People Outcome
1. Layout the
diagram 1 hour 1–2 people, including the key mapmaker and akey sponsor Determine the arrangement of information onthe diagram 2. Compile the
content 4–8 hours 1–2 people, including the key mapmaker and akey sponsor Reduce the information you want to include 3. Design the
information 2–4 hours 1–2 people, including the key mapmaker and akey sponsor Finalize the diagram with graphic elements,color, etc.
Total time Half day to 2days
Align and Envision: Make It Actionable
Answers to your organization’s questions don’t magically fall out of the diagram. The map itself is important, but not the ultimate goal: it’s a means to engage others in discourse. Your job is to make this discourse happen.
At this point, your role switches from mapmaker to facilitator. You don’t want to attach your final diagram as an email attachment and hope others read it. Instead, you need to actively guide your team through the mapping process.
Hold an extended workshop with your team to engage them. First understand the current experience. Then envision possible future experiences as a group. Schedule this workshop in advance to ensure maximum participation.
A workshop typically has three main parts:
1. Empathize
Empathy is about seeing the world through someone else’s eyes. It’s about an implicit sense of what an experience is like, what people value, and what emotions are involved. It’s not enough that you empathize with the experiences people have. You need to ensure that others gain that same deep understanding.
you get understanding and buy-in across the team.
Figure 1-16. Present the map in a workshop and ask others to contribute to it
Next, evaluate the organization’s ability to support the experience at each step. There are several ways to do this quickly:
Grade performance
How well does the organization perform at each stage? Assign a simple school grade to each phase.
Identify moments of truth
Where are the most intense moments in the experience for the individual? Have the team vote and then discuss the results.
Vote on importance to the organization
How important is each point in the experience to the organization? Find the most impactful points in the experience together.
2. Envision
Use your collective empathy for the current experience as a springboard into envisioning future solutions. At this point, the process is one of going wide, or divergent thinking.
Ideate new experiences. For instance, begin with a general round of brainstorming. I find it helpful to let people get out their initial ideas quickly—even ideas they had before the workshop—so that they are open to further ideation later on.
To guide the brainstorming, create specific statements to which the group can react. These can be derived from the main pain points you want to overcome, for instance.
“How might we…?” shifts attention from the current to the future state. For example, a software company might find pain points around the onboarding experience. They might then ask, “How might we make onboarding more frictionless?” Having participants respond to specific statements like this produces better brainstorming results.
“What if…?” helps change direction and dig deeper. For example, in the previous scenario, you might ask, “What if we had to onboard a million people at once?” Phrasing a challenge statement this way shifts thinking and opens up the brainstorming.
As the facilitator, plan further exercises to keep the creativity of the group moving. An excellent source of ideas is the book Gamestorming (O’Reilly, 2010) by Dave Gray et al. This is a collection of activities to engage groups of people to playfully explore a given problem space and find
innovative solutions.
After the group generates a lot of ideas, select the ones to move forward. At this point you’ll switch from divergent thinking to convergent thinking.
One framework to help you select concepts is a simple matrix (Figure 1-17). Typically, you’ll be looking at feasibility versus value, or importance versus difficulty. Place the ideas you’ve generate so far on the matrix and then decide together as a team which you want to develop further.
Figure 1-17. A simple matrix can help select concepts and ideas to move forward
As quickly as possible, articulate the ideas you want to evaluate. Even within a few hours you can create representations of your main ideas for evaluation. This “debugs” your thinking and can prove or disprove the value of an idea quickly, as well.
Here are a few techniques to try: Write scenarios
Write out the details of a concept in prose. Be as detailed as possible in terms of the anticipated experience. Even the simplest of concepts can easily fill multiple pages of text. Let others read and critique it.
Create storyboards
Draw a flowchart
Quickly express the steps of your idea as steps in a flowchart. This will help you to make connections and see all of the moving parts at once.
Sketch ideas
Quickly draw an image of the product or service to share with others. Wireframe solutions
Create simple grayscale versions of screens for interaction. Build a prototype
With easy-to-use online prototyping tools such as UX Pin, it’s very simple to simulate working software. You can create a convincing prototype in a matter of hours, as illustrated in Figure 1-18. When working with physical products, you can use cardboard and clay to articulate the concept as a prototype for evaluation.
3. Evaluate and Test
Schedule time in the workshop to evaluate the artifacts you created rapidly. They will be based on presumptions at this point, but that’s OK. In fact, it is better to presume and fail than to
over-rationalize the merit of an idea based on its face value alone.
Get feedback on your prototypes as quickly as possible. This will not be controlled, scientific research. Instead, the aim is to understand your assumptions better. Are you solving the right problems? Does your idea address the problem in the right way?
Here are some lightweight ways to evaluate the leading concepts from the workshop in a rapid way: Hallway testing
Get feedback from people close by who are not a part of the workshop. Colleagues in other departments can provide quick, initial reactions on your concepts, for instance.
Online tests
There are many online services that provide feedback on concepts and prototypes; for example,
UserTesting. You’ll usually get results within a matter of hours. Focus groups
Recruit people in advance of the workshop to give direct feedback. Invite them into the workshop and present the concepts to them to see how they react.
Moderated concept tests
Figure 1-19. An example of a concept test during a workshop
RUNNING A WORKSHOP AS SPRINTS
The process for a team workshop outlined in this report—empathy, envisioning, and evaluating— has no time frame. The process has the form shown in Figure 1-20.
Figure 1-20. Regardless of duration, the mapping workshop takes a similar form, moving from empathy and the envisioning, and then onto evaluating and experimenting
Figure 1-21 show approximate schedules for workshops across one, two, and three days, respectively.
Figure 1-21. Possible breakdown of one-, two-, and three-day workshops.
This approach resembles design sprints, a popular format for bringing teams together to solve design challenges. For more, see Design Sprints by Richard Banfield et al. and Sprint by Jake Knapp. Regardless of the label, the intent is the same: begin with a collective understanding of the experience and then find solutions from there.
Facilitating rapid sessions and workshops takes some effort and forethought. As the facilitator, it’s your job to keep the team on track to get the results you’re looking for.
In planning a workshop, you need to prepare well, run the workshop, and then follow up. Here are some aspects to consider for each:
1. Prepare
Organize the alignment workshop well in advance. Include it in your initial proposal, and schedule the event early.
Invite a range of stakeholders
Groups between 6 to 12 participants work best. Find a date and time
Book the workshop early. In many organizations getting people to commit for a entire day or
multiple days is difficult. Reserve a room
Book an oversized room for the number of people you’ve invited. This can be onsite or offsite.
Plan logistics
Secure equipment and supplies in advance. You will also need several large, printed copies of the diagram.
Arrange catering
It’s important to take breaks and have snacks. Get out of the workshop room for lunch, but try to stay close by.
Hold a preworkshop meeting
Schedule a meeting or call a week before the workshop.
2. Run the Workshop
Set the stage
Explain the parts of the workshop: empathizing, envisioning, and evaluating. Engage with the diagram
Plan exercises that make people absorb the information in the diagram Facilitate divergent thinking
Brainstorming is the principle way to generate new ideas. Create artifacts
Sketch, draw, and prototype your ideas quickly. Select concepts
Focus on ideas that have high value to customers and to the organization. Run tests
Quickly evaluate the leading concepts. Plan social activities
Include a social event such as an evening dinner. This helps build trust and respect.
3. Follow Up
Get feedback on the session
Follow up with a brief survey. Update the diagram
Take the feedback you get from the session and update the diagram. Distribute materials
Collate the output of the workshop and distribute it to others who didn’t participate. Make the diagrams visible
Create different forms of the diagram and make them visible.
Finally, the effort does not end with the workshop. Ensure that the experiments are actually conducted. Keep the momentum going with an action plan and assigned owners of each experiment. Hold weekly checkpoints to track progress.
Summary of Rapid Techniques for Aligning and Envisioning
Table 1-5 presents a synopsis of the activities you’ll perform when aligning and envisioning a mapping project.
Table 1-5. A summary of activities when aligning and envisioning a mapping project
Step Duration People Objective
1.
Empathize 2–4 hours 5–15 people, including mix ofstakeholders See the experience from the individual’s perspective 2. Envision 2–4 hours 5–15 people, including mix ofstakeholders Ideate solutions for improvement and innovation
3. Evaluate 2–8 hours 5–15 people, including mix ofstakeholders Assess early-stage ideas to filter and prioritize, as well as develop themfurther
Total time 1–3 days
Experiment
Some of the ideas that result from a mapping effort are no-brainers. These tend to be incremental improvements. For instance, it might be an easy win to update the text of an onboarding email to avoid confusion. Or, you might be able to better coordinate marketing and sales efforts with a weekly sync-up meeting. By all mean, act on ideas that just make sense.
Ideas alone have no value. Even a prototype of a concept you created and tested has no value.
Although you already have initial feedback on your ideas, you still don’t know how either the market or the rest of the organization will react to the proposed innovation. An idea on a sticky note is far from being ready to implement.
Mapping experiences is an ongoing conversation with your team and organization. It doesn’t end with a brainstorming session. Don’t leave the workshop with a wall full of sticky notes and few concept prototypes. That won’t keep the conversation going.
Instead, think of new concepts emerging from mapping effort as hypotheses. The outcome of the mapping workshop, then, should be to plan experiments. Aim to create well-formed hypotheses statements for each of the concepts you’ve decided to move forward. Structurally, there are three parts:
We believe that providing [solution, service] for [individual, customer, user] Will likely result in [desired outcome, assumed effect]
We will know this when we see [result, measurable impact]
Notice that the hypothesis is phrased as a belief. You won’t know the impact until you introduce it into the market. Also note that if there is not a measurable outcome, you don’t have a testable hypothesis. Be sure to include a metric.
Set the right expectations in advance: you won’t end the workshop with ready-to-implement new concepts. Instead, prepare everyone for further testing and development. Think about it as a type of “idea R&D” rather than a source of backlog items.
More important, before the workshop even begins, arrange for the time and resources you’ll need to conduct experiments afterward. Involve project managers to start scheduling follow-on activities. Make sure you have a team to continue working after the session is over. Set clear targets and goals, and set up check points to measure progress over the next weeks and months.
Keep in mind that you’re not necessarily building a product or launching a service. The aim is to prove out business viability with the minimum effort. Some specific, light-weight approaches include the following:
Explanatory video
Create a video explaining your service and circulate it on the internet. Measure interest via traffic and response rates.
Landing page
Sometimes called a “fake storefront,” or announcing of the fictitious launch of your proposed service (Figure 1-22).
Working prototype
Simulate a functioning version of your concept. Test this with potential customers and measure concrete aspects such as task completion and satisfaction.
Concierge service
Begin with a simulated version of your service. Invite a very limited set of potential customers to sign up and then provide the service manually.
Limited product release
Create a version of your service with only one or two functioning features. Measure the success and appeal of those features.
Combinations of the above are also possible. For instance, after one recent workshop I conducted, we developed both an explanatory video and a landing page (Figure 1-22). Visitors could view the video and then sign up to be notified for a beta release. There was a short, three-question survey we
Figure 1-22. SnapSupport began as a concept video and landing page to test market reactions to the idea before a working prototype was built
From these touchpoints, we were able to measure traffic to the website over a given period of time, the number of sign-ups, and responses to our survey. We also spoke with selected individuals to better understand their motivations and what excited them about our value proposition.
Those familiar with the current literature on “lean” techniques will recognize some of these
approaches. Other techniques and tests are also possible. For more on defining and running market experiments, see Eric Reis’s Lean Startup and Ash Maurya’s Running Lean. Also recommended are Lean UX by Jeff Gothelf and The Innovator’s Hypothesis by Michael Schrage.
The point here is to try activities together. As the facilitator, it’s up to you to start a conversation about how your organization will innovate as well as seeing that conclusion to its end.
Conclusion
Mapping experiences is a broad set of activities that engage others. Though often focused on heavy-upfront research and hi-fidelity visualizations, these need not be the case. The benefits of mapping can be realized in a short period of time—about one to two weeks in total duration.
The process has four modes of activity, as shown in Figure 1-23, which are followed by ongoing research and development. This report has outlined and highlight specific techniques to move through each quickly.
Figure 1-23. The four modes of the mapping process
Table 1-6 presents a summary of estimates for a mapping project with low and high estimates. Your situation might require more or less time at each stage. Note also that due to external dependencies such as recruiting customers to interview, the duration of these estimates might be longer in between each stage.
Table 1-6. Estimated time needed for each stage of a mapping project
Stage Low rapidestimate High rapidestimate Objective
Initiate 1 hour 1 day Ensure the effort is relevant to the organization
Investigate 1–2 days 3–4 days Ground the effort in reality with research and feedback from real people
9 10
Illustrate Half day 2 days Visualize the experience for the whole organization to see Align and
Envision 1–2 days 3–4 days Foster conversations and activities around the experience to come up withsolutions
Total ~1 week ~2 weeks
These estimates also don’t include ongoing experimentation. In rapid context, this can be limited in time, as well. For instance, select three experiments to move forward with small teams over the next month. By the end of the month, schedule a session to present the results of the experiments and updated concepts. Plan more experiments or next steps after that time period is up.
Experimentation represents larger commitment from the organization. It is a mindset shift—from delivering products and services to discovering about new ones. In this sense, mapping experiences is a catalyst for change. It helps you to shift perspectives from inside-out to outside-in and lets you become a grass roots strategic contributor within the organization.
RAPID MAPPING AND DESIGN WORKSHOP
MURAL is a leading virtual whiteboard for design collaboration. It’s a cloud-based service that lets you work visually online, from wherever you are. I joined the MURAL team in March 2015. We used our own product to examine the onboarding experience of MURAL and make
improvements. To do this, we held a one-and-a-half–day workshop in Buenos Aires with a group of eight people with different roles. The workshop had three parts.
Part 1: Empathize
The aim was to first understand the user’s experience. To do this, I mapped out elements of the experience using MURAL in advance of the session (Figure 1-24) There were three main sections to mural I created:
Value chain (upper left)
To understand the flow of value, I mapped the customer value chain. This provides an overview of the actors involved and their relationships to one another.
Proto-Personas
In the upper right of Figure 1-24, you’ll see three proto-personas. These were based on the actors in the value chain diagram. Sophia, the design lead, was our primary persona for this exercise.
Experience Map
As a group, we discussed each of these elements to understand the broader experience. The digital format of the diagram allowed us to add and update it on-the-fly. For instance, we added details to the proto-personas as we discussed them.
Figure 1-24. A combination of value chain, proto-personas, and experience all in one mural
Part 2: Envision
We then brainstormed about barriers to consumption. We asked, “What is keeping the primary persona from using our service repeatedly?”
Figure 1-25. The results of a design studio using MURAL
Part 3: Evaluate
After lunch the team broke into two groups. Each focused on consolidating the sketches into a single solution. Our aim was to create testable artifacts by the end of the day.
Using UserTesting, an online, unmoderated, remote testing service, we quickly got feedback on our proposed solutions. The tests ran overnight, and by the next morning we had initial results. Some of our assumptions were validated, others were disproven. We took the test feedback and iterated the proposed designs. In a final step, we created a concrete plan for implementation.
Conclusion
This rapid approach allowed us to go from understanding the experience, to prototyping, to testing, in less than two days. There were no written proposals, reports, or other documents. Experience mapping does not have to be a lengthy process. Using an online tool like MURAL allowed us to combine elements in one place for a better overview. Creating the experience map online also made the process ongoing rather than a one-time event. We were able to loop in others who were not present at the workshop, regardless of where they were located.
Steve Jobs in a town hall at Apple, 1997.
1
Theodore Levitt, “Marketing Myopia”, Harvard Business Review (1960). Mark Benioff, “A Call for Stakeholder Activists”, Huffington Post (2015).
Michael Porter and Mark R. Kramer, “Creating Shared Value”, Harvard Business Review (Jan 2011).
For example, Steve Denning’s article “The Copernican Revolution In Management”, Forbes (2013). Dave Gray et al, Gamestorming (O’Reilly, 2010).
Richard Banfield, C. Todd Lombardo & Trace Wax. Design Sprint (O’Reilly, 2015). Jake Knapp. Sprint (Simon & Schuster, 2016).
Eric Reis, Lean Startup (O’Reilly, 2011). Ash Maurya, Running Lean (O’Reilly, 2012). Jeff Gothelf, Lean UX (O’Reilly, 2013).
Michael Schrage, The Innovator’s Hypothesis (MIT Press, 2014).
2
3
4
5
6
7
8
9
10
11
About the Author
Jim Kalbach is a noted author, speaker, and instructor in user experience design, information
architecture, and strategy. He is currently the Head of Customer Success at MURAL, a leading visual online workspace for remote collaboration.
Jim has worked with large companies, such as eBay, Audi, SONY, Elsevier Science, LexisNexis, and Citrix. Before returning to the US in 2013 after living in Germany for fifteen years, Jim was the
cofounder of the European Information Architecture conferences. He also cofounded the IA Konferenz series in Germany.
Jim plays jazz bass in jam sessions and combos in Jersey City, where he currently lives. In 2007 Jim published his first full-length book with O’Reilly, Designing Web Navigation. His second book, Mapping Experiences, was released in December 2015. He blogs at experiencinginformation.com