IMPACTS OF FERTILIZER APPLICATION ON SOIL PROPERTIES
AT KAHAROLE UPAZILA OF DINAJPUR DISTRICT IN BANGLADESH
Dhurbo Ronjon Roy 1), Md. Sirajul Islam 1*), Bikash Chandra Sarker 2), Tanmoy Roy Tusher 1), Md. Humayun Kabir 1), Muliadi 3) and Shamim Al Mamun 4)
1) Department of Environmental Science and Resource Management Mawlana Bhashani Science and Technology University, Tangail-1902, Bangladesh
2) Department of Agricultural Chemistry, Hajee Mohammad Danesh Science and Technology University Dinajpur-5200, Bangladesh
3) Department of Chemistry, Khairun University P.O. Box. 97719, Ternate, Indonesia
4) Department of Soil and Physical Sciences, Faculty of Agricultural and Life Sciences, Lincoln University P.O. Box. 7647, Lincoln 7647, New Zealand
*) Corresponding author E-mail: [email protected]
Received: October 26, 2015/ Accepted: February 12, 2016
ABSTRACT
The study was conducted to investigate the impacts of fertilizer application on soil properties in Kaharole upazila of Dinajpur district in Bang-ladesh. Samples were collected to analyze the variation of soil nutrients in three cropping seasons: season-1 (March-April, 2013), season-2 (August-September, 2013) and season-3 (January-February, 2014). In each season 10 samples, 6 from conventionally cultivated soil (CCS) and 4 from organic fertilized soil (OFS), were collected from 10 randomly selected sampling points. The study observed acidic soil pH in all three cropping seasons, while soil pH was decreasing gradually with fertilizer application. The results of the study clearly depicted that all the soil nutrient contents and OM decreased with the application of fertilizers in different cropping seasons except Zn and Fe. The OFS contains relatively higher amount of OM and essential nutrients than CCS except Fe and Zn. The study shows that the continuous application of fertilizer in agricultural lands reduces soil fertility evolving nutrient deficiency in the soil; resulting in reduced crop productivity.
Keywords: conventionally cultivated soil; cropping seasons; organic fertilized soil; soil nutrients
INTRODUCTION
Fertilizer is considered to be one of the main inputs for increasing crop yields and farm profit for any country but balanced fertilization is the key to efficient fertilizer use for sustainable
high yields (Chakrabarty et al., 2014). Most fertile-izers used in agriculture contained three basic plant nutrients: nitrogen (N), phosphorus (P) and potassium (K). Some fertilizers also contain certain micronutrients such as zinc and other metals that are necessary for plant growth (EPA, 2015). Soil quality mainly depends on the response of soil to different land use systems and management practices, which may often modify the soil properties and hence soil productivity (Gurumurthy et al., 2009). Excessive use of readily available conventional chemical fertilizers for agricultural land is the main source of surface and ground water contamination (Thomsen et al., 1993). In the worst cases, soil nutrients drop below critical levels, causing land to become infertile and then abandoned (McArthur and McCord, 2014). Most soil in Bangladesh have been identified to experince severe deficiency of nutrients like N, P and K. Because of the increasing use of chemical fertilizer on agriculture land, providing changes have occurred on the agriculture yield (Islam and Hossain, 1993). Indeed the dependency on chemical fertilizers instead of organic fertilizers for crop production is increasing day by day, resulting in the reduction of soil fertility.
All living bacteria inside the soil surface provides potential benefits for cropping but currently the use of chemical fertilizer are playing an important role in the loss of land. There are many factors that contribute to land degradation due to fertilizers (Crawford et al., 2006). Chemical fertilizers are not normally integrated with organic manures. It is, thus, evident that farmers virtually do not use balanced fertilizers that are necessary
Cite this as: Roy, D.R., Md.S. Islam, B.C. Sarker, T.R. Tusher, Md.H. Kabir, Muliadi and S. Al Mamun. 2016. Impacts of fertilizer application on soil properties At kaharole upazila of dinajpur district in Bangladesh. AGRIVITA Journal of Agricultural Science. 38(2): 116-125. Doi: 10.17503/agrivita.v38i2.702
Accredited : SK No. 81/DIKTI/Kep/2011
for high productivity (Rahman, 2014).Today, agriculture activities, by using chemical fertilizers creates negatives impacts on soil fertility because of the long-term resistance the ecosystem has on pesticide which results in the loss of beneficial organisms, earthworm, micro-organism, and other species (Setboonsarng, 2006). Under these circumstances the study was conducted in Kaha-role upazila under Dinajpur district where people are not aware about their activities in agricultural lands, and the land is only used for one time cultivation or mono paddy cultivation in that region because of high agricultural density. The farmers are not concerned about the sound soil quality, soil nutrient status and environmental degradation. The objective of the study was as follows: (i) to investigate the properties of soil at different cropping seasons, and (ii) to assess the impacts of fertilizers application on soil nutrient status.
MATERIALS AND METHODS
The study was conducted in the four remote villages namely Chatoli, Mallikpur, Katna and Nirmoliof the Kaharoleupazila under Dinajpur district of Bangladesh. The Kaharole upazila oc-cupies an area of 205.53 km2 and is located between 25°44' and 25°53' N latitudes and between 88°30' and 88°43' E longitudes. Main crops of the area are paddy, jute, wheat, maize, sugarcane, pulse, potato and oil seed, but Aus paddy is nearly extinct in the area (Banglapedia, 2006).
A total of 30 soil samples, with a depth of 0-15 cm, were collected in three cropping seasons
mentioned as 1 (Mar-Apr, 2013), season-2 (Aug-Sep, season-2013) and season-3 (Jan-Feb, season-2014) during the month from January 2013 to February 2014. Simple random sampling procedure was applied and a total of 10 samples were collected in each cropping season from 10 sampling points of Mallikpur (S-1, S-2), Katna (S-3, S-4), Nirmoli (S-7, S-8) and Chatoli (S-5, S-6, S-9, and S-10) villages. Mallikpur, Katna and Nirmoli sampling points were conventionally cultivated soil (CCS) and Chatoli sampling point was organic fertilized soil (OFS), which means 6 samples were collected from CCS and 4 samples were from OFS in each season. To compare the status of soil fertility, both CCS and OFS samples were collected.
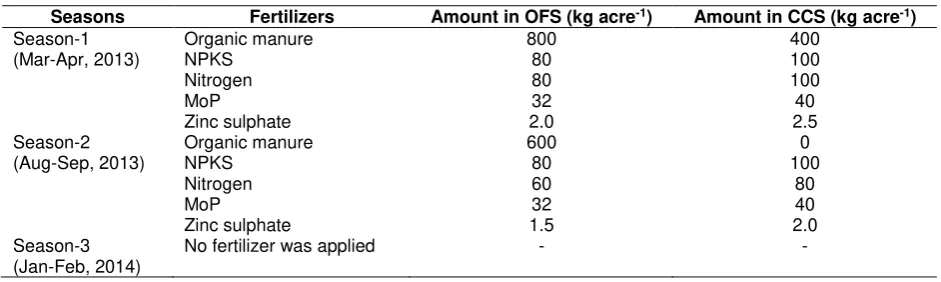
In season-1, samples were collected before the application of fertilizers to state the initial status of soil properties in the study area. After collecting the samples in season-1, fertilizers were applied on the land for crop cultivation according to the cultivation methods of local farmers. After harvesting the crop cultivated in season-1, the soils were again sampled at the beginning of season-2 and then fertilizers were applied for crop cultivation in season-2. In similar way, soil samples were collected again at the beginning of season-3 and no fertilizer was applied during this season. The amount of fertilizers applied in season-1 and 2 is given in Table 1.
The soil samples were placed in a thin layer on a clean piece of paper on a shelf in the room and left until it was air dry. Samples were then ground and passed through a 2 mm stainless steel sieve. Finally, the soil samples were kept in a clean polythene bag for chemical analysis.
Table 1. Amount of fertilizers applied during the study period
In the study, the pH was measured by Soil pH and Moisture Meter (ZD% PM 0909). The organic matter (OM) content was analyzed titri-metrically according to Walkley and Armstrong’s wet oxidation method (Walkley and Armstrong, 1934). Total nitrogen (N) content was determined by Semi-micro Kjeldahl method. Available phosphorus (P) was extracted from the soil by shaking with 0.03 M NH4F-0.025 M HCl solution at pH <7.0 following the method of Bray and Kurtz (1945). The samples were read with the help of a spectrometer at 660 nm wave length. Exchangeable potassium (K) in soil was determined by the extraction with ammonium acetate (CH3COONH4; pH = 7.0) by using flame photometer (Black et al., 1965) at the wave length of 766.5 to 769.5 nm. Available sulphur (S) was determined by extracting the soil samples by calcium dihydrogen phosphate ex-traction method. Calcium (Ca) was determined by soil extraction method by NOV AA-300 Atomic Absorption Spectrometer. Zinc (Zn) and Iron (Fe) were determined by DTPA extraction method using NOV AA-300 Atomic Absorption Spectro-meter. Boron (B) was determined by CaCl2 extraction method (Petersen, 2002).
RESULTS AND DISCUSSION
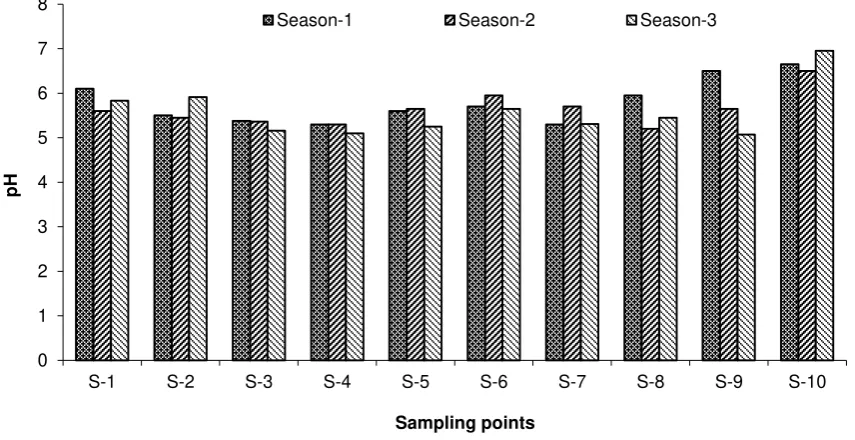
The study found that the soil pH was ranged from 5.30-6.65, 5.20-6.50 and 5.07-6.95 in season-1, 2 and 3, respectively (Figure 1).The average soil pH was found 5.81, 5.58 and 5.56 in season-1, 2 and 3, respectively. All kinds of crops are grown well in the range of 5.60 -7.30, because all types of essential nutrients are available in this range but hampered in lower pH (SRDI, 2005). Plants grown in acid soils can experience a variety of symptoms including manganese (Mn) toxicity as well as nutrient deficiencies (Brady and Weil, 2002). The result of the study revealed that soil pH is decreasing gradually due to fertilizer application in the study area. However, the soil pH of the study area remains suitable for paddy and other types of crop cultivation.
The organic matter (OM) content was ranged from 0.85-1.30, 0.65-1.65 and 0.72-1.53% in season-1, 2 and 3, respectively (Figure 2). Cooperband (2002) found that soil contains about 1-6% OM was suitable for crop cultivation, while BARC (2005) revealed that a good soil should have at least 2.5% OM. The study revealed that the soil of the study area contained less amount of OM, which may hamper the regular crop production in near future.
Figure 1. The soil pH at different sampling points in three cropping seasons 0
1 2 3 4 5 6 7 8
S-1 S-2 S-3 S-4 S-5 S-6 S-7 S-8 S-9 S-10
Season-1 Season-2 Season-3
Sampling points
Figure 2. The OM contents of soil at different sampling point in three cropping seasons
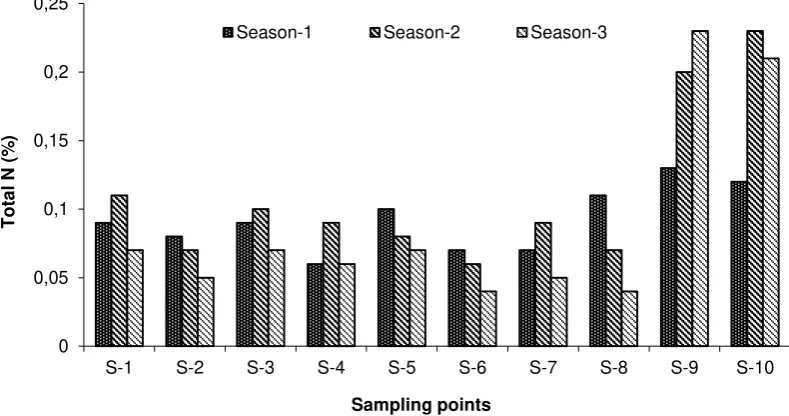
Figure 3. Total N contents at different sampling points in three cropping seasons
The average OM was observed 1.083, 1.047 and 0.979% in season-1, 2 and 3, respectively. According to Jahiruddin and Satter (2010), OM content in Bangladesh soils is in decreasing trend. Similar trend was also observed in the study area, though OFS samples exhibiting compar-atively higher OM content in the end of
season-3 (Figure 2). Steady supply of OM is, therefore, essential in the study area to maintain soil fertility because it is the key factor in main-taining long term soil fertility.
The total nitrogen (N) content was ranged from 0.06-0.13, 0.06-0.23 and 0.04-0.23% in season-1, 2 and 3, respectively (Figure 3). The 0
0,2 0,4 0,6 0,8 1 1,2 1,4 1,6 1,8
S-1 S-2 S-3 S-4 S-5 S-6 S-7 S-8 S-9 S-10
Season-1 Season-2 Season-3
Sampling points
O
M
c
on
te
nt
(%
)
0 0,05 0,1 0,15 0,2 0,25
S-1 S-2 S-3 S-4 S-5 S-6 S-7 S-8 S-9 S-10
Season-1 Season-2 Season-3
Sampling points
Tota
l
N
(%
total N content in soil is being less when the pH is less than 6 and higher than 8, that is, total N in soil is being available when the soil pH range from 6-8 (SRDI, 2005). The study exhibited the similar pattern of correlation between observed soil pH and total N content in the study area. The average total N content was found 0.09, 0.11 and 0.09% in season-1, 2 and 3, respectively, which indicated that the study area was in critical stage because the standard level of total N in soil is 0.32% and the critical value was 0.12% (BARC, 2005). The total N content in OFS remains higher than that of in CCS after season-3 because OM is one of the important source of nitrogen in the soil and concentration of total N in organic fertilizer ranged from 1.15-1.76% (Anggria et al., 2012). Thus, it is recommended to use organic fertilizer in the study area as much as possible to avail the N as well as OM in the soil.
The exchangeable potassium (K) content in the experimental area ranged from 0.07-0.30, 0.08-0.25 and 0.09-0.27 meq 100g-1 in season-1, 2 and 3, respectively (Figure 4).The average value of K content was found 0.150, 0.136 and 0.141 meq 100g-1 in season-1, 2 and 3, respectively. In the lower pH (>6), the availability of exchangeable K is decreased (SRDI, 2005), which supports the findings of the present study. Wang and Huang (2001) depicted that soil OM is one of the most important cation exchange capacity contributors in soil systems and the addition of OM in agricultural land resulted in the increase of K concentration in soil. The result depicted that the level of K in CCS is relatively lower than the OFS in the end of season-3 (Figure 4).
Figure 4. The K content of soil at different sampling points in three cropping seasons
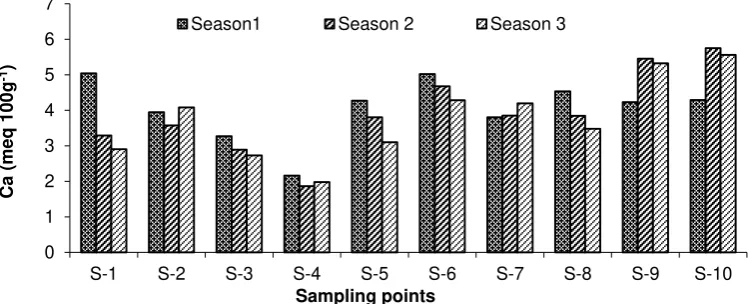
Figure 5. The Ca contents of soil at different sampling points in three cropping seasons 0
0,05 0,1 0,15 0,2 0,25 0,3 0,35
S-1 S-2 S-3 S-4 S-5 S-6 S-7 S-8 S-9 S-10
Season1 Season 2 Season 3
Sampling points
Potas
si
um
(me
q
10
0g
-1)
0 1 2 3 4 5 6 7
S-1 S-2 S-3 S-4 S-5 S-6 S-7 S-8 S-9 S-10
Season1 Season 2 Season 3
Ca
(m
e
q
100g
-1)
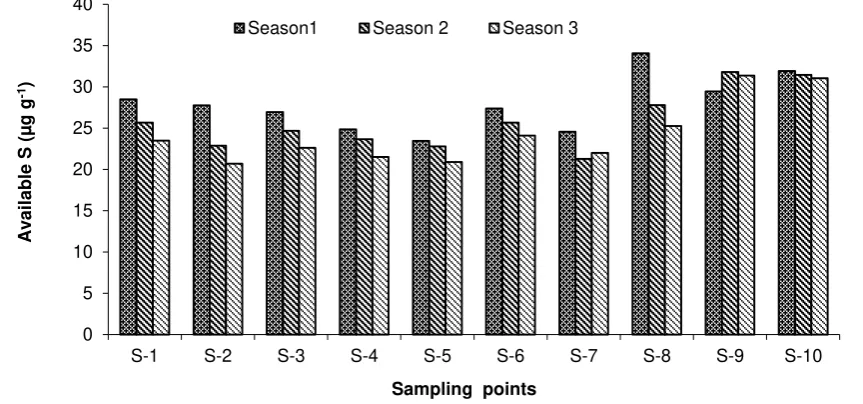
Figure 6. The available S contents at different sampling points in three cropping seasons The exchangeable Ca content was ranged
from 2.16-5.04, 1.86-5.75 and 1.98-5.56 meq 100g-1 in season-1, 2 and 3, respectively. According to BARC (2005), the ideal value of Ca for crop higher level of Ca than CCS except few points in all three seasons (Figure 5). The availability of exchangeable Ca content is increased within a pH of 6-8 but below 6 and above 8, the availability Ca is decreased (SRDI, 2005). Similar correlation is also obvious from the present study.
The observed available sulphur (S) content in season-1, 2 and 3 was ranged from 23.45-34.05, 21.28-31.8 and 20.7-31.35 µg g-1, respec-tively, while the average value of available S content was found 27.79, 25.76, 24.29 µg g-1, respectively (Figure 6). The standard value of available S for crop cultivation is 31.5 µg g-1 and the critical value is 10 µg g-1 (BARC, 2005). Portch and Islam (1984) reported that 68% soils of Bangladesh contained S below critical level and 14% below the optimum level. The result revealed that most of the samples contained the lower level of S than the standard value but not critical in different cropping seasons. Only two OFS sites showed optimum level of available S content in all three seasons because S deficiency is less when OM added in soil due mineralization of S
from organic matter. The study clearly depicted that the application of fertilizer gradually decreases the availability of Ca and available S contents in the soil.
The available phosphorus (P) content was ranged from 15.95-21.6, 12.65-20.75 and 14.65-20.25 µg g-1 in season-1, 2 and 3, respectively (Figure 7). BARC (2005) reported that available P status of Bangladesh varies ranging from very low (<7.5 µg g-1) to very high (>37.5 µg g-1), while most of the soil P status falls between low (7.5-15.0 µg g-1) and medium (15.1-22.5 µg g-1). In the lower pH, the availability of P is reduced due to the presence of Fe and the P is replaced by Fe (SRDI, 2005). BARC (2005) reported that the standard level of P for crop cultivation was 21 µg g-1 when the critical value was 5 µg g-1. The result depicted that the higher amount of average available P was observed in season-1 though lower than the standard level but the critical value. The variation in available P level from season-1 to season-3 was relatively less in OFS than CCS; because of natural decomposition of OM in soil provides increasing concentration of P in farm land (Brussaard, 1994).
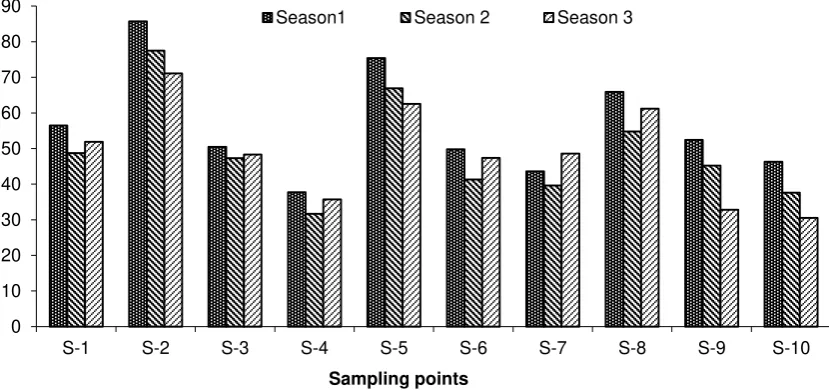
The iron (Fe) content was ranged from 37.74-85.7, 31.65-77.5 and 30.5-71.1 µg g-1 in season-1, 2 and 3, respectively, while the average value of Fe content was found 56.38, 49.05 and 49.0 µg g-1, respectively (Figure 8). The suitable Fe content in soil for crop production is 9.1-12.0 µg g-1 (SRDI, 2001). SRDI (2005) reported that higher 0
Season1 Season 2 Season 3
pH level reduces the availability of Fe in soil and in lower pH (< 6.0) the level of Fe is increased. Since the result of the study showed a lower pH in all samples, the higher concentration of Fe was found in soil. However, in case of OFS, the level
of the Fe reduced because of the increased pH (> 6.0) found in the OFS (Figure 1). Thus, the study revealed that the concentration of Fe is lower in the OFS than the concentration in CCS.
Figure 7. The available P contents at different sampling points in three cropping seasons
Figure 8. The Fe contents of soil at different sampling points in three cropping seasons 0
5 10 15 20 25
S-1 S-2 S-3 S-4 S-5 S-6 S-7 S-8 S-9 S-10
Season1 Season 2 Season 3
A
v
a
il
a
bl
e
P
(µ
g
g
-1)
Sampling points
0 10 20 30 40 50 60 70 80 90
S-1 S-2 S-3 S-4 S-5 S-6 S-7 S-8 S-9 S-10
Season1 Season 2 Season 3
Sampling points
Iron
(µ
g
g
Figure 9. The Zn contents of soil at different sampling points in three cropping seasons
Figure 10. The concentration B at different sampling points in three cropping seasons
The zinc (Zn) content was ranged from 0.69-1.49, 0.98-1.91 and 1.03-1.84 µg g-1 in season-1, 2 and 3, respectively. The average value of Zn con-tent was 1.21, 1.57 and 1.49 µg g-1 in season-1, 2 and 3, respectively (Figure 9). The SRDI (2005) reported higher pH reduce the availability of Zn in soil. BARC (2005) reports the standard level of Zn for crop cultivation is 1.25 µg g-1 when the critical
value is 0.6 µg g-1. The study found relatively optimum level of Zn in soil.
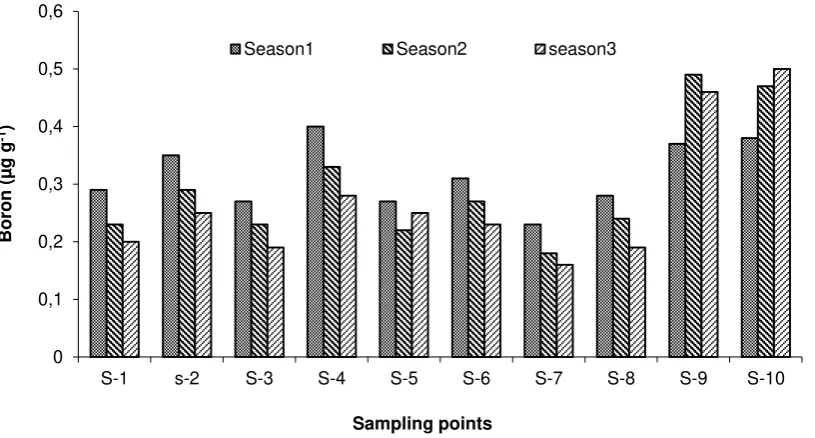
Besides of these, the boron (B) content was ranged from 0.23-0.4, 0.18-0.49 and 0.16-0.5 µg g-1 in season-1, 2 and 3, respectively, while the average value of B content was found 0.31, 0.29 and 0.27 µg g-1, respectively (Figure 10). The standard level of B for crop cultivation is 0.53 0
0,5 1 1,5 2 2,5
S - 1 S - 2 S - 3 S - 4 S - 5 S - 6 S - 7 S - 8 S - 9 S - 10
Season-1 Season-2 Season-3
Sampling points
Zi
nc
(µ
g
g
-1)
0 0,1 0,2 0,3 0,4 0,5 0,6
S-1 s-2 S-3 S-4 S-5 S-6 S-7 S-8 S-9 S-10
Season1 Season2 season3
Boron
(µ
g
g
-1)
µg g-1 when the critical value is 0.2 µg g-1 (BARC, 2005). The most B deficient areas are Dinajpur, Rangpur, Bogra, Sirajgonj, Comilla and Sylhet (SRDI, 2005). All of the samples except two OFS sites (S-9 and S-10) represented the lower concentration of B in soil in all three cropping seasons (Figure 10). The availability of increased concentration of B in OFS may be due to the continuous application of organic fertilizer in soil (Lucas and Davis, 1961).
CONCLUSION
The study concluded that the application of fertilizers in different cropping seasons negatively affects the soil properties as well as nutrient status of the study area. The study revealed acidic soil pH in all cropping seasons and the acidity of soil is increasing gradually. Higher amount of soil nutrients (N, K, Ca, Mg, S, P, Zn and B) including OM was observed in season-1, whereas the lowest was observed in season-3 except Fe and Zn which clearly depicted the impacts of fertilizer application. Nevertheless, less impact was observed in OFS which contains relatively higher amount of soil nutrients than CCS. The study, therefore, recommended that optimum use of organic fertilizer can make the study area soil suitable for better crop productivity.
ACKNOWLEDGEMENTS
Sincere gratitude to Md. Mamunur Rashid, Chief Scientific Officer, Soil Resource Develop-ment Institute (SRDI), District office, Dinajpur for his cordial cooperation throughout the study period.
REFERENCES
Anggria, L., A. Kasno and S. Rochayati. 2012. Effect of organic matter on nitrogen min-eralization in flooded and dry soil. ARPN Journal of Agricultural and Biological Science 7 (8): 586-590.
Banglapedia. 2006. Kaharole Upazila (in Bengali). Bangladesh: National Encyclopedia of Bangladesh. http://en.banglapedia.org/in dex.php?title=Kaharole_Upazila.Access ed on August 13, 2014.
BARC. 2005. Fertilizer recommendation guide. BARC Soils Publication No. 45. Dhaka: Bangladesh Agricultural Research Council. p. 270.
Black, C.A., D.D. Evans, J.L. White, L.E. Ensminger, F.E.Clark and R.C. Dinauer. 1965.
Methods of soil analysis, Part 2: Chemical and microbiological properties. Wisconsin: American Society of Agrono-my Publisher. p. 67.
Brady, N.C. and R.R. Weil. 2002. The nature and properties of soils, 13th edition. New Jersey: Prentice Hall. p. 960.
Bray, R.H. and L.T. Kurtz. 1945. Determination of total, organic and available forms of phosphorus on soils. Soil Science 59 (1): 39-46.
Brussaard, L. 1994. Interrelationships between biological activities, soil properties and soil management. In: Soil resilience and sustainable land use. D.J. Greenland and I. Szabolcs (eds.). Terrestrial Ecology and Nature Conservation pp. 309-329. Chakrabarty, T., S. Akter, A.S.M. Saifullah, Md.S.
Sheikh and A.C. Bhowmick. 2014. Use of fertilizer and pesticide for crop production in agrarian area of Tangail district, Bang-ladesh. Environment and Ecology Research 2 (6): 253-261. doi: 10.13189/ eer.2014.020605
Cooperband, L. 2002. Building soil organic matter with organic amendments: A resource for urban and rural gardeners, small farmers, turfgrass managers and large-scale producers. Center for Integrated Agricultural Systems. Wisconsin: University of Wiscon-sin-Madison. p. 16.
Crawford, E.W., T.S. Jayne and V.A. Kelly. 2006. Alternative approaches for promoting fertilizer use in Africa. Agriculture and Rural Development Discussion Paper 22. Washington: The World Bank. p. 88. EPA. 2015. Agriculture: Nutrient management
and fertilizer. Environmental Protection Agency. www2.epa.gov/agriculture/agri culture-nutrient-management-and-fertilizer. Accessed on October 5, 2015. Gurumurthy, K.T., M.K. Kumar and H.C. Prakasha.
2009. Changes in physico chemical properties of soils under different land use systems. Karnataka Journal of Agricul-tural Sciences 22 (5): 1107-1109.
Islam, M.R. and A. Hossain. 1993. Influence of additive nutrients on the yield of BR11 rice. Thai Journal of Agricultural Science 26 (3): 196-199.
resource management. Bangladesh: Bangladesh Agricultural Research Coun-cil and Bangladesh Agricultural University. p. 56.
Lucas, R.E. and J.F. Davis. 1961. Relationships between pH values of organic soils and availabilities of 12 plant nutrients. Soil Science 92 (3): 177-182.
McArthur, J. and G.C. McCord. 2014. Fertilizing growth: Agricultural inputs and their effects in economic development. Global Eco-nomy and Development: Working Paper 77. Washington: Brookings. p. 48. Petersen, L. 2002. Analytical methods - soil, water,
plant material and fertilizer. Soil Resources Management and Analytical Services. Dhaka: Soil Resource Division, Institute Danida. pp. 21-24.
Portch, S. and M.S. Islam. 1984. Nutrient status of some of the more important agricultural soils of Bangladesh. In: Proceedings of the International Symposium on Soil Test Crop Response Studies. Dhaka: Bangla-desh Agricultural Research Council and Soil Science Society of Bangladesh. pp. 97-106.
Rahman, M.F. 2014. Access to agricultural financing: The experience of ASA, Bangladesh. Presented at the Sessions: Financing and Investing in Agricultural Innovation and Technology. August 22, 2014. Bangladesh. p. 40.
Setboonsarng, S. 2006. Organic agriculture, poverty reduction, and the millennium develop-ment goals. ADB Institute Discussion Paper No. 54. Phnom Penh: Asian Development Bank Institute. p. 28. SRDI. 2001. Land and soil resources utilization
guide (in Bengali). Upazila Nirdeshika series. Dhaka: Soil Resources Development Institute. p. 73.
SRDI. 2005. Land and soil resources utilization guide (in Bengali). Upazila Nirdeshika series. Dhaka: Soil Resources Development Institute. pp. 45-63. Thomsen, I.K., J.F. Hansen, V. Kjellerup and B.T.
Christensen. 1993. Effects of cropping system and rates of nitrogen in animal slurry and mineral fertilizer on nitrate leaching from a sandy loam. Soil Use and Management 9 (2): 53-57. doi: 10.1111/ j.1475-2743.1993.tb00929.x
Walkley, A. and B.I. Armstrong. 1934. An exam-ination of the degtjareff method for deter-mining soil organic matter, and a pro-posed modification of the chromic acid titration method. Soil Science 37 (1): 29-38.