Ž .
Aquaculture 186 2000 311–326
www.elsevier.nlrlocateraqua-online
Replacement of fish meal in diets for Australian
silver perch, Bidyanus bidyanus
III. Digestibility and growth using meat
meal products
David A.J. Stone
a, Geoff L. Allan
a,), Scott Parkinson
a,
Stuart J. Rowland
b aNSW Fisheries, Port Stephens Research Centre, Taylors Beach NSW 2316, Australia
b
NSW Fisheries, Grafton Research Centre, PMB 3, Grafton NSW 2460, Australia
Accepted 30 November 1999
Abstract
Apparent digestibility and availability coefficients for beef and bone meal, lamb and bone
Ž .
meal, a high protein meal from mixed species mixed meat meal, reduced ash, no bones and from Provinew
, a high protein meal based on selected ingredients, were determined for juvenile silver perch. Experimental diets comprised a reference diet plus meat meal products at either 15% or 30% inclusion. Silver perch readily accepted diets with up to 30% meat meal. Digestibility coefficients for dry matter, energy, protein, and availability coefficients for amino acids were determined to assist with the formulation of diets to assess growth of silver perch. Digestibility coefficients for dry matter, energy, and protein all increased with increasing protein content in the meat products. Average amino acid availability coefficients were highest for the mixed meat meal and Provinew
. Availability coefficients for alanine, arginine, glycine, methionine, proline and serine were all significantly higher for these products than for either beef or lamb meal. Availability of sulphur amino acids was significantly lower in Provinew
than in other products. Compared with fish meal, all meat products contained less lysine and some meat products were also low in phenylalanine, isoleucine, and histidine. An increase in total protein content, through removal of bone, improved the nutritional value of meat meal in silver perch diets.
)Corresponding author. Tel.:q61-249-821232; fax:q61-249-821107.
Ž .
E-mail address: [email protected] G.L. Allan .
0044-8486r00r$ - see front matterq2000 Elsevier Science B.V. All rights reserved.
Ž .
Juvenile silver perch were grown for 65 days in 10 000-l tanks, using one of five diets with similar digestible nitrogen, energy, and dry matter but different contents of fish meal, lamb meal, and Provinew
. Fish growth was reduced when diets contained less than 13% fish meal and more
w
Ž . than 9% Provine . However, feed conversion efficiency and protein retention efficiency PRE were unaffected by diet formulation. These results indicate that meat meal can replace most of the fish meal in silver perch diets without reducing fish performance.q2000 Elsevier Science B.V.
All rights reserved.
Keywords: Bidyanus bidyanus; Digestibility; Nutrient availability; Growth; Meat meal
1. Introduction
Fish meal replacement in aquaculture diets is recognised as a major international
Ž .
research priority Manzi, 1989; New, 1991; Tacon, 1994 and many dietary development
Ž
studies using different species and ingredients have already been conducted Tacon,
.
1994 . The majority have investigated the potential of soybean products to replace fish
Ž
meal because of the excellent amino acid profile of soybeans see review by Tacon,
.
1994 . Other studies have investigated a range of different products including rapeseed
Ž .
meal, cottonseed meal Tacon, 1994 , mustard oil cake, linseed and sesame meals
ŽHossain and Jauncey, 1989a,b , and other less common vegetable proteins Tacon,. Ž .
1994 .
Ž
Previous studies with meat meal products Lovell, 1992; Shimeno et al., 1993a,b,
.
1996; Tacon, 1994 have been generally positive with respect to fish meal replacement. In Australia, meat meal and meat products may have potential to replace significant
Ž .
quantities of fish meal in aquaculture feeds Allan, 1997 . On a cost per unit protein basis, meat meal is an attractive protein source for most farmed finfish and aquatic invertebrates. Well-rendered meat meal has few anti-nutrients and does not contain significant quantities of indigestible carbohydrates, which can restrict the use of plant protein sources.
In Australia, meat meal is in good supply with 480 000 t of meat meal produced in
Ž .
1991–1992 Australasian Agribusiness Services, 1993 and 475 000 t produced for
Ž
1995–1996 Personal communication, Graeme Banks, Australian Renderers Association,
.
1998 .
Silver perch is an omnivorous, native Australian freshwater finfish currently being
Ž
cultured in static ponds in Australia Rowland and Barlow, 1991; Rowland et al., 1994,
.
1995 . They readily accept pelleted diets, tolerate crowded conditions, and perform well
Ž .
in earthen ponds with low net water exchange Rowland et al., 1994, 1995 .
Ž .
The aim of this study was to determine the apparent digestibility coefficients ADCs
Ž .
for dry matter, energy, nitrogen and the apparent availability coefficients AACs for essential amino acids for four different meat meals in diets for silver perch. These results were used to formulate five diets with similar digestible energy, protein and available essential amino acids profiles but where fish meal was progressively replaced by a combination of beef and lamb meal and Provinew
( )
D.A.J. Stone et al.rAquaculture 186 2000 311–326 313
2. Materials and methods
2.1. Experimental diet preparation
Ž .
All ingredients were ground using a hammer mill C-E Raymond, IL, USA or sieved to ensure all particles passed through a 710-mm screen. Dry ingredients were thoroughly
Ž .
mixed in a Hobart mixer Troy, OH, USA then combined with approximately 400 ml
y1 Ž
distilled water kg dry mix before being cold pelleted through a meat mincer Barnco
. Ž .
Australia, Leichhardt, NSW, Australia with a 2 mm die Experiment 1 or 2 and 3 mm
Ž .
die Experiment 2 . Pellets were dried at 358C in a convection drier for approximately 6 h until the moisture content was between 10% and 15%, to produce a dry, sinking pellet.
2.2. Experimental fish and water quality
Ž . Ž
Silver perch Bidyanus bidyanus Experiment 1, mean weight"SEM: 6.2"0.3 g
.
and Experiment 2, mean weight: 12.1"0.1 g were bred at the Grafton Research Centre and raised in earthen ponds using similar techniques to those described by Thurston and
Ž . Ž .
Rowland 1995 . Before the experiments, fish were fed SP35 Allan and Rowland, 1992 and were treated with 5 g ly1 NaCl to ensure they were free of ectoparasites and to
Ž .
prevent fungal infection Rowland and Ingram, 1991 .
Prior to stocking, fish were anaesthetised using a bath of ethyl r-aminobenzoate
ŽExperiment 1, 25 mg ly1 for 5 min or Experiment 2, 50 mg ly1 for 3 min then caught.
Ž .
at random, weighed Experiment 1, individually or Experiment 2, in groups of 5 or 10 and distributed among tanks by systematic interspersion. Fish were also weighed at harvest using the same technique.
Ž .
During both experiments, water temperature range 24.3–26.78C , dissolved oxygen
Žabove 5.0 mg ly1., pH between 7.2 and 8.3 were measured weekly using a Yeo-KalŽ .
Ž .
611 water quality analyser Yeo-Kal Electronics, Brookvale, Sydney, NSW Australia .
Ž y1 y1 y1
Nitrite and ammonia -0.55 mg l NO -N l2 and -0.6 mg l total ammonia-N
y1 .
l , respectively were measured weekly using colourmetric methods described by
Ž . Ž .
Major et al. 1972 and Dal Pont et al. 1973 .
2.3. Biochemical analyses
All chemical analyses were done in duplicate. Feed, faecal and fish samples were
Ž .
analysed for dry matter, ash, crude fat, and energy bomb calorimetry by the AOAC
Ž1990 procedures. Nitrogen was determined by the method of Havilah et al. 1977. Ž . Žcrude proteinsN=6.25 . Amino acids were determined by the method of Cohen et al.. Ž1989 and analysed following acid hydrolysis using high pressure liquid chromatogra-.
Ž .
phy and Waters Pico-Tag Waters, Lane Cove, NSW, Australia . Sulphur amino acids were determined separately following performic acid digestion, and tryptophan, which is
Ž .
lost during acid hydrolysis Cohen et al., 1989 , was not analysed. Chromic oxide was
Ž .
2.4. Experiment 1, digestibility and aÕailability
Ž . Ž .
Four meat products, beef and bone meal B , lamb and bone meal L , mixed meat
Ž . Ž . w
meal reduced ash, no bones M , and Provine , were evaluated in this experiment
ŽTable 1 . The other components of experimental diets Table 2 were SP35 at about. Ž . Ž
. Ž .
70% or 85% inclusion and chromic oxide 1% was used as an inert marker. SP35 was also the control diet.
Ž .
Digestibility tanks were 170-l cylindro-conical tanks conical base sloped at 358.
Ž .
Their design and operation are described by Allan et al. 1999 .
Ž y1.
Fish were stocked 8 fish tank 7 days before faeces were collected to allow for acclimatisation to experimental conditions. For 4 days, fish were fed SP35 and then 3 days before faeces were collected, fish were fed their respective experimental diets. Fish
Ž y1.
were fed to excess 10% body weight day using automatic conveyor belt-type feeders
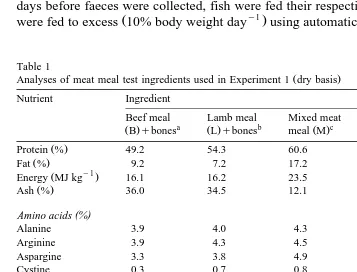
Table 1
Ž .
Analyses of meat meal test ingredients used in Experiment 1 dry basis
Nutrient Ingredient
w
Beef meal Lamb meal Mixed meat Provine Peruvian
a b c d e
Ž .Bqbones Ž .Lqbones meal MŽ . Ž .P fish meal
Ž .
Protein % 49.2 54.3 60.6 81.0 70.2
Ž .
Fat % 9.2 7.2 17.2 10.4 11.3
y1
Ž .
Energy MJ kg 16.1 16.2 23.5 25.7 20.9
Ž .
Ash % 36.0 34.5 12.1 3.0 17.6
( ) Amino acids %
Alanine 3.9 4.0 4.3 5.3 4.6
Arginine 3.9 4.3 4.5 6.8 5.1
Aspargine 3.3 3.8 4.9 6.9 6.2
Cystine 0.3 0.7 0.8 1.1 0.7
Glutamine 5.7 7.0 7.9 9.9 9.4
Glycine 7.7 6.7 6.6 7.9 4.8
Histidine 0.8 1.2 1.2 1.6 2.3
Isoleucine 1.3 1.8 2.1 3.7 3.5
Leucine 2.7 3.5 4.3 6.2 5.3
Lysine 2.5 3.5 3.7 4.9 5.5
Methionine 0.7 1.1 1.1 1.6 2.0
Phenylalanine 1.5 1.9 2.3 3.4 2.9
Proline 5.0 4.6 4.5 5.2 3.5
Threonine 1.6 2.1 2.6 3.6 3.2
Tyrosine 1.1 1.5 1.9 3.0 2.3
Serine 2.1 2.4 3.0 3.6 3.0
Valine 2.0 2.4 3.0 4.3 3.7
a
Supplied by Beef City, Toowoomba QLD, Australia.
b
Supplied by Fletcher International, Dubbo NSW, Australia. After lamb meal was used in the growth experiment at GRC, Fletchers International raised the price of lamb meal to)$799rt as a new export market was identified for this product.
c
Supplied by Midco, Maxwell NSW, Australia.
d
Supplied by Aspen Technology, Preston VIC, Australia.
e
( )
D.A.J. Stone et al.rAquaculture 186 2000 311–326 315
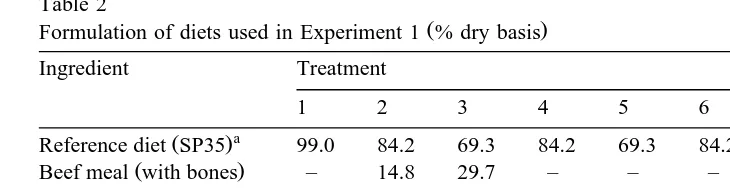
Table 2
Ž .
Formulation of diets used in Experiment 1 % dry basis
Ingredient Treatment
1 2 3 4 5 6 7 8 9
a
Ž .
Reference diet SP35 99.0 84.2 69.3 84.2 69.3 84.2 69.3 84.2 69.3
Ž .
Formulation and composition of SP35 described in Table 3.
for 3 h each day from 0830 to 1130 h. Faecal samples were collected by settlement as
Ž .
described by Allan et al. 1999 .
Ž .
The indirect method of Cho and Kaushik 1990 was used to calculate apparent
Ž . Ž .
digestibility or availability coefficients, with chromic oxide 1% dry basis as the inert indicator. The ADCs for energy, protein and the AACs for essential amino acids in
Ž .
experimental diets were calculated as described by Cho and Kaushik 1990 . Then,
Ž .
apparent digestibility % for dry matter, protein and energy, and apparent availability
Ž .% for amino acids for test ingredients were calculated using the methods described by
Ž .
Sugiura et al. 1998 .
2.5. Experiment 2, growth
Using the digestibility and availability data obtained from Experiment 1, five diets with approximately the same levels of digestible energy and protein were formulated
Ž
using a linear least-cost diet formulation computer program ‘Feedmania’ Mania
Soft-. Ž .
ware, Brisbane, Australia Table 3 . The meat meal products considered for the least cost diet formulation were Provinew
, lamb meal, and beef meal. Beef meal was not selected in the formulation by the least-cost program. The mixed meat meal product was excluded as it is not yet commercially available. The experimental diets comprised a
Ž .
reference diet SP35 with 27% fish meal and three others with 13%, 6% or 0% fish meal with the remainder replaced by a mixture of Provinew and lamb meal. For these three diets,L-lysine,DL-methionine andL-threonine were added if necessary to adjust the content of amino acids to that of the reference diet. The fifth diet was formulated without fish meal or added synthetic amino acids.
Experimental tanks were 10 000-l in capacity. Recirculated freshwater was filtered through a rapid rate sand filter before being supplied to experimental tanks at a flow rate of 17 l miny1. Effluent water from each tank flowed from the bottom of the tank via a
50 mm diameter drain leading to an external stand pipe. Overflow water from the standpipes was collected and ducted into a 7000-l reservoir passed through a 1 m3
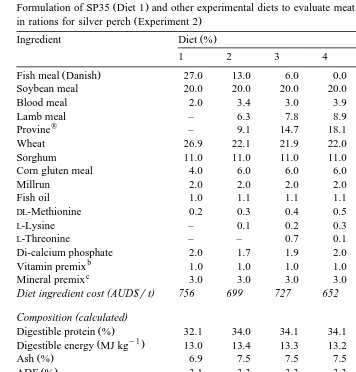
Table 3
Ž .
Formulation of SP35 Diet 1 and other experimental diets to evaluate meat meal as a substitute for fish meal
Ž .
in rations for silver perch Experiment 2
Ž .
Fish meal Danish 27.0 13.0 6.0 0.0 0.0 1300
Soybean meal 20.0 20.0 20.0 20.0 20.0 495
Blood meal 2.0 3.4 3.0 3.9 3.9 900
Lamb meal – 6.3 7.8 8.9 8.9 453
w
Provine – 9.1 14.7 18.1 18.9 775
Wheat 26.9 22.1 21.9 22.0 22.2 180
Sorghum 11.0 11.0 11.0 11.0 11.0 180
Corn gluten meal 4.0 6.0 6.0 6.0 6.0 700
Millrun 2.0 2.0 2.0 2.0 2.0 190
Fish oil 1.0 1.1 1.1 1.1 1.1 800
DL-Methionine 0.2 0.3 0.4 0.5 – 5500
L-Lysine – 0.1 0.2 0.3 – 4250
L-Threonine – – 0.7 0.1 – 8500
Di-calcium phosphate 2.0 1.7 1.9 2.0 2.0 610
b
Vitamin premix 1.0 1.0 1.0 1.0 1.0 4000
c
Mineral premix 3.0 3.0 3.0 3.0 3.0 4000
( )
Diet ingredient cost AUD$rt 756 699 727 652 607
( )
Composition calculated
Ž .
Digestible protein % 32.1 34.0 34.1 34.1 34.0
y1
Ž .
Digestible energy MJ kg 13.0 13.4 13.3 13.2 13.3
Ž .
Linolenic series fatty acids % 0.3 0.3 0.3 0.3 0.3
Ž .
Available arginine % 2.0 2.1 2.1 2.1 2.1
Ž .
Available histidine % 0.8 0.9 0.8 0.8 0.8
Ž .
Available isoleucine % 1.4 1.4 1.3 1.3 1.3
Ž .
Available leucine % 2.9 3.1 3.0 3.0 3.0
Ž .
Available lysine % 2.1 2.2 2.0 2.0 1.8
Ž .
Available metqcys % 1.4 1.4 1.4 1.4 0.9
Ž .
Available pheqtyr % 2.7 2.8 2.7 2.7 2.7
Ž .
Available threonine % 1.4 1.4 1.4 1.4 1.3
Ž .
Available valine % 1.7 1.7 1.6 1.6 1.6
a
Diet ingredient cost does not include the cost of processing. Prices from NSW Agriculture, Sydney Retail
Ž .
Feed Ingredient Prices or from commercial feed ingredient manufacturers, 1995 does not include freight .
bŽ y1 . Ž . Ž . Ž . Ž y1
IU kg diet : retinol A , 8000; cholecalciferol D3 , 1000;a-tocopheryl acetate E , 125; mg kg
. Ž . Ž . Ž .
diet : ascorbic acid C ROVIMIX STAY C 25; Roche , 1000; biotin 2% , 1; d-calcium panothenate, 55;
Ž .
calcium propionate, 250; choline chloride, 1500; cyanocobalamin B12 , 0.02; ethoxyquin, 150; folic acid, 4;
Ž . Ž .
menadione sodium bisulphite K3 , 16.5; myo-inositol, 600; nicotinamide, 200; pyridoxine B6 , 15; riboflavin
ŽB2 , 25.2; thiamin HCl B1 , 10.. Ž . c
Žmg kgy1diet : calcium carbonate, 7500; manganese sulphate, 300; zinc sulphate, 700; copper sulphate,.
60; ferrous sulphate, 500; sodium chloride, 7500; potassium iodate, 2.
Ž w x .
Eighty-five silver perch were stocked November spring 1995 into each of the 15
Ž .
( )
D.A.J. Stone et al.rAquaculture 186 2000 311–326 317
twice daily at 0800 and 1500 h, 7 days a week, for a period of 65 days. Waste feed was minimised by observing fish during feeding and when fish lost their appetite feeding
Ž w x .
was ceased. Fish were then harvested February late summer 1996 and survival mean
Ž .
weight increment and feed conversion ratio FCR were calculated from each tank. Proximate analyses on the whole body composition of five fish randomly selected
Ž .
from each tank were also conducted and the indices for protein deposition PD , fat
Ž . Ž . Ž .
deposition FD , protein efficiency ratio PER , protein retention efficiency PRE , and
Ž .
energy retention efficiency ERE were calculated.
2.6. Statistical analysis
Ž .
The digestibility and availability experiment Experiment 1 was designed for
analy-Ž .
sis using two-factor ANOVA with meat products B, L, M or P as the first factor
Žfixed and inclusion level 15% or 30% as the second factor also fixed . Single factor. Ž . Ž .
ANOVA was used to assess the difference between proximate body composition of fish fed experimental diets.
Ž .
The growth experiment Experiment 2 was designed for analysis using single-factor
Ž .
ANOVA. Homogeneity of variances was assessed using Cochran’s Test Winer, 1971 and comparison between means were made using Student–Newman–Kuels multiple-range test. Differences between means were considered significant at P-0.05. Unless
Ž .
otherwise stated, all results appear as mean"standard error of mean ns3 .
3. Results
3.1. Experiment 1, digestibility and aÕailability
The analysed proximate composition of meat meals tested in this study is presented in Table 1. The difference between the sum of the percentages of protein, fat and ash, and 100 for these meals indicates the presence of some nitrogen-free material. This may
Ž .
indicate contamination with material e.g., carbohydrate from the rumen or another extraneous source. When compared to Peruvian fish meal, the beef and lamb meals had less protein, fat and energy; the mixed meat meal had less protein and more fat and energy; and Provinew had more protein and energy. Provinew and the mixed meat meal had less ash than the Peruvian fish meal, while the beef meal and lamb meal had more. The amino acid content of the tested ingredients also differed and lysine was lower in all meat products than in Peruvian fish meal.
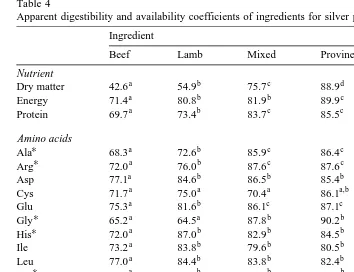
Digestibility and availability coefficients for ingredients were calculated using the
Ž .
values for the reference diet and the proportion of the ingredients used Table 4 . There
Ž .
was no interaction between ingredient or inclusion level for any nutrient P)0.05 . There were significant differences between ingredients for all nutrients except
methion-Ž .
ine P-0.05 , but significant differences between inclusion levels only occurred for six
Ž .
amino acids alanine, arginine, glycine, histidine, lysine and valine . The average
Ž .
Table 4
Apparent digestibility and availability coefficients of ingredients for silver perch in Experiment 11,2,3
Ingredient Pooled SEM
w
Beef Lamb Mixed Provine
Nutrient
a b c d
Dry matter 42.6 54.9 75.7 88.9 3.9
a b b c
Energy 71.4 80.8 81.9 89.9 1.7
a b c c
Protein 69.7 73.4 83.7 85.5 1.4
Amino acids
Apparent digestibility or availability coefficients for test ingredients were calculated using the equation:
Ž . Ž
Apparent digestibility or availability of nutrient in test ingredientsnutrient or energy concentration in test
Ž .
diet=apparent digestibility or availability of nutrient or energy in test dietyproportion of reference
Ž .
diet=nutrient or energy in reference diet=apparent digestibility or availability of nutrient or energy in the
. Ž .
reference dietrproportion of test ingredient in test diet=nutrient or energy concentration in test ingredient .
2 Ž .
Values are means"pooled SEM; ns6 average of both inclusion levels . There was no interaction
ŽP)0.05 between ingredients and inclusion level for any nutrient or amino acid. Means in the same row.
with the same letter in the superscript indicate the difference between ingredients was not significant
ŽP)0.05 .. 3
Inclusion content did not affect digestibility or availability coefficients of any nutrient or those amino acids not marked with an asterisk. For those amino acids marked with an asterisk, availability coefficients
Ž .
were lower when ingredients were included at 15% compared with P-0.05 .
77.6"2.2, 82.0"2.1; glycine 75.6"3.8, 78.2"3.6; histidine 79.6"2.3, 83.5"1.6; lysine 80.0"1.7, 82.5"1.2; and valine 77.8"1.5, 80.6"1.2.
The differences in amino acid availability between the 15% and 30% inclusion levels
Ž .
were small average 3.1%, range 2.4–4.4% . In every case, the standard error was larger for the amino acid availability at the 15% inclusion level compared to the 30% inclusion level. The differences may be attributed to the more variable results obtained from using the lower inclusion level and may be biologically insignificant.
For dry matter, energy and protein digestibility coefficients increased significantly
Ž . w
()
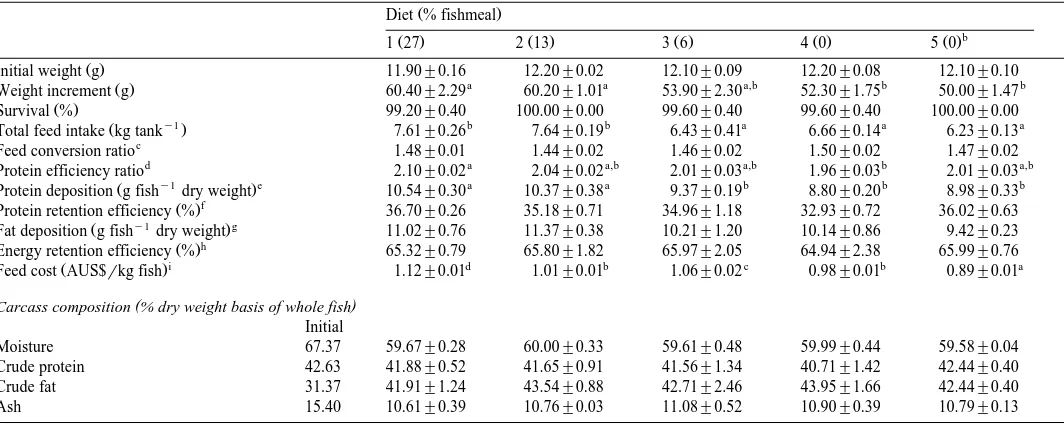
Growth performance, survival, feed utilisation, and carcass composition of silver perch after a 65-day feeding trial Experiment 2
Ž .
Initial weight g 11.90"0.16 12.20"0.02 12.10"0.09 12.20"0.08 12.10"0.10
a a a,b b b
Ž .
Weight increment g 60.40"2.29 60.20"1.01 53.90"2.30 52.30"1.75 50.00"1.47
Ž .
Survival % 99.20"0.40 100.00"0.00 99.60"0.40 99.60"0.40 100.00"0.00
y1 b b a a a
Ž .
Total feed intake kg tank 7.61"0.26 7.64"0.19 6.43"0.41 6.66"0.14 6.23"0.13
c
Feed conversion ratio 1.48"0.01 1.44"0.02 1.46"0.02 1.50"0.02 1.47"0.02
d a a,b a,b b a,b
Protein efficiency ratio 2.10"0.02 2.04"0.02 2.01"0.03 1.96"0.03 2.01"0.03
y1 e a a b b b
Ž .
Protein deposition g fish dry weight 10.54"0.30 10.37"0.38 9.37"0.19 8.80"0.20 8.98"0.33
f Ž .
Protein retention efficiency % 36.70"0.26 35.18"0.71 34.96"1.18 32.93"0.72 36.02"0.63
y1 g
Ž .
Fat deposition g fish dry weight 11.02"0.76 11.37"0.38 10.21"1.20 10.14"0.86 9.42"0.23
h Ž .
Energy retention efficiency % 65.32"0.79 65.80"1.82 65.97"2.05 64.94"2.38 65.99"0.76
i d b c b a
Ž .
Feed cost AUS$rkg fish 1.12"0.01 1.01"0.01 1.06"0.02 0.98"0.01 0.89"0.01
( )
Carcass composition % dry weight basis of whole fish
Initial
Moisture 67.37 59.67"0.28 60.00"0.33 59.61"0.48 59.99"0.44 59.58"0.04 Crude protein 42.63 41.88"0.52 41.65"0.91 41.56"1.34 40.71"1.42 42.44"0.40 Crude fat 31.37 41.91"1.24 43.54"0.88 42.71"2.46 43.95"1.66 42.44"0.40
Ash 15.40 10.61"0.39 10.76"0.03 11.08"0.52 10.90"0.39 10.79"0.13
a Ž .
Values are means"SEM for three replicate tanks. Means in rows which share the same superscript were not significantly different P)0.05; ANOVA; SNK .
b
No added crystalline amino acids.
c w x
FCRsweight of food, adjusted to 92% dry matterrwet weight fish gain .
d w Ž . Ž . . Ž Ž . Ž . .x
PDsfinal weight dry basis=final protein content dry basisr100yinitial weight dry basis=initial protein content dry basisr100 .
e w Ž . Ž . . Ž Ž . Ž . .x
FDsfinal weight dry basis=final fat content dry basisr100yinitial weight dry basis=initial fat content dry basisr100 .
f w Ž . Ž .x
PERsindividual weight gain grindividual protein intake by fish g dry weight .
g wŽŽ . Ž .. x
PREs final dry weight=final % dry weight body proteinyinitial dry weight=initial % dry weight body protein rdry weight protein intake=100 .
h wŽŽ . Ž .. x
EREs final dry weight=final % body energyyinitial dry weight=initial % body energy rdry weight energy intake=100 .
i Ž . Ž .
lamb meal then beef meal. Significant differences are indicated in Table 4. The availability of all amino acids were averaged and the values were 84.8% for Provinew, 83.8% for the mixed meat meal, 79.6% for lamb meal, and 73.5% for beef meal. Availability coefficients for non-essential amino acids, alanine, glycine, proline and serine were significantly higher for the mixed meat meal and Provinew
compared with other products.
3.2. Experiment 2, growth
Ž .
Diet had no significant effect on survival, FCR, PRE, FD, or ERE P)0.05 .
Ž .
However, there was a significant diet effect P-0.05 on weight increment, PER and
Ž .
PD, and all of these indices were lower for diets without fish meal Table 5 .
Ž .
There were no significant differences P)0.05 in the moisture, crude protein, crude fat, and ash composition of silver perch carcasses fed different experimental diets for 65
Ž . Ž .
days Table 5 . However, there was a difference P)0.05 between the initial and final moisture, crude fat, and ash carcass composition for fish from each of the experimental diets. Carcass protein composition remained unchanged.
4. Discussion
In this study, the omnivorous silver perch readily accepted diets with up to 30% meat meal. This is consistent with other studies where diets including meat meal at contents ranging from 30% to 70%, as a substitute for fish meal, have been readily accepted by both omnivorous and carnivorous species such as tilapia, gilthead sea bream, rainbow
Ž
trout, and yellowtail Davies et al., 1989, 1993; Watanabe and Pongmaneerat, 1991;
. Ž .
Shimeno et al., 1993a,b . Mohsen and Lovell 1990 found that meat and bone meal at an inclusion level of 11% increased the palatability of soybean mealrcorn based diets for channel catfish.
Meat meals were generally well digested by silver perch with higher ADCs for dry
Ž .
matter, energy and nitrogen for the meat products with less ash Table 4 . Other authors have also found protein digestibility to be negatively correlated with high ash content in
Ž .
meat meals for rainbow trout Watanabe and Pongmaneerat, 1991 and gilthead sea
Ž .
bream Nengas et al., 1995 .
Ž .
Nengas et al. 1995 calculated ADCs for diets containing meat products fed to
Ž .
gilthead sea bream. For a diet with 43% meat meal 80% protein and 4% ash , protein and energy digestibility coefficients were 92% and 86%, respectively, while for a diet
Ž .
with 40% meat and bone meal 52% protein and 27% ash , protein and energy digestibility coefficients were 78% and 75%, respectively. The comparable digestibility
w Ž
coefficients for protein and energy for silver perch fed diets containing Provine 81%
.
protein and 3% ash , were 86% and 90%, respectively, and for diets with lamb meal
Ž54% protein and 35% ash were 73% and 81%, respectively. Given the likelihood of.
( )
D.A.J. Stone et al.rAquaculture 186 2000 311–326 321
Very little data for individual amino acid availability coefficients have been published
Ž .
for warm water species. Wilson et al. 1981 determined coefficients for a meat and
Ž .
bone meal 56.1% crude protein for channel catfish and the average of amino acid availability value was 74.3%. This is similar to averages for silver perch of 73.5% and 79.6% for beef and lamb meals, respectively, calculated in this study. Wilson et al.
Ž1981 recorded higher availability coefficients for alanine, arginine, glycine, and proline.
compared with those determined for silver perch fed beef or lamb meal, while values for silver perch were higher for aspartic acid, methionine, threonine, serine, and tyrosine.
Ž .
Removal of bone sless ash for the mixed species meal resulted in higher average
Ž
amino acid availability 83.8% compared with 79.6% and 73.5% for lamb and beef
.
meal, respectively . The increased amino acid availability for the mixed species meal may be attributed to the removal of the relatively poor quality protein from bone and
Ž
connective tissue which may not be digested as well as protein from muscle NRC,
.
1993 .
For pigs, lower and more variable lysine availability coefficients were reported for
Ž . Ž
low ash meat meal 50–60% protein compared with high ash meat meal 43–44%
.
protein , and this was attributed to a higher chance of processing damage to lysine for
Ž .
meals rendered without bone Ted Batterham, personal communication, 1993 . This trend was not evident with silver perch for low ash meat meals in this study.
Digestibility coefficients for protein in the present study were lower than those previously recorded with silver perch for fish meals, oilseed meals, and cereals but
Ž .
similar to those recorded for grain legumes Allan et al., in press . Protein digestibility coefficients for silver perch fed meat products compared favourably with published
Ž .
values for rainbow trout. Asgard 1988 calculated a protein digestibility coefficient for
Ž .
meat and bone meal with 51.3% protein of 59%, while Alexis et al. 1988 determined protein digestibility values of 60.9% and 59.7% for defatted meat and bone meals
Ž60.2% protein, 2.5% fat, 27.2% ash and 63.1% protein, 3.5% fat, 24.4% ash,
respec-.
tively .
Feed conversion efficiency is influenced by dry matter digestibility. Dry matter digestibility coefficients for the mixed meal and Provinew
compared favourably with coefficients for lower quality Peruvian fish meal, oilseed meals, and grain legumes
ŽAllan et al., in press . Published dry matter digestibility coefficients for meat products. Ž .
used in fish diets are scarce. McGoogan and Reigh 1996 reported a dry matter digestibility coefficient of 64.7% for meat and bone meal which did not differ
signifi-Ž .
cantly from menhaden fish meal 79.7% when fed to red drum at the 30% inclusion
Ž .
level. Gaylord and Gatlin 1996 also reported a dry matter digestibility coefficient of 86.2% for meat and bone meal, which were comparable to select menhaden fish meal
Ž93.9% . For rainbow trout, dry matter digestibility coefficients of 43.2% and 38.8%. Ž
were determined for fat extracted meat and bone meals 60.2% protein, 2.5% fat, 27.2%
. Ž .
ash and 63.1% protein, 3.5% fat and 24.4% ash, respectively Alexis et al., 1988 . Digestibility coefficients for energy for Provinew
were similar to those for Peruvian fish meal, although energy digestibility for other meat products was lower. Digestible energy from all meat products compared favourably with those from oilseed meals and
Ž .
are comparable with digestible energy values determined for meat and bone meal with
Ž y1.
54.1% protein, 10.3% fat, 31.1% ash for channel catfish 12.26 MJ kg and rainbow
Ž y1. Ž .
trout 13.33 MJ kg NRC, 1993 .
During this study, meat meal products were successfully used to replace half of the fish meal in silver perch diets. Other studies have also shown that meat meal and meat and bone meal can be successfully used to partially replace fish meal in diets for
Ž . Ž . Ž
barramundi Lates calcarifer Aquacop et al., 1993 , gilthead sea bream Davies et al.,
. Ž . Ž
1989, 1993 , yellowtail Shimeno et al., 1993a,b , and rainbow trout Watanabe et al.,
. Ž .
1993 . Mohsen and Lovell 1990 found that meat meal or other animal protein meals including fish meal improved weight gain of channel catfish fed on soybean mealrcorn basal diets. Digestibility studies with the prawn, Penaeus monodon, also indicate
Ž .
potential for meat meal with this species Smith, 1995 . However, Watanabe and
Ž .
Pongmaneerat 1991 found that growth of rainbow trout was poorer when fed with diets
Ž .
where fish meal was entirely replaced with either meat meal 80% protein and 4% ash
Ž .
or meat and bone meal 52% protein and 27% ash than when fish were fed diets containing white or brown fish meal as the sole protein source.
In Experiment 2, growth and the amount of deposited protein declined when silver perch were fed diets that contained less than 13% fish meal. Possible reasons for this
Ž .
include: 1 a lower concentration of essential nutrients in diets containing less than 13%
Ž .
fish meal; 2 reduced attractiveness or palatability of these diets, causing reduced feed
Ž .
intake and hence reduced growth; or 3 some growth reducing compound in the diets with less fish meal and more meat products.
As digestible crude protein and digestible energy contents were similar for all diets, differences in proteinrenergy ratio do not account for the differences in growth. Compared with fish meal, meat products had lower contents of lysine, methionine plus
Ž .
cystine and threonine. Watanabe and Pongmaneerat 1991 attributed poorer perfor-mance of rainbow trout fed meat meal based diets, compared to fish meal based diets, to limiting amino acids in meat meal, notably lysine, methionine, and tryptophan.
How-Ž .
ever, in our study, with the exception of Diet 5 0% fish meal, no added amino acids , lysine, methionine, and threonine were balanced in all diets using crystalline amino acids. Had amino acids been deficient, a significant difference between Diet 4 and Diet 5 would have been expected and this was not evident. It is possible that the addition of crystalline amino acids was not effective. There is some conjecture about their efficiency
Ž
of utilisation in aquaculture diets Lovell, 1989; Cowey, 1992; Murai, 1992; Davies and
.
Morris, 1997 , however, as concentrations of all three amino acids, even in Diet 5, were
Ž .
above published requirements for channel catfish and tilapia NRC, 1993 , deficiencies in amino acids are considered unlikely to have accounted for differences in growth. We did not measure availability of tryptophan, although calculated contents of all diets
Ž0.37–0.48% of dry diet based on published tryptophan contents of similar ingredients to
.
those used; NRC, 1993 , and the lowest availability coefficients of any amino acid
Ž .
recorded in the present study 65.2% , are still above published requirements for channel catfish, and in close agreement with requirements for Nile tilapia and common carp
ŽNRC, 1993 ..
Ž .
( )
D.A.J. Stone et al.rAquaculture 186 2000 311–326 323
based diets. Conversely, in our study, PER and PRE were not affected by diet. This suggests a different response by silver perch to the meat meals used here compared with
Ž .
fish species and the products used by Watanabe and Pongmaneerat 1991 .
Total lipid content and linolenic series fatty acid levels in all diets were kept similar with the addition of fish oil and are unlikely to account for these differences in growth. The diet with the highest level of fish meal is likely to have contained more highly
Ž . Ž . Ž .
unsaturated fatty acids HUFAs 0.9% of diet than the other diets 0.2–0.5% . However, it is unlikely that this difference accounted for differences in growth. In a recent experiment, we fed silver perch a series of diets with different ratios of fatty acids. Silver perch grew equally well on diets with negligible contents of HUFAs
Ž-0.01% of diet and diets with approximately 1% HUFAs these diets had similar. Ž .
levels of polyunsaturated fatty acids .
Feed intake was lower for fish fed Diets 3, 4 or 5 compared with those fed Diets 1 or 2. This may have been due to reduced attractiveness or palatability of the diets. In general, meat meal and meat and bone meal have been used to increase diet
attractive-Ž .
ness and or palatability Mohsen and Lovell, 1990; Watanabe et al., 1993 . Apart from
Ž .
the control diet Diet 1 , the diets used in Experiment 2 contained lamb meal and Provinew as the meat products used to replace fish meal. The amount of each of these was determined using a least-cost diet formulation program. Nutrients were specified to be similar to Diet 1, the fish meal content was specified at 13%, 6% or 0% and then the mix of lamb meal and Provinew to supply these nutrients for each diet at the cheapest price was determined. On this basis, 6.3% and 9.1% of lamb meal and Provinew
were used in Diet 2, 7.8% and 14.7% in Diet 3, 8.9% and 18.1% in Diet 4, and 8.9% and 18.9% in Diet 5. Although Provinew
was highly digestible, higher contents may have caused the diets to be less attractive or palatable or to have reduced growth. Further investigation on Provinew
as a sole ingredient at inclusion levels above 6.3% is warranted if it is hoped that this product is to be used as a major protein source for aquaculture feeds.
The cost of diet to produce 1 kg of silver perch was reduced by feeding diets
Ž .
containing meat meal Table 5 . However, when more than half of the fish meal was replaced, a decline in growth was observed. Therefore, the added cost of the extended grow-out period may off-set the benefits of cheaper feed costs if fish are fed diets containing less than 13% fish meal.
Analysed body composition of silver perch fed different experimental diets indicated
Ž .
they had similar protein, fat and energy contents. Similarly, Shimeno et al. 1993b
Ž
reported the body composition of yellowtail fed diets containing 30% meat meal 65.3%
.
protein, 14.8% fat, and 11.4% ash for 30 days had protein and fat contents similar to fish fed the control diet comprised of fish meal and soybean.
Acknowledgements
We thank Jane Frances, Rebecca Warner-Smith, and Mark Booth at Port Stephens Research Centre and Ken O’Brien and Wendy Peasley at Wollongbar Agricultural Institute for their excellent technical help. Helena Heasman assisted in the manuscript preparation. This research was partially funded by the Australian Fisheries Research and Development under the Fish Meal Replacement Sub-Program. Additional funding was provided by the Australian Centre for International Agricultural Research, the Australian Grains Research and Development, and the Australian Meat Research. Support from Australian Native Fish is also gratefully acknowledged. The manuscript was critically reviewed by Stewart Fielder and Wayne O’Connor.
References
Alexis, M., Filioglou, M., Theochari, V., 1988. Apparent digestibility measurements of feedstuffs having potential for use in rainbow trout diets. Thalassographica 11, 19–26.
Allan, G.L., 1997. Alternative feed ingredients for intensive aquaculture. In: Recent Advances in Animal Nutrition in Australia. University of New England, Armidale, NSW, Australia, pp. 98–109.
Allan, G.L., Parkinson, S., Frances, J., Stone, D.A.J., Booth, M.A., Rowland, S.J., Warner-Smith, R., Replacement of fishmeal in diets for silver perch: I. Digestibility of alternative ingredients. Aquaculture, in press.
Ž .
Allan, G.L., Rowland, S.J., 1992. Development of an experimental diet for silver perch Bidyanus bidyanus . Austasia Aquacult. 6, 39–40.
Allan, G.L., Rowland, S.J., Parkinson, S., Stone, D.A.J., Jantrarotai, W., 1999. Nutrient digestibility for
Ž .
juvenile silver perch Bidyanus bidyanus Mitchell : development of methods. Aquaculture 170, 131–145.
Ž .
Association of Official Analytical Chemists AOAC , 1990. Official Methods of Analysis of the Association of Official Analytical Chemists. 15th edn. AOAC, Arlington, VA, USA.
AQUACOP, Orengo, H., Cuzon, G., Thouard, E., 1993. Optimisation de l’alimentation de Lates calcarifer en elevage. Essais de substitution de la farmine de poisson par de la farine de cretons dans la composition de
Ž .
l’aliment de grossissement. In: Fish Nutrition in Practice. Kaushik, S.J., Luquet, P. Eds. , Coll. Les Colloques No. 61 INRA, Paris, pp. 691–704.
Asgard, T., 1988. Nutritional value of animal protein sources for salmonids. In: Agricultural International Conference and Exposes Congress Proceedings, Vancouver Trade and Convention Centre, Vancouver, BC, Canada, September 6–9. pp. 411–418.
Australasian Agribusiness Services, 1993. The meat meal and tallow industry and its markets, Main Report Prepared for the Meat Research. Australasian Agribusiness Services, Melbourne, Victoria, Australia, 94 pp. Cho, C.Y., Kaushik, S.J., 1990. Nutritional energetics in fish: energy and protein utilisation in rainbow trout
ŽSalmo gairdneri . World Rev. Nutr. Diet. 61, 132–172..
Cohen, S.A., Tarven, T.L., Meys, M., 1989. The pico tag method, A Manual of Advanced Techniques for Amino Acid Analysis. Waters, Milford, MA, USA, 123 pp.
Cowey, C.B., 1992. Nutrition: estimating requirements of rainbow trout. Aquaculture 100, 177–189. Dal Pont, J., Hogan, M., Newell, B., 1973. Laboratory techniques in marine chemistry: II. Determination of
ammonia in seawater and the preservation of samples for nitrate analysis. In: Aust. CSIRO Div. Fish. Oceanogr. Rep. CSIRO, Sydney, 11 pp.
Davies, S.J., Morris, P.C., 1997. Influence of multiple amino acid supplementation on the performance of
Ž .
rainbow trout, Oncorhynchus mykiss Walbaum , fed soya based diets. Aquacult. Res. 28, 65–74. Davies, S.J., Nengas, I., Alexis, M., 1993. Partial substitution of fish meal with different meat meal products
Ž . Ž .
( )
D.A.J. Stone et al.rAquaculture 186 2000 311–326 325
Davies, S.J., Williamson, J., Robinson, M., Bateson, R.I., 1989. Practical inclusion levels of common animal
Ž .
by-products in complete diets for tilapia Oreochromis mossambicus, Peters . In: Takeda, M., Watanabe,
Ž .
T. Eds. , The Current Status of Fish Nutrition in Aquaculture. Tokyo Univ. Fisheries, Tokyo, Japan, pp. 325–332.
Gaylord, T.G., Gatlin, D.M. III, 1996. Determination of digestibility coefficients of various feedstuffs for red
Ž .
drum Sciaenops ocellatus . Aquaculture 139, 303–314.
Havilah, E.T., Wallis, D.M., Morris, R., Wollnough, J.A., 1977. A micro-colorimetric method for determina-tion of ammonia in Kjeldahl digests with a manual spectrophotometer. Lab. Pract. 26, 545–547. Hossain, M.A., Jauncey, K., 1989a. Studies on the protein, energy and amino acid digestibility of fish meal,
Ž .
mustard oilcake, linseed and sesame meal for common carp Cyprinus carpio L. . Aquaculture 83, 59–72. Hossain, M.A., Jauncey, K., 1989b. Nutritional evaluation of some Bangladeshi oilseed meals as partial substitutes for fish meal in the diet for common carp, Cyprinus carpio L. Aquacult. Fish. Manage. 20, 255–268.
Lovell, R.T., 1989. Nutrition and Feeding of Fish. Van Nostrand Reinhold, New York, 260 pp.
Ž .
Lovell, R.T., 1992. Replacing fish meal in channel catfish diets. In: Allan, G.L., Dall, W. Eds. , Proceedings on Aquaculture Nutrition Workshop, Salamander Bay, 15–17 April 1991. NSW Fisheries, Brackish Water Fish Culture Research Station, Salamander Bay, Australia, pp. 118–121.
Major, G.A., Dal Pont, J., Kyle, J., Newell, B., 1972. In: Laboratory Techniques in Marine Chemistry. A Manual. Aust. CSIRO Div. Fish. Oceanogr. Rep. No. 51 CSIRO, Sydney, 55 pp.
Manzi, J.J., 1989. Aquaculture research priorities for the 1990s. World Aquacult. 20, 29–32.
Ž
McGoogan, B.B., Reigh, R.C., 1996. Apparent digestibility of selected ingredients in red drum Sciaenops
.
ocellatus diets. Aquaculture 141, 233–244.
Mohsen, A.A., Lovell, R.T., 1990. Partial substitution of soybean meal with animal protein sources in diets for channel catfish. Aquaculture 90, 303–311.
Murai, T., 1992. Protein nutrition of rainbow trout. Aquaculture 100, 191–207.
Nengas, I., Alexis, M.N., Davies, S.J., Petichakis, G., 1995. Investigation to determine digestibility coeffi-cients of various raw materials in diets for gilthead sea bream, Sparus auratus, L. Aquacult. Res. 26, 185–194.
New, M.B., 1991. Where will feeds be in the year 2000. Fish Farmer Int. File, 38–41, MayrJune.
Ž .
National Research Council NRC , 1993. Nutrient Requirements of Fish. National Academy Press, Washing-ton, DC, 114 pp.
Rowland, C.J., Barlow, C.G., 1991. Fish biology the right prerequisites. Austasia Aquacult. 5, 27–30. Rowland, S.J., Allan, G.L., Clark, K., Hollis, M., Pontifex, T., 1994. Production of fingerling Bidyanus
Ž .
bidyanus Teraponidae at two densities in earthen ponds. Prog. Fish-Cult. 56, 296–298.
Rowland, S.J., Allan, G.L., Hollis, M., Pontifex, T., 1995. Production of the Australian freshwater silver
Ž .
perch, Bidyanus bidyanus Mitchell , at two densities in earthen ponds. Aquaculture 130, 317–328. Rowland, S.J., Ingram, B.A., 1991. Diseases of Australian native freshwater fishes, with particular emphasis
Ž . Ž
on the ectoparasitic and fungal diseases of Murray cod Maccullochella peeli , golden perch Macquaria
. Ž .
ambigua and silver perch Bidyanus bidyanus . In: Fisheries Bulletin No. 4 NSW Agriculture and
Fisheries, 33 pp.
Scott, K., 1978. Cause and control of losses of chromium during nitric, perchloric acid oxidation of aquatic sediments. Analyst 103, 754.
Shimeno, S., Hosokawa, H., Masumoto, T., Ruchimat, T., Kishi, S., 1996. Addition of combined defatted soybean meal, malt protein flour, and meat meal to yellowtail diet. Nippon Suisan Gakkaishi 62, 243–247. Shimeno, S., Masumoto, T., Hujita, T., Mima, T., Ueono, S.-I., 1993a. Alternative protein sources for fish
meal in diets of young yellowtail. Nippon Suisan Gakkaishi 59, 137–143.
Shimeno, S., Mima, T., Imanaga, T., Tomaru, K., 1993b. Inclusion of combination of defatted soybean meal, meat meal, and corn gluten meal to yellowtail diets. Nippon Suisan Gakkaishi 59, 1889–1895.
Ž .
Smith, D.M., 1995. Preliminary evaluation of meat meal in aquaculture diets for prawns Penaeus monodon . Final Report, Part 2 prepared for Meat Research. CSIRO Division of Fisheries, Cleaveland, Queensland, Australia, 23 pp.
Tacon, A.G.J., 1994. Feed ingredients for carnivorous fish species: alternatives to fish meal and other fisheries resources. In: FAO Fisheries Circular No. 881 FAO, Rome, 35 pp.
Thurston, S.J., Rowland, S.J., 1995. Techniques for the hatchery production of silver perch. In: Rowland, S.J.,
Ž .
Bryant, C. Eds. , Proceedings of Silver Perch Aquaculture Workshops, Grafton and Narrandera, April 1994. Austasia Aquaculture for NSW Fisheries, pp. 29–39.
Watanabe, T., Pongmaneerat, J., 1991. Quality evaluation of some animal protein sources for rainbow trout
Oncorhynchus mykiss. Nippon Suisan Gakkaishi 57, 495–501.
Watanabe, T., Pongmaneerat, J., Sato, S., Takeuchi, T., 1993. Replacement of fish meal by alternative protein sources in rainbow trout diets. Nippon Suisan Gakkaishi 59, 1573–1579.
Wilson, R.P., Robinson, E.H., Poe, W.E., 1981. Apparent and true availability of amino acids from common feed ingredients for channel catfish. J. Nutr. 111, 923–929.