FLUORESCENT ANALYSIS OF PHOTOSYNTHETIC MICROBES AND POLYCYCLIC
AROMATIC HYDROCARBONS LINKED TO OPTICAL REMOTE SENSING
D. Zhang a,*, J.-P. Muller a, S. Lavender b, D. Walton a L.R. Dartnell c, d a
Mullard Space Science Laboratory, Department of Space and Climate Physics, University College London, UK b
ARGANS Ltd, Tamar Science Park, Plymouth, UK c
UCL Institute for Origins, University College London, Gower Street, London WC1E 6B, UK d
The Centre for Planetary Sciences at UCL/Birkbeck, Earth Sciences, University College London, Gower Street, London WC1E 6B, UK
Commission VIII/9: Oceans
KEY WORDS:Fluorescence, Excitation-Emission Matrix, Cyanobacteria, Crude oil, PAHs
ABSTRACT:
Fluorescence analysis, being a non-invasive technique, has become one of the most powerful and widely used techniques for microbiologists and chemists to study various types of sample from photosynthetic microbes to hydrocarbons. The work reported here focuses on experimental results of fluorescent features of photosynthetic microbial species (cyanobacteria) and also five different crude oil samples. The cyanobacteria samples were collected from the Baltic Sea at the end of July 2011 and were associated with cyanobacterial bloom events, and the crude oil samples were from various oil spill events. The aim of the study was to find fluorescent biosignatures of cyanobacteria (initially a species specific to the Baltic Sea) and the fingerprints of crude oil; oil spills can be difficult to differentiate from biogenic films when using Synthetic Aperture Radar (SAR) or sunglint contaminated optical imagery. All samples were measured using a Perkin Elmer LS55 Luminescence spectrometer over a broad range of excitation and emission wavelength from ultraviolet (UV) to near infrared (NIR). The results are presented in Excitation Emission Matrices (EEMs) that exhibit the fluorescent features of each sample. In the EEM of the seawater sample containing cyanobacteria, there is an intense emission peak from tryptophan with fluorescent excitation and emission peaks at 285 and 345 nm respectively. In addition, fluorescent signatures of phycocyanin and chlorophyll-a are present with excitation and emission centre wavelengths at 555 nm, 645 nm and 390 nm, 685 nm, respectively. Additionally, the fluorescence signatures of Polycyclic Aromatic Hydrocarbons (PAHs) are present in the EEMs of crude oil samples with excitation and emission peaks at 285 nm and 425 nm. This study underpins further research on how to distinguish cyanobacteria species by their fluorescence signatures and the potential role that PAHs play in detection of cyanobacteria fluorescence features.
1. INTRODUCTION
Cyanobacteria, a class of photosynthetic microbes, have a long evolutionary history, starting about 3-3.5 billion years ago (Whitton and Potts, 2000). Cyanobacteria that obtain energy through oxygenic photosynthesis are ubiquitous in almost all ecosystem habitats on the earth from temperate regions such as oceans to extreme environments i.e. deserts and the dry valleys of Antarctica.
Cyanobacteria were able to dominate the oceans after past mass extinction events. They can evolve under anoxic (low oxygen) conditions and are well adapted to environmental stress including exposure to UV, high solar flux, nuclear radiation and temperatures. Cyanobacteria assimilate carbon dioxide, playing a significant role in the carbon cycle that impacts climate change. Additionally, the frequency and extent of intense cyanobacterial blooms have increased in inland and coastal waters around the world (Kahru, 1997). These blooms not only have potentially harmful effects on both humans and the flora and fauna, but also the environment at large e.g. surface accumulations of cyanobacteria increase sea surface temperature in areas such as the southern Baltic Sea (Kahru et al., 1993). Therefore, reliable mapping of the cyanobacterial community is of importance in the coastal waters and inland seas, such as the Baltic Sea.
Polycyclic Aromatic Hydrocarbons (PAHs) are a large group of organic compounds containing two or more aromatic rings. PAHs exist on the Earth as a result of previous meteoritic bombardment and more recently from fossil fuel combustion and by-products of industrial processing. They are commonly found in a variety of naturally occurring products such as crude oil and petroleum gas. There are several pathways (Cerniglia, 1992) that PAHs can be used to enter into ecosystems, i.e. direct aerial fallout, sewage effluents, natural seeps and accidental discharges during the transport, use and disposal of petroleum products and from events such as oil spills, one of which recently occurred in The Gulf of Mexico after the explosion of the Deepwater Horizon oil rig and the subsequent release of approximately 780,000 m3 of crude oil into the Gulf (Mitsch, 2010). This release resulted in extensive damage to the marine environment and wildlife habitats. It is therefore urgent to be able to monitor the migration of oil slicks on the sea surface and find out an effective and environmental friendly means to clean up the oil spill. On the other hand, the capability of cyanobacteria in terms of reduction and degradation of PAHs has been shown by several researchers (Cerniglia et al., 1980; Cerniglia, 1992; Steinbüchel et al. 1997; Abed and Köster 2005).
aim is to find fluorescent biosignatures specific to cyanobacterial species and crude oil.
2. MATERIALS AND METHODS
2.1 Seawater sample preparation
Seawater samples were collected offshore from Askö Island which is located some 80 km south of Stockholm, on 29th July 2011. The samples were transported using dry ice and were received at UCL on 1st August 2011. Subsequently, these samples were stored in a -80 degC freezer until they were measured on the 23rd August 2011.
From an optical perspective, natural sea water is comprised of three main components: inorganic suspended material, Coloured Dissolved Organic Matter (CDOM) and phytoplankton. Inorganic suspended material is defined as all inorganic particulates that are not included in the phytoplankton component. CDOM is a group of organic and dissolved substances, which consists of humic and fulvic acids. Due to their exponential absorption curve with strong absorption from UV decreasing towards the red spectral region it is often known as yellow substance or gelbstoff. CDOM has a fluorescence peak at an excitation/emission (ex/em) pairing of around 355/450 nm (Hoge et al., 1993; Nieke et al., 1997) with fluorescence efficiency linearly correlated with absorption (Green and Blough, 1994). In addition to CDOM, photosynthetic pigments of cyanobacterial cells also make a significant contribution to the fluorescence emission of seawater. Phycocyanin (PC) is a cyanobacteria specific pigment receiving and transferring light energy to chlorophyll-a (Chl-a) for photosynthetic activity. PC has an absorption peak at 620nm with a fluorescence emission peak at 650 nm. Chl-a absorbs light at wavelengths of 440 and 680 nm inducing peak fluorescence at 685nm. Apart from photosynthetic pigments, Nicotinamide Adenine Dinucleotide Phosphate (NADPH) being a primary product of photosynthesis, has an absorption peak at 340 nm and a fluorescence emission peak at 460 nm (Steigenberger et al., 2004). In addition to PC and Chl-a fluorescence, cyanobacteria also induce fluorescence from the aromatic amino acid tryptophan (Dartnell et al., 2010 and see Dartnell et al., 2011 for model EEMs and references therein).
Fluorescence properties of the major constituents of seawater are listed in Table 1.
Prior to the measurements, the seawater samples (frozen after sampling for transport) were thawed and centrifuged for 10 minutes to concentrate the cells present. After resuspending the cell pellet, the samples were pipetted into a 3.0 mL quartz
Five different crude oil samples collected from various oil spill events were also used for the spectro-fluorescence and optical reflectance measurements. All of these oil samples are the equivalents of weathered crude oil with diverse consistency in terms of their thickness.
To obtain detailed fluorescence features of PAHs, oil samples were pipetted into sample well plates and measured with a fiber-optic attachment on the same Perkin Elmer LS55 spectrometer (PE-LS55).
Before optical reflectance measurements, oil samples were transferred onto five black plates, and a Solux light source pointed at the samples with a zenith angle of 45 degrees. In the mean time, optical fiber probe head was positioned about 3cm above the oil samples at a zenith angle of 0 degrees (i.e. nadir-viewing angle). The oil sample reflectance was measured using an EPP2000 High Resolution spectrometer (Stellarnet, Florida, US), and reflectance spectra were recorded from 200 nm up to 1129 nm
2.3 Excitation–emission matrices
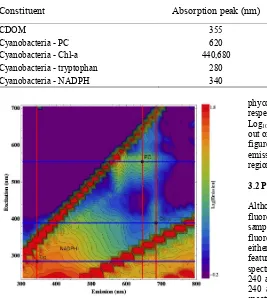
An Excitation-Emission Matrix (EEM) contains entire spectral information of measured samples giving a detailed pattern of fluorescence intensity of measured samples by covering a broad range of both excitation and emission wavelengths (an example is given in figure 1). EEMs record a series of emission spectra produced by incrementing the excitation wavelengths over a broad range of the electromagnetic spectrum from UV to near infrared region. It stacks emission spectra generated by the excitation into a three-dimensional matrix. Using a contour landscape to display and visualise such an information rich dataset is an effective means to demonstrate the characterization of the fluorescence responding from complex microbial cells and other chemical samples. To obtain a clearer visualisation, it is reasonable to flatten the 3D landscape into two-dimensional planes using colour coding to illustrate the intensity of fluorescence emission, so that the emission peaks are not obscured behind one another and represents a clear excitation-emission map of a sample’s fluorescence response (Dartnell et al., 2010).
3. RESULTS
3.1 Fluorescence properties of cyanobacteria cellular pigments
For the concentrated seawater samples, emission spectra were recorded between 300 and 800 nm, with data points logged every 0.5 nm. The excitation wavelength was incremented in 15 nm steps between 240 and 705 nm, and the result of the spectro-fluorescence measurements is displayed using EEM in figure 1.
There are three diagonal intense emission stripes exhibited in figure 1. These are artifacts of the spectrometer instrument due to diffraction-grating effects of the spectrometer, which is used for selecting various excitation wavelengths. To be specific, the first diagonal with the steepest gradient on the EEM of 1 is caused by Raleigh scattering of the excitation light from measured sample. The second and third diagonal strips on the EEM with a gradient of 1/2 and 1/3 are second and third order harmonic artifacts of excitation light. It is important to know that only the emission recorded between the first and second diagonal lines is relevant to fluorescence properties of measured samples.
Table 1. Fluorescence properties of seawater containing CDOM and cyanobacteria.
Constituent Absorption peak (nm) Fluorescence emission maximum (nm)
CDOM 355 450
Cyanobacteria - PC 620 650
Cyanobacteria - Chl-a 440,680 685
Cyanobacteria - tryptophan 280 340
Cyanobacteria - NADPH 340 460
Figure 1. Excitation-Emission Matrix (EEM) of the concentrated seawater sample, and intensity of fluorescence emission is shown on an arbitrary Log10 scale. The blue horizontal lines display the excitation wavelengths at 280, 390, 550 nm that induced fluorescence peak from measured samples, and the red vertical lines show the fluorescence emission with the corresponding excitation.
There are three emission peaks related to cyanobacteria fluorescent signatures in this region. The first fluorescence emission peak at 345 nm is from tryptophan excited at a wavelength of 285 nm. The second emission peak, 685 nm, is from Chlorophyll-a excited at a wavelength of 390 nm. The third peak is from phycocyanin which is excited at a wavelength of 555 nm with maximum fluorescence emission at 650 nm. To better understand the detailed fluorescence spectra features of these three fluorophores, their spectro-fluorescence curves are produced using excitation at these three wavelengths, which is shown in figure 2.
phycocyanin stimulated at wavelength of 285, 390 and 555 nm, respectively. Fluorescence emission intensity is shown on a Log10 scale. Dashed curves correspond to the emissions that are out of the region made by the first and second diagonal strips in figure 1, and the solid curves indicate relevant fluorescence emission spectra for each fluorophore, which correspond to the region between the first and second diagonal lines in figure 1.
3.2 PAHs fluorescence properties of crude oil samples
Although five different oil samples were all measured for fluorescence and reflectance features, four of the five oil samples did not show relevant information on PAHs fluorescence which is caused by their optical properties being either too thick or too thin. Only one oil sample exhibits related features on PAH fluorescence. The PE-LS55 Luminescence spectrometer was used to record the emission spectra between 240 and 600 nm using a excitation wavelength range between 240 and 500 nm with 15 nm increment of each step. The spectro-fluorescence feature of the oil sample is illustrated in figure 3. From the EEM, there is an emission peak at 425 nm excited at the wavelength between 260 and 300 nm. This fluorescence emission signature is from PAHs of the oil sample excited at these wavelengths when compared against constituent PAH EEMs (Dartnell et al., 2012).
Figure 3. The EEM generated for the weathered crude oil sample. The fluorescence intensity is shown on the right hand side of the EEM on a Log10 scale.
In order to explore the detailed fluorescence features of PAHs at an excitation wavelength of 285 nm, a fluorescence emission intensity plot was produced together with its reflectance spectrum illuminated using a Solux light source, which is presented in figure 4.
absorption at 430 nm and a higher reflectance value (above 0.5%) at 535nm.
Figure 4. Fluorescence and reflectance spectra of PAHs, the first y-axis on the left hand side of the plot corresponds to the red line, and the second y-axis on the right hand side corresponds to the blue line. The red solid line exhibits the fluorescence emission of PAHs using excitation at a wavelength of 285 nm. The blue solid line shows the reflectance from the same sample that is illuminated by a Solux light source. The blue dashed curve is a noise signal due to the poor capability of the spectrometer to measure reflectance in the UV region.
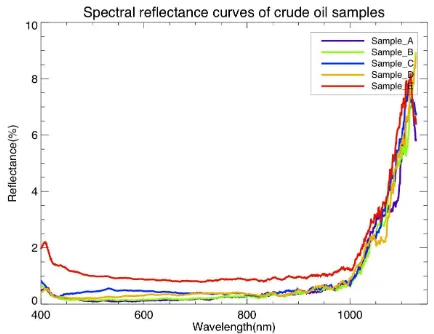
In order to examine the reflectance features of different crude oil samples, the spectral reflectance measurements were performed. Due to the large noise component in the UV region, reflectance data are only shown from 400 nm up to the near infrared (NIR); see figure 5.
Figure 5. Spectral reflectance plot of five different crude oil samples.
As shown in figure 5, all the oil samples have a very low reflectance at visible (VIS) region of spectrum; value below 2%. Although reflectance increases at longer wavelengths, spectral features are hardly observed at this VIS-NIR region. The steep increase in reflectance after 1000 nm suggests that oil seepages or spills may be more detectable at these higher wavelengths.
4. DISCUSSION
This report described experimental fluorescence and reflectance measurements of seawater containing cyanobacteria and crude oil samples. From spectro-fluoresence measurements, the fluorescence properties of cyanobacteria cellular pigments (PC and Chl-a) were obtained along with other two chemical substances (Trp and NADPH) that contribute to their total fluorescence emission. Also, PAHs within crude oil have fluorescence features. Whereas it was not possible to easily measure the reflectance of crude oil between 400 and 900 nm due to its high absorption, above 1000 nm the reflectance increases rapidly.
Although the capability of cyanobacteria to degrade crude oil has been shown by many researchers, none of these are observed in situ in marine environments. Also, other non-photosynthetic bacteria such as Alcanivorax borkumensis are reported capable of degrading crude oil in the sea but these bacteria species do not live in the upper mixed layer of the marine water column but rather down at 1.5 km depth instead. However, other phytoplankton species form surface blooms and hence biogenic slicks. Therefore, theoretically cyanobacteria are able to degrade crude oil in marine environments, and so it is worthwhile looking for this behaviour from cyanobacterial blooms in situ. Satellite remote sensing is one of the most promising techniques that can perform this. However, mapping oil spills on the sea surface using optical satellite imagery is difficult as there is poor visibility in the VIS-NIR region and the signal becomes much stronger in sunglint regions where the signature is akin to that seen in Synthetic Aperture Radar (SAR) imagery.
Differentiation of biogenic slicks versus oil slicks could be undertaken using fluorescence emission if the signal is sufficiently strong to be detectable remotely. However, the laboratory results indicate that the thickness of the oil may limit the detection. Further investigation is needed in order to take these preliminary findings forward.
5. ACKNOWLEDGEMENTS
We would like to thank Therese Arredal Harvey of the Department of system ecology, Stockholm University and Petroleum & Environmental Geochemistry Group, Centre for Biogeochemical Research, University of Plymouth for providing us with seawater and crude oil samples. We would also like to thank UCL Institute of Origins for supporting of Lewis Dartnell and the Department of Structural and Molecular Biology, UCL for access to the PE LE-55 spectro-fluorimeter measurements.
REFERENCES
Abed, R.M.M. and Köster, J.. The direct role of aerobic heterotrophic bacteria associated with cyanobacteria in the degradation of oil compounds. Int Biodeterior Biodegrad (2005), 55, 29–37.
Cerniglia C.E., Biodegradation of polycyclic aromatic hydrocarbons. Biodegradation (1992) vol. 3 pp. 351-368
Cerniglia C.E., D.T. Gibson, C.V. Baalen, Oxidation of naphthalene by cyanobacteria and microalgae, J. Gen. Microbiol. 116 (1980) 495–500.
Dartnell et al. Complete fluorescent fingerprints of extremophilic and photosynthetic microbes. International Journal of Astrobiology (2010) vol. 9 (4) pp. 245-257
Dartnell et al. Degradation of Cyanobacterial Biosignatures by Ionizing Radiation. Astrobiology (2011) vol. 11 (10) pp. 997-1016.
Dartnell et al. Photostability and fluorescence-based detection of PAHs on the Martian surface. Meteoritics and Planetary Science (2012). In review
Green and Blough. Optical absorption and fluorescence properties of chromophoric dissolved organic matter in natural water. Limnol Oceanogr (1994) vol. 39 (8) pp. 1903-1916
Hoge et al. Inherent optical properties of the ocean retrieval of the absorption coefficient of chromophoric dissolved organic matter from fluorescence measurements. Limnol Oceanogr (1993) vol. 38 (7) pp. 1394-1402
Kahru M., Leppanen J., Rud O.. Cyanobacterial blooms cause heating of the sea surface. Mar Ecol-Prog Ser (1993) vol. 101 (1-2) pp. 1-7
Kahru, M., Using satellites to monitor large-scale environmental change in the Baltic Sea. In: Kahru, M., Brown,
C.W. (Eds.), Monitoring Algal Blooms: New Techniques for Detecting Large-Scale Environmental Change. Springer-Verlag, Berlin, (1997), pp. 43-61.
Mitsch W.J. The 2010 oil spill in the Gulf of Mexico: What would Mother Nature do? Ecological Engineering (2010) vol. 36 (12) pp. 1607-1610
Nieke et al. Light absorption and fluorescence properties of chromophoric dissolved organic matter (CDOM), in the St Lawrence Estuary (Case 2 waters). Cont Shelf Res (1997) vol. 17 (3) pp. 235-252
Steigenberger S, F Terjung, H-P Grossart & R Reuter, Blue-fluorescence of NADPH as an indicator of marine primary production. EARSeL eProceedings, 2004, 3(1), 18-25,
Steinbüchel, A., Füchtenbusch, B., Gorenflo, V., Hein, S., Jossek, R., Langenbach, S. and Rehm, B.H.A. Biosynthesis of polyesters in bacteria and recombinant organisms. Polymer Degrad Stabil (1997). 59, 177–182.
Whitton, B. A., Potts, M. Introduction to the Cyanobacteria. In: Ecology of Cyanobacteria: Their Diversity in Time and Space (Whitton, B. A., and Potts, M., eds) Kluwer Academic Publishers, Dordrecht, 2000