ANOMALY IDENTIFICATION FROM SUPER-LOW FREQUENCY
ELECTROMAGNETIC DATA FOR THE COALBED METHANE DETECTION
S.S. Zhao a, N. Wang a, J. Hui a, X. Ye a, Q. Qin a,*
a Institute of Remote Sensing and Geographic Information System, School of Earth and Space Sciences, Peking University, Beijing, China
Email: [email protected], [email protected], [email protected], [email protected], [email protected]
Commission VIII, WG VIII/5
KEY WORDS: Electromagnetic, Super Low Frequency, Coalbed Methane, non-Gaussian, Class B model, Least Square Gradient, Adaptive filter
ABSTRACT:
Natural source Super Low Frequency(SLF) electromagnetic prospecting methods have become an increasingly promising way in the resource detection. The capacity estimation of the reservoirs is of great importance to evaluate their exploitation potency. In this paper, we built a signal-estimate model for SLF electromagnetic signal and processed the monitored data with adaptive filter. The non-normal distribution test showed that the distribution of the signal was obviously different from Gaussian probability distribution, and Class B instantaneous amplitude probability model can well describe the statistical properties of SLF electromagnetic data. The Class B model parameter estimation is very complicated because its kernel function is confluent hypergeometric function. The parameters of the model were estimated based on property spectral function using Least Square Gradient Method(LSGM). The simulation of this estimation method was carried out, and the results of simulation demonstrated that the LGSM estimation method can reflect important information of the Class B signal model, of which the Gaussian component was considered to be the systematic noise and random noise, and the Intermediate Event Component was considered to be the background ground and human activity noise. Then the observation data was processed using adaptive noise cancellation filter. With the noise components subtracted out adaptively, the remaining part is the signal of interest, i.e., the anomaly information. It was considered to be relevant to the reservoir position of the coalbed methane stratum.
1. INTRODUCTION
The passive Super Low Frequency (SLF) detection is a new remote sensing technique which explores the subsurface electrical structure utilizing the natural alternating electromagnetic field. It enlarges the earth observation range as a complementary waveband with exploring deep anomalies that are beyond those easily attainable in optical/infrared/micro wavebands. It is of great value as the electromagnetic signal provides fully detailed geological information in geological exploration(I.J. Won, 1980), and this technique has been widely applied in many fields like oil and gas exploration, volcanic geology and geothermal energy. Coalbed methane is an unconventional energy sorted as clean resources.( Tim A. Moore,2012) Its exploitation has been paid more and more attention. In 1980s, America became the first country to develop coalbed methane. And other countries like Canada, German, France, Russia ,etc. began this work in succession . In China, the methane resource is abundant, however, there exist three typical characteristics--low pressure, low permeability ,low saturated , enhancing the difficulties and increasing the cost in conventional prospecting methods. In comparison, the super-low frequency electromagnetic prospecting method could not be shielded by the high resistance layer and has higher resolution with much lower cost. The paper provides a new way to extract the anomaly correlated with the coalbed methane with the prospecting method of Super-low frequency electromagnetic. The electromagnetic field signal is very weak, and has a great dynamic range. The signal is always submerged by various noise including background field, human activity, systematic
and random noise, and it makes the information extraction very difficult. The data acquired is interfered by various noise ,like background field, human activity, systematic and random noise. The data was viewed as non-Gaussian and non-stationary. Middileton has done a lot of research on natural source electromagnetic signal. He described the signal by several models-class A, class B, class C(Middileton, 1977). In our research, class B model could be much more appropriate to build our data model. It is caused by spike pulse, for instance, the lighting, and has much relationship with human activities. To analyse the statistical property, the non-normal distribution test and the amplitude probability distribution curve of experimental data and probability distribution of Class B model fitting was done. The Class B noise model require six parameters, which are deduced from measurement data using the Least Square Gradient Method(LSGM). The APD(a posteriori probability distribution) and pdf(probability densities function )are obtained which are canonical(Middleton, 1979). In this paper, we built a signal-estimate model for SLF electromagnetic signal and processed the monitored data with adaptive filter. Therefore, the amplitude probability model can well describe the statistical properties of SLF electromagnetic data. To estimate the parameters of Class B model with high efficiency is particularly important, and Class B model parameter estimation is very complicated because its kernel function is confluent hypergeometric function. The parameters of the model were estimated based on property spectral function using Least Square Gradient Method(LSGM). The simulation of this estimation method was carried out, and the results of simulation demonstrated that the LGSM estimation method can
* Corresponding author
The International Archives of the Photogrammetry, Remote Sensing and Spatial Information Sciences, Volume XLI-B8, 2016 XXIII ISPRS Congress, 12–19 July 2016, Prague, Czech Republic
This contribution has been peer-reviewed.
reflect important information of the Class B signal model including Gaussian Component, Rare Event Component and Intermediate Event Component. The Gaussian component was considered to be the systematic noise and random noise, and the Intermediate Event Component was considered to be the background ground and human activity noise. It is known that natural source electromagnetic signal is weak, and how to extract useful information has drew great attention worldwide. With the rapid development of modern signal processing recently, the signal processing theory and methods have been widely used in radar, sonar, and geophysics, mechanical engineering, etc.. With the enlargement of the application area, it’s requiring to study the non-stationary, non-Gaussian signal, and time-varying, non-causal, non-minimum phase, the nonlinear system, which are research focus in the modern signal processing. For instance, using the time-frequency distribution and wavelet transform to study non-stationary signal; using high order statistics analysis to research non-Gaussian signal, etc.( Hong,2001)In order to filter out the noise signal and extract the signal of interest. The adaptive filter was chose to process the signal. The theory of adaptive filter is developed from a series of linear filters like wiener filter and kalman filter(Olsen,1992). It has been widely used in many applications like communication, system identification, echo cancellation ,speech linear prediction, etc. for its stronger adaptability and better filtering performance(Diniz, P. S. ,2008). With the observation data processed using adaptive noise cancellation filter, which is a variation of optimal filtering applied in the fields of non-stationary signal processing, we modelled the relationship between the noise reference and the component of the measured signal in an iterative manner.
2. SIMULATION AND DATA PROCESSING
2.1 Data Verification
In order to illustrate the distribution characteristic of the SLF noise data, the probability densities distribution is shown in figure 1, which showed that the SLF signal is not consistent with the characteristics of the Gaussian distribution.
Figure 1 the probability densities of the SLF data
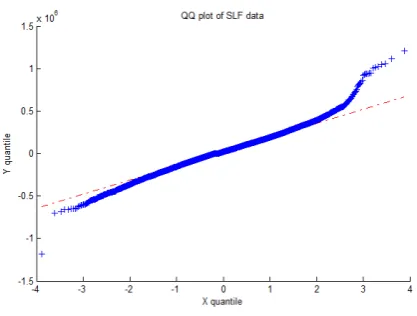
The QQ-plot of it is depicted in figure 2. The heavy-tailed part in figure 2 verified that the SLF electromagnetic data we studied is non-Gaussion distribution. Therefore, the non-normal distribution test showed that the distribution of the signal was obviously different from Gaussian probability distribution.
Figure 2 the non-Gaussian verification of SLF data
2.2 Class B Mode
As deduced in Middleton’s work (Middleton, 1972), the Class B signal model involves Gaussian Component, Rare Event Component and Intermediate Event Component. The pdf of Class B model has very complicated forms, but its cfs is much simple. So the Class B model can be given as below (Yuzhong Jiang,2014): Hypergeometric Function; Aαis the intermediate Event Impulse Index; α is the Spatial Density Propagation Parameter and the
is normalizing factor.We take x = { x0, x1, … , xN-1} as the noise sample of Class B
model, of which the parameters λ= α, Aα,M T is left to be
confirmed.
The CF of the noise model is set as(
D. Middleton, 1986):
(2)
It is viewed as the theoretical value. We view the mean value of the sample data as the experimental value:
(3) So the error function is defined as (Yuzhong Jiang,2014):
The was minimized to estimate the parameters of
Class B model , where the is defined as :
(4)
LGSM was used as the algorithm to estimate the
The International Archives of the Photogrammetry, Remote Sensing and Spatial Information Sciences, Volume XLI-B8, 2016 XXIII ISPRS Congress, 12–19 July 2016, Prague, Czech Republic
This contribution has been peer-reviewed.
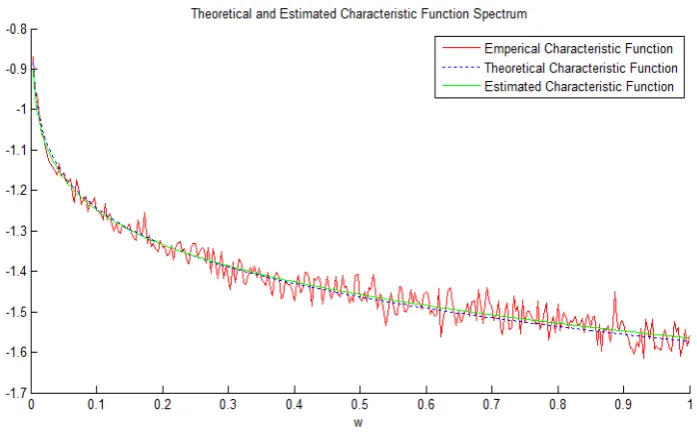
Figure 3 the comparison of theoretical, empirical and estimated characteristic function
Figure 4 the adaptive filtering results
The International Archives of the Photogrammetry, Remote Sensing and Spatial Information Sciences, Volume XLI-B8, 2016 XXIII ISPRS Congress, 12–19 July 2016, Prague, Czech Republic
This contribution has been peer-reviewed.
canonical model parameters. The gradient matrix is as follows:
(5)
In every regularization step, the (6)
(6)
is calculated and the is updated until the
is smaller than expected error value.
The simulation results is shown in figure3, where there are the empirical characteristic function , the theoretical characteristic function and the estimated characteristic function.
2.3 Adaptive Filter
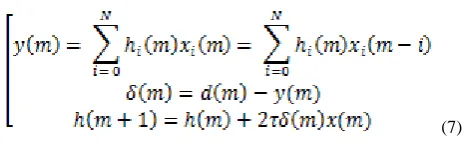
Then we filter the noise according the built noise model using adaptive filter. During the process, the input signal was set as the observed signal with the noise, and the reference signal was set as the estimated noise model. The iteration is defined as:
(7)
2.4 Data Processing
The field data with noise is filtered with adaptive filter where the Class B model data is as an reference data. The processing results is shown in figure 4.
3. RESULTS AND CONCLUSION
From the results shown in figure 4, figure 4.1 and 4.2 is the time and frequency domain amplitude of Class B model data. Figure 4.3and figure 4.4 is the time and frequency domain amplitude field data. We can come to the conclusion that the noise is filtered out effectively, leaving the signal of interest in figure 4.5 and figure 4.6. i.e., the anomaly information. It was considered to be relevant to the reservoir position of the coalbed methane stratum. This method was then applied in coalbed methane detection to extract anomalies of electromagnetic radiation and analyse the correlation between the extracted information and the reservoirs’ stratum and capacity. Qinshui Basin was used as our study area, and the results showed that the characteristics of the CBM reservoirs were consistent with the local geological data.
ACKNOWLEDGEMENTS (OPTIONAL)
This work was supported by the National Science and Technology Major Project of China (2011ZX05034).
REFERENCES
Won, I. J. ,1980. A wide-band electromagnetic exploration method—some theoretical and experimental results. Geophysics, 45(5), 928-940.
Moore, T. A. 2012. Coalbed methane: a review. International Journal of Coal Geology, 101(6), 36-81.
D. Middleton, 1977. Statistical-physical models of electromagnetic interference. IEEE Transactions on Electromagnetic Compatibility, emc-19(3), 106-127.
D. Middleton, 1979. Procedures for Determining the Parameters of the First-Order Canonical Models of Class A and Class B Electromagnetic Interference. IEEE Transactions on Electromagnetic Compatibility, EMC-21(3), 190–208.
Hong, I. E., Jian, Z. H. A. O., & Hua, Q. I. ,2001. Study on signal detection method in non - gaussian noise using higher - order statistics, 1–5.
Olsen, Kim Bak, and Gerald W. Hohmann,1992. Adaptive noise cancellation for time-domain EM data. Geophysics 57.3, 466-469.
Diniz, P. S. ,2008. Adaptive filtering : algorithms and practical implementation. Kluwer Academic Publishers.
D. Middleton. ,1972. Statistical-physical models of urban radio-noise environments - part i: foundations. Electromagnetic Compatibility IEEE Transactions on, EMC-14(2), 38-56
Yuzhong Jiang,2014. Non-Gaussian Noise Model of Extremely low Frequency Channel and its application[M].Beijing: National Defence Industry Press
D. Middleton, 1986. A Tutorial Review of Elements of Weak Signal Detection in Non-Gaussian EMI Environments.
The International Archives of the Photogrammetry, Remote Sensing and Spatial Information Sciences, Volume XLI-B8, 2016 XXIII ISPRS Congress, 12–19 July 2016, Prague, Czech Republic
This contribution has been peer-reviewed.