NEAR REAL-TIME DETERMINATION OF EARTHQUAKE SOURCE PARAMETERS
FOR TSUNAMI EARLY WARNING FROM GEODETIC OBSERVATIONS
Sunanda Manneelaa*, T. Srinivasa Kumara, Shailesh R. Nayakb a
Indian National Centre for Ocean Information Services, Hyderabad, India - (sunanda, srinivas)@incois.gov.in b
Ministry of Earth Sciences, Govt. of India, New Delhi, India - [email protected]
Commission VIII, WG VIII/1
KEY WORDS: earthquake, tsunami, ITEWS, GPS, inversion, moment magnitude, tsunami warning, numerical modelling
ABSTRACT:
Exemplifying the tsunami source immediately after an earthquake is the most critical component of tsunami early warning, as not every earthquake generates a tsunami. After a major under sea earthquake, it is very important to determine whether or not it has actually triggered the deadly wave. The near real-time observations from near field networks such as strong motion and Global Positioning System (GPS) allows rapid determination of fault geometry. Here we present a complete processing chain of Indian Tsunami Early Warning System (ITEWS), starting from acquisition of geodetic raw data, processing, inversion and simulating the situation as it would be at warning center during any major earthquake. We determine the earthquake moment magnitude and generate the centroid moment tensor solution using a novel approach which are the key elements for tsunami early warning. Though the well established seismic monitoring network, numerical modeling and dissemination system are currently capable to provide tsunami warnings to most of the countries in and around the Indian Ocean, the study highlights the critical role of geodetic observations in determination of tsunami source for high-quality forecasting.
* Corresponding author
1. INTRODUCTION
1.1 The Indian Tsunami Early Warning Centre
The Indian mainland and Islands are located in a zone of significant seismic activity, where many earthquakes and accompanying tsunamis have been observed and recorded. The two subduction zones, the Andaman-Nicobar-Sumatra island arc and the Makran region have been identified as tsunamigenic zones in the Indian Ocean based on historical tsunamis, earthquakes, and their locations on fault lines.
A great shallow foci earthquake of magnitude Mw 9.2 occurred on 26 December 2004 on Andaman-Sumatra subduction zone and generated a massive tsunami that caused extensive destruction all along the Indian mainland and Andaman & Nicobar Islands. In response, India has successfully set up a tsunami warning centre at Indian Ocean at Indian National Centre for Ocean Information Services (INCOIS), Hyderabad. Since its inception in October 2007 till April 2016, the Indian Tsunami Early Warning Centre (ITEWC) successfully monitored 502 earthquakes of M ≥ 6.5, out of which 83 were in the Indian Ocean region (both on land and under-sea). For all these major events in the Indian Ocean, timely advisories were generated based on estimated time of wave arrivals & wave heights and later revised based on water level observations and informed the stake holders through subsequent bulletins. This approach avoided false alarms and unnecessary evacuations of people from the coastal areas.
Though the awareness has been increased dramatically, among the public after 2004 tsunami, still we hear about death tolls caused by tsunamis. One of the most critical aspects of tsunami warning system is the quick estimation of earthquake
parameters with reasonable accuracy in shortest possible time. The consequences of diametrically opposite behaviours of large earthquakes, in terms of tsunamis, in the recent times (Tohoku-oki (2011) in the Pacific and Northern Sumatra (2012) in the Indian Ocean) demand the development of modern and robust tsunami early warning systems.
Monitoring the crustal deformation in real-time makes it feasible to achieve rapid estimation of actual earthquake scales, since the measured permanent displacement directly gives us the true size of the earthquake by seismic moment, which in turn, can be used for tsunami warning. The real-time deformation monitoring technique is based on near-field Global Position System (GPS) to study co-seismic displacements. Using coastal GPS stations data near the epicenter, the new method estimates the energy transferred by undersea earthquake to the ocean to generate tsunami (Sobolev et al., 2006). Recent analysis showed that by using GPS displacements, it is possible to calculate how far the stations moved because of the quake and that in turn helped in deriving an earthquake’s true size, called moment magnitude. This magnitude is directly related to earthquake’s potential for generating tsunamis (Blewitt et al., 2009; Singh et al., 2012). This method allows the rapid estimation of seismic moment tensor solutions and the earthquake source determination in a shortest possible time compared to the traditional approaches.
1.2 Background & General approach
The conventional method of estimating tsunamigenic potential of an earthquake involves two main steps: First, Estimating the earthquake magnitude using seismic inversion method. Second, observing the sea level changes using Bottom Pressure Recorders (BPRs) and Tide gauges. The drawback of this The International Archives of the Photogrammetry, Remote Sensing and Spatial Information Sciences, Volume XLI-B8, 2016
XXIII ISPRS Congress, 12–19 July 2016, Prague, Czech Republic
This contribution has been peer-reviewed.
method is, it takes few minutes to hours for accurate estimation of magnitude, Mw, which is directly related with displacement. And moreover Earthquake magnitude is not always a reliable indicator of tsunami potential. For example, the 11 March 2011 Tohoku-oki earthquake of magnitude Mw 9.0 was initially underestimated by Japan Meteorological Agency (JMA), which is inarguably one of the very advanced and well experienced centres for Earthquake Early Warnings as well as for Tsunami Early Warnings. The earthquake detection centers elsewhere also estimated much lower magnitudes (Mw 7.9 – 8.0) for this event initially. The magnitude of the earthquake was underestimated at least by an order one to two (M 7.2 after 8.6 sec and revised to M 8.1 after 116.8 sec) (Hoshiba et al., 2011), which in turn underestimated the expected tsunami wave height as 3.0 m – 6.0 m. But in reality, the sudden sea-floor displacement generated a massive tsunami that overtopped the tsunami protection walls and broke through as far as 10.0 km inland along the coast. Though JMA could issue the warnings within 3 minutes unfortunately, that was based on the gross under estimation of the earthquake magnitude (8.6 M instead of 9 M). The accurate estimate of size of the earthquake could have resulted in an accurate estimate of tsunami wave height. The actual wave height reported from the adjacent areas of Tohoku was 39.7 m at Miyako.
On the other hand, in the case of Northern Sumatra earthquake of magnitude Mw 8.5 on 11 April 2012 only a small ocean-wide tsunami (~30 cm at Sabang, Indonesia) was generated in contrast to the estimated wave heights of 6.0 – 8.0 m initially. Later when more data became available, it was realized that that was a strike-slip earthquake though the magnitude was higher. The strike-slip earthquake generates very little or no motion of ground in vertical and hence avoids the sudden disturbance of water column essential for the generation of tsunami. Similar was the case with the earthquake (8.6 M) on 28 March 2005 in Nias, Indonesia. That event too did not generate a sizable tsunami as expected. Rather, it generated a relatively small tsunami that caused very little damage (Konca et al., 2007).
To overcome such difficulties and to understand the fault geometry that governs the tsunamis, it is essential to estimate the seismic moment tensor solutions. However, the moment tensor solution estimate requires larger amount of data that becomes available only after certain amount of time. Longer wait for sufficient data to make a decision at the warning centre is unfeasible as the warning centre is expected to provide warnings at the earliest. Often the procedure to predict tsunami wave height and travel time depends on the worst cases represented by pure dip slip reverse fault mechanisms and they might overestimate the cases that deviate from such scenarios, especially the strike-slip cases.
2. ESTIMATION OF SOURCE PARAMETERS USING GEODETIC OBSERVATIONS
Monitoring the crustal deformation in real-time makes it feasible to achieve rapid estimation of actual earthquake scales, since the measured permanent displacement directly gives us the true size of the earthquake by seismic moment, which in turn, can be used for tsunami warning. The real-time deformation monitoring technique is based on near-field Global Position System (GPS) to study co-seismic displacements. Using coastal GPS stations data near the epicenter, the new method estimates the energy transferred by undersea earthquake to the ocean to generate tsunami (Sobolev et al., 2006). Recent analysis showed that by using GPS displacements, it is possible
to calculate how far the stations moved because of the quake and that in turn helped in deriving an earthquake’s true size, called moment magnitude. This magnitude is directly related to earthquake’s potential for generating tsunamis (Blewitt et al., 2009; Singh et al., 2012). This method allows the rapid estimation of seismic moment tensor solutions and the earthquake source determination in a shortest possible time compared to the traditional approaches.
2.1 Data
The GPS stations operated by the GPS Earth Observation Network (GEONET) of Japan recorded the deformation caused by the 11 March 2011 Tohoku earthquake. To generate static solutions we used GAMIT/GLOBK software package (Herring et at., 2005; King and Bock, 2005). Also, we have taken the processed data from the Advanced Rapid Imaging and Analysis (ARIA) project at the NASA Jet Propulsion Laboratory and Caltech (Owen et al., 2011), which indicated large-scale ESE seaward displacements as large as 5.2 m horizontally and 1.1 m vertically downward. These data indicated a very large coseismic rupture offshore and were subsequently validated by later available seafloor geodetic observations using the GPS/acoustic combination technique at five sites, which measured between 5 and 24 m of east-southeast horizontal displacements for moment tensors at grid points representing virtual sources distributed over a region. At each station, the data ‘u’ are represented as the convolution of the Green’s Function tensor, G, describing the displacement propagation between the source and the receiver and the moment tensor components ‘m’ of the source. We extract the Green’s Functions using EDGRN/EDCMP (Wang et al., 2003) from the output and set up the kernel matrix G for the inversion
ui k
= Gkij mj; (1) where i = x , y, z; j = 1, 2, 3, 4, 5 ; k = 1, 2, …. N
The least square solution is obtained by
M = (GTG)-1 GT u (2)
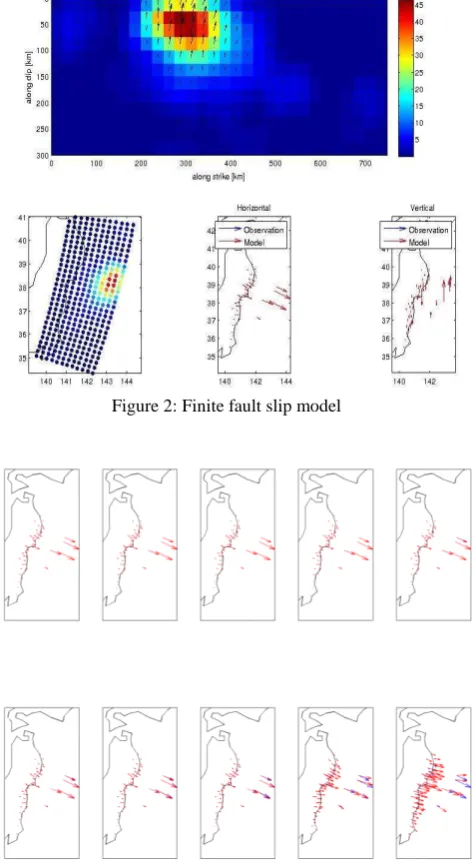
Where (GTG)-1 GT matrix for each point source can be computed in advance knowing a priori the grid distribution and the set of pre-selected GPS stations at that location. However, we apply weighting based on distance from the source to the receiver. An additional weighting is applied based on displacement at each of the station. The inversion is performed when we have significant coseismic displacements at least from four GPS stations in case of real-time scenario to avoid false alarming and the inversion is restricted to deviatoric matrix such that Moment Tensor ‘M’ is composed of only five components. The inversion method solves for the hypocentre, strike, dip and rake and magnitude of the event using the coseismic displacements as outlined in Melgar et al. 2012. The type of faulting and geographical extent of rupture are determined by finite fault slip model (Figure2) (Crowell et al., 2012) while The International Archives of the Photogrammetry, Remote Sensing and Spatial Information Sciences, Volume XLI-B8, 2016
XXIII ISPRS Congress, 12–19 July 2016, Prague, Czech Republic
This contribution has been peer-reviewed.
calculating the finite extent CMT solution. The seismic moment Mo is computed using scaled Frobenius norm of the MT (Silver et al., 1982) and estimate moment magnitude (Mw) using the Hanks & Kanamori, 1979 relationship.
(3)
Figure 1: Results of observation vs sythetic displacements for a test case
The most important implication of new methodology is the speed with which we can obtain the basic earthquake source parameters compared with traditional seismic methods.
However, it is beneficial to have prior knowledge of the geometry of the subduction zone in case of real-time scenario. In such case, the relevant segment of the slab is extracted from the regional model based on the moment release of the finite extent CMT. For major earthquakes such as of magnitude ≥ 8, we invert for moment tensors only at the grid points that are distributed in the slab. This significantly lowers the number of calculations and permits us to focus on the most hazardous region of the grid. It is then possible to consider earthquake scenarios in advance and to invert for them in real-time.
3. CASE STUDY: THE 2011 TOHOKU-OKI EARTHQUAKE
To test the approach, we apply the proposed methodology to the great earthquake of March 11, 2011 at Tohoko-Oki, Japan. The megathrust earthquake ruptured the entire width of the offshore of northeastern Japan, producing many geophysical observations that have been rapidly analyzed to constrain the rupture process. Over 400 high‐rate three‐component GPS estimated ground motion time series were made available courtesy of GPS‐Solutions. The ground motion records were obtained from 1Hz GEONET data, provided by the Geospatial Information Authority of Japan (GSI). For this great earthquake, the proposed method is very stable and provides a robust centroid locations and focal mechanism estimates. The obtained results are compared with ARIA solutions to evaluate final solution. Green’s Functions were computed from EDGRN on a 10 km horizontal and vertical grid using four layer velocity model. The results of applied methodology and Global CMT solution are compared in Table 1.
Parameter With Proposed approach
Global CMT Solution
Lat/Lon 38.281N 142.672E 37.52N 143.05E
Depth 25 km 20 km
Magnitude 9.0 9.1
Fault plane solution
NP1: Strike 29; Dip 77; Slip 95; NP2: Strike 187; Dip 14; Slip 68;
NP1: Strike 203; Dip 10; Slip 88; NP2: Strike 25; Dip 80; Slip 90;
Table 1: Comparison of new approach and Global CMT
In this test case of Tohoku-oki earthquake, regional 3D slab model for the subduction zone is established as priori from Hayes et al. (2012). With this approach model is determined at 157 s (Figure 3) after earthquake origin time (Melgar et al., 2013b) and in the timeline of warnings provides the first estimate of the slip distribution.
Figure 2: Finite fault slip model
Figure 3: Inversion at time stamp at every 20 seconds The International Archives of the Photogrammetry, Remote Sensing and Spatial Information Sciences, Volume XLI-B8, 2016
XXIII ISPRS Congress, 12–19 July 2016, Prague, Czech Republic
This contribution has been peer-reviewed.
4. CONCLUSION
As illustrated above, traditional methods of earthquake magnitude estimation only based on seismic data and the prediction of tsunami wave heights can go wrong if the earthquake mechanism is not taken in account in addition to its magnitude. This is more serious for near source regions like Andaman and Sumatra coast as they lie very close to the subduction zone and the available time for warnings and response are too short. This was precisely the limitation faced during the 2011 Tohoku earthquake and the 2012 Northern Sumatra earthquake that necessitated the development of new tools and techniques for determining the true size of an undersea earthquake and the actual displacement of ground. Such techniques call for receiving and analyzing data from multiple sensors like seismometers, GPS sensors, strong motion sensors, etc. in real time.
Here we prove that near-source real-time GPS measurements fill an important gap for early earthquake detection, characterization, and rapid response for major and great earthquakes where significant fault rupture occurs and tsunamigenic potential exists. The Inverse Method performs better for the Tohoku-Oki earthquake and has the benefit of requiring no a priori information on fault geometry, making it the ideal method in complex tectonic environments such as Sunda subduction zone. We obtained sensible results for the example case in terms of slip, magnitude, and rake estimates and an order of magnitude improvement compared to existing seismic methods for monitoring large earthquakes in the near field, thereby allowing for more effective earthquake response and tsunami warning.
REFERENCES
Blewitt G, William C. Hammond, Corne Kreemer, Hans –Peter Plag, Seth Stein, Emile Okal, GPS for real- time earthquake source determination and tsunami warning systems, J Geod (2009).
Bock, Y., D. Melgar, and B. W. Crowell (2011), Real-time strong-motion broadband displacements from collocated GPS and accelerometers, Bull. Seismol. Soc. Am., 101, 29042925, doi:10.1785/0120110007.
Crowell, B. W., Y. Bock, and D. Melgar (2012), Real-time inversion of GPS data for finite fault modeling and rapid hazard assessment, Geophys. Res. Lett., 39, L09305, doi:10.1029/2012GL051318.
Hayes, G. P., D. J. Wald, and R. L. Johnson (2012), Slab1.0: A three dimensional model of global subduction zone geometries, J. Geophys.Res., 117, B01302, doi:10.1029/2011JB008524.
Herring TA, King R, McClusky S (2006), GAMIT Reference Manual release 10.3 Report Massachusetts Institute of Technology Cambridge MA.
Hoshiba, M., K. Iwakiri, N. Hayashimoto, T. Shimoyama, K. Hirano, Y. Yamada, Y. Ishigaki, and H. Kikuta (2011), Outline of the 2011 off the Pacific coast of Tohoku earthquake (Mw 9.0) Earthquake early warning and observed seismic intensity,
Earth Planets Space, 63, 547 551,
doi:10.5047/eps.2011.05.031.
Kanamori, H., and L. Rivera (2008), Source inversion of W phase: speeding up seismic tsunami warning, Geophys. J. Int.,175, 222238, doi:10.1111/ j.1365-246X.2008.03887.
King RW and Bock Y (2005) Documentation for the GAMIT GPS processing software release 10.2 Massachusetts Institute of Technology Cambridge MA.
Konca, A.O. V. Hjorleifsdottir, T.-R. A. Song, J.-P. Avouac, D. V. Helmberger, C. Ji, K. Sieh, R. Briggs, and A. Meltzner, Rupture Kinematics of the 2005 Mw 8.6 Nias–Simeulue Earthquake from the Joint Inversion of Seismic and Geodetic Data, Bull. Seismol. Soc. Am., Vo. 97, No.1A, ppS307-S322, January 2007, doi. 10.1785/0120050632
Melgar, D., Y. Bock, and B. W. Crowell (2012), Real-time centroid moment tensor determination for large earthquakes from local and regional displacement records, Geophys. J. Int., 188, 703–718, doi:10.1111/ j.1365-246X.2011.05297.x.
Melgar, D., B. W. Crowell, Y. Bock, and J. S. Haase (2013), Rapid modeling of the 2011 Mw 9.0 Tohoku-oki earthquake with seismogeodesy, Geophys. Res. Lett., 40, doi:10.1002/grl.50590.
Sato, M., T. Ishikawa, N. Ujihara, S. Yoshida, M. Fujita, M. Mochizuki, and A. Asada (2011), Displacement above the hypocenter of the 2011Tohoku-oki earthquake, Science, 332, 1395, doi:10.1126/science.1207401.
Singh S.K., X. Perez- Campos, A. Iglesias, D. Melgar, A Method for Rapid Estimation of Moment Magnitude for Early Tsunami Warning Based on Coastal GPS Networks, Seismological Research Letters , Volume 83, Number 3 May/ June 2012.
Sobolev S.V., A.Y. Babeyko, R. Wang, Galas M. Rothacher, D.Sein, J. Lauterjung and C. Subarya,Towards Real – Time Tsunami Amplitude Prediction, Eos, Vol. 87, No. 37, 12 September 2006
The International Archives of the Photogrammetry, Remote Sensing and Spatial Information Sciences, Volume XLI-B8, 2016 XXIII ISPRS Congress, 12–19 July 2016, Prague, Czech Republic
This contribution has been peer-reviewed.