Evaluation of Forest Canopy and Understory Gap Fraction Derived from Terrestrial Laser
Scanning
K. C. Chen a and C. K. Wang b
a Dept. of Geomatics, National Cheng Kung University, No.1, University Road, Tainan City 701, Taiwan (R.O.C.) - [email protected]
a Dept. of Geomatics, National Cheng Kung University, No.1, University Road, Tainan City 701, Taiwan (R.O.C.) - [email protected]
Commission WG VII/7
KEY WORDS: Forest structure, Understory, Gap fraction, Terrestrial laser scanner
ABSTRACT:
The quantification of forest carbon sequestration is helpful to understand the carbon storage on the Earth. The estimation of forest carbon sequestration can be achieved by the use of leaf area index (LAI), which is derived from forest gap fraction. The hemispherical image-based technique is the most popular non-destructive means for obtaining such information. However, only the gap fraction of the top canopy is derived due to the limitation of imaging technique. The gap fraction information of understory is thus neglected. In this study, we evaluate the use of a terrestrial laser scanner (TLS) to obtain the forest canopy and understory gap fraction. The forest TLS data were manually classified as the top canopy and understory layers to facilitate the estimation of top canopy and understory gap fraction, respectively.
1. INTRODUCTION
Past studies have demonstrated the use of Terrestrial Laser Scanning (TLS) to produce fisheye image, which can be used for the estimation of forest canopy gap fraction (Morsdorf et al. 2006, Danson et al. 2007, Zhao and Popescu 2009, Ramirez et al. 2013, Zheng et al. 2016). The gap fraction information can then be further used to derive leaf area index and also forest carbon sequestration.
The purpose of this paper is to classify the TLS point data into three different vertical layers, i.e., canopy layer, understory layer, and forest floor layer. The TLS points of canopy layer and understory layer were then, respectively, processed to produce fisheye images for the computation of gap fraction.
2. DATA
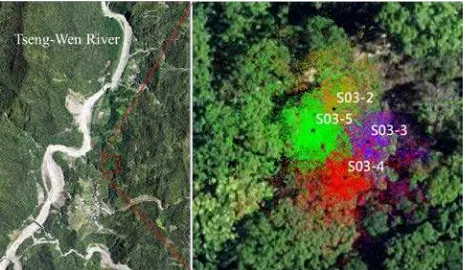
A study area of 15 m × 15 m, located at upstream of Tseng-Wen River in Chiayi County, Taiwan, was scanned in April and August 2014 with a Z+F IMAGER® 5010 unit. The dominate trees in the study area are Cinnamomum camphora, Vernicia fordii, and Bischofia jabanica. Four wood benchmarks were installed in the field to guide the TLS scan locationa. So, the scan stations were the same for two different months. Figure 1 shows the location of the study area and the arrangement of the TLS scans, overlaid on an orthophoto with a resolution of 20 cm.
The Z+F IMAGER® 5010 TLS has a beam divergence of 0.3 mrad, detectable range of 0.3 m to 187 m, and a field of view of 320° × 360°.
Figure 1. (a) The location map of the study area in Tseng-Wen River. (b) Each colour denotes different TLS scan.
3. METHODOLOGY
3.1 Manual Classification of TLS Point Data
The TLS points belonging to single trees were manually classified as tree class by iteratively identifying the cylinder-shaped tree truck feature (Figure 2(A)) and region growing, based on visual inspection, toward the upward or downward directions of the tree trunk. The height of tree truck were also used to further classify the trees as canopy layer or understory layer; where the former and latter are sometimes called the dominate tree and non-dominant tree, respectively (Figure 2(B)).
Because the leaves usually cluster in groups, the TLS points showed clustering pattern were first identified as leaves and then assigned, respectively, to the nearest tree, which belonged to the canopy layer or understory layer (Figure 2(C) and (D))
The International Archives of the Photogrammetry, Remote Sensing and Spatial Information Sciences, Volume XLI-B8, 2016 XXIII ISPRS Congress, 12–19 July 2016, Prague, Czech Republic
This contribution has been peer-reviewed.
Figure 2. (A) The identified tree trunk (orange colour). (B) Dominant and non-dominant trees identified in the TLS point data. (C) and (D) Classified TLS points where the tree trunk and leaves were correctly identified for canopy layer (purple colour)
and understory layer (green colour).
3.2 Gap fraction
To compute the gap fraction, the synthetic fisheye images were generated using the classified TLS point data follow Morsdorf et al. (2006), Danson et al. (2007), Alberto, et al. (2013). The gap fraction, , G(θ�), for the zenith angle of θ� were computed according to
G(θ�) = 1−�θ�
�θ� (1)
where �θ�= the number of fisheye image pixels with TLS point present at the zenith angle of θ�.
�θ�= the total number of fisheye image pixels at the zenith angle of θ�.
4. RESULT AND DISCUSSION
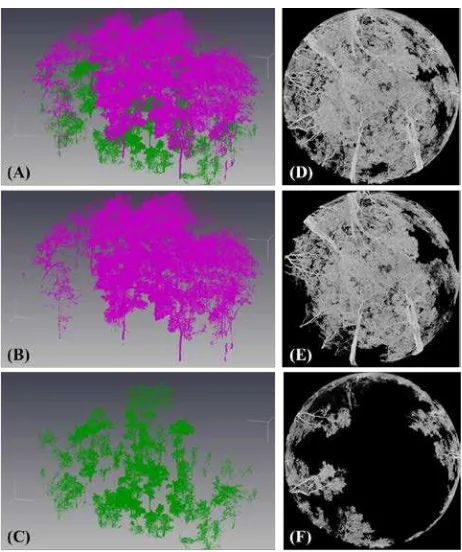
Figure 3(A) – 3(C) and 4(A) – 4(C) show the classified TLS point data for April and August 2014, respectively, where the canopy layer are denoted as purple and understory layer are denoted as green. Figure 3(D) – 3(F) show the synthetic fisheye images of canopy layer and understory layer, canopy layer, and understory layer for April 2014 data, respectively. Figure 4(D) – 4(F) show the same results for August 2014 data.
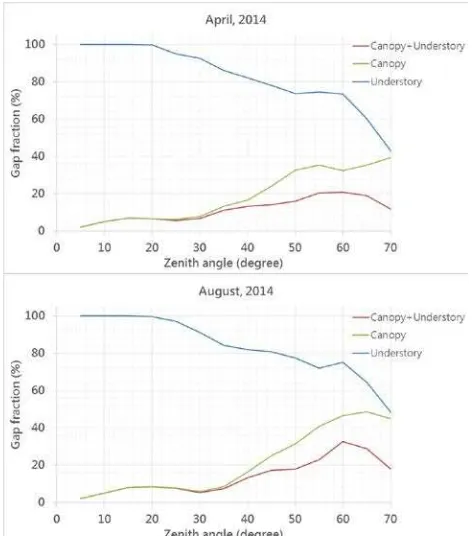
Figure 5(A) and 5(B) show the gap fraction of April and August 2014 data, respectively. The gap fraction derived from combined canopy and understory layer between April and August show significant difference for the zenith angles greater than 50 degree. Different pattern of gap fraction for canopy layer alone and understory alone are also significant between April and August 2014.
Figure 3. The classified TLS point and corresponding synthetic fisheye image for April 2014 data. (A) – (C) Canopy layer and understory layer were denoted as purple and green colours, respectively. (D) The synthetic fisheye image of canopy layer
and understory layer shown in (A). (E) The synthetic fisheye image of canopy layer shown in (B). (F) The synthetic fisheye
image of understory layer shown in (C).
Figure 4. The classified TLS point and corresponding synthetic fisheye image for August 2014 data. (A) – (C) Canopy layer and
understory layer were denoted as purple and green colours, respectively. (D) The synthetic fisheye image of canopy layer
and understory layer shown in (A). (E) The synthetic fisheye image of canopy layer shown in (B). (F) The synthetic fisheye
image of understory layer shown in (C).
The International Archives of the Photogrammetry, Remote Sensing and Spatial Information Sciences, Volume XLI-B8, 2016 XXIII ISPRS Congress, 12–19 July 2016, Prague, Czech Republic
This contribution has been peer-reviewed.
Figure 5. The gap fraction for (A) April and (B) August 2014 data.
REFERENCES
Danson, F. M., D. Hetherington, F. Morsdorf, B. Koetz and B. Allgower (2007). "Forest Canopy Gap Fraction From Terrestrial Laser Scanning." Geoscience and Remote Sensing Letters, IEEE 4(1): 157-160.
Morsdorf, F., B. Kötz, E. Meier, K. I. Itten and B. Allgöwer (2006). "Estimation of LAI and fractional cover from small footprint airborne laser scanning data based on gap fraction." Remote Sensing of Environment 104(1): 50-61.
Ramirez, F., R. Armitage and F. Danson (2013). "Testing the Application of Terrestrial Laser Scanning to Measure Forest Canopy Gap Fraction." Remote Sensing 5(6): 3037.
Zhao, K. and S. Popescu (2009). "Lidar-based mapping of leaf area index and its use for validating GLOBCARBON satellite LAI product in a temperate forest of the southern USA." Remote Sensing of Environment 113(8): 1628-1645.
Zheng, G., L. Ma, W. He, J. U. H. Eitel, L. M. Moskal and a. Z. Zhang (2016). "Assessing the Contribution of Woody Materials to Forest Angular Gap Fraction and Effective Leaf Area Index Using Terrestrial Laser Scanning Data." IEEE TRANSACTIONS ON GEOSCIENCE AND REMOTE SENSING 54(3): 13.
The International Archives of the Photogrammetry, Remote Sensing and Spatial Information Sciences, Volume XLI-B8, 2016 XXIII ISPRS Congress, 12–19 July 2016, Prague, Czech Republic
This contribution has been peer-reviewed.