www.elsevier.com / locate / econbase
Synchronization of price changes by multiproduct firms:
evidence from Canadian newspaper prices
*
Timothy C.G. Fisher, Jerzy D. Konieczny
Department of Economics, Wilfrid Laurier University, Waterloo, Ontario, Canada N2L 3C5 Received 5 August 1999; accepted 16 December 1999
Abstract
Using data for Canadian daily newspapers we find that price changes of papers owned by the same firm are synchronized. On the other hand, independently owned newspapers do not appear to change their prices together. 2000 Elsevier Science S.A. All rights reserved.
Keywords: Pricing; Staggering; Synchronization
JEL classification: D40; L16
1. Introduction
When changing nominal prices is costly, individual price behaviour is discontinuous and lumpy in an inflationary environment: firms keep prices constant for extended periods of time and change them by discrete amounts. If individual price changes were synchronized, the aggregate price level would exhibit similar behaviour. It does not, and so it is clear that price changes of individual firms are staggered. The presence of staggering leads to possible nominal rigidities at the aggregate level, whereby a single aggregate shock has persistent effects. The character of the nominal aggregate rigidities, if any, arising from costly price adjustment depends crucially on the timing, and interactions, between individual price changes.
Aggregating individual pricing policies in the presence of costly price adjustment has been addressed in several papers (Rotemberg, 1983; Caplin and Spulber, 1987; Caballero and Engel, 1991; Caplin and Leahy, 1991, 1997; Tsiddon, 1991, 1993). Generally speaking, the literature concentrates on conditions under which discontinuous individual policies can be consistently aggregated, under various assumptions about aggregate and idiosyncratic shocks as well as differences between firms.
*Corresponding author. Tel.: 11-519-884-0710; fax: 11-519-888-1015.
E-mail address: [email protected] (J.D. Konieczny)
Because the issue is technically difficult, the assumptions are restrictive. Idiosyncratic shocks as well as differences between firms tend to lead to staggering, while aggregate shocks induce synchroniza-tion. The precise nature of the idiosyncratic differences which lead to staggering is not analyzed in detail.
Sheshinski and Weiss (1992) examine the optimal pricing policy of a monopolist producing two products. They show that the timing of price changes depends on the nature of price-changing costs and the interactions in the profit function between the prices of the two goods. ‘Menu costs’ technology, where the cost of changing prices is independent of the number of products, and positive interactions between prices in the profit function, promote synchronization. ‘Decision costs’ technology, where the cost of changing prices is proportional to the number of products, and negative interactions in the profit function, promote staggering.
Empirical evidence on the issue is limited. Tommasi (1993), using data on grocery prices in Argentina during a period of very rapid inflation, finds that price changes of different products within a store are staggered. In contrast, Lach and Tsiddon (1996), in a detailed study of Israeli grocery prices, find that price changes of different products in a given store are synchronized, but price changes of a given product in different stores are staggered. Their results indicate that it is staggering across price setters which is important for the smooth behaviour of the aggregate price level.
In this paper we provide further evidence on the nature of staggering in the spirit of the Sheshinski and Weiss (1992) classification. We analyze data on Canadian newspaper prices. We consider three groups of newspapers. Papers in each of the first two groups belong to a single newspaper chain, while the last group, which we treat as a control, consists of independently owned newspapers. We find that papers belonging to the same chain tend to change prices together. In part, the within-group synchronization appears to be the result of common factors affecting the papers. On the other hand, independent newspapers do not change prices together. Our results support the ‘menu cost’ interpretation of price adjustment costs and suggest that it is staggering across price setters which results in smooth behaviour of the aggregate price level.
2. Data
The data consist of prices of daily newspapers in Canada over the period 1975–1990, collected by the Canadian Daily Newspaper Publishers Association (CDNPA). From the 64 newspapers for which we have data we select three groups on the basis of ownership structure. Papers in each of the first
1
two groups belong to a single newspaper chain, while the last group, which we treat as a control, consists of independently owned newspapers. These three groups cover 46 newspapers; the remaining papers belong to smaller chains and are not included in the analysis. We use weekly delivery prices in the results reported below. For most newspapers, over 50% of sales are by weekly delivery. The single copy price is usually a multiple of 5 cents; this practice affects the timing of changes.
There are 29 observations starting in July 1975 and ending in April 1990 (178 months). The information was collected at irregular intervals: the shortest period was 2 months (4.80–6.80 and
1
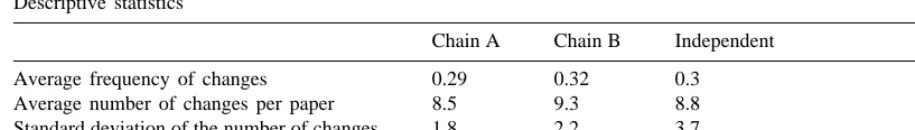
Table 1
a Descriptive statistics
Chain A Chain B Independent
Average frequency of changes 0.29 0.32 0.3
Average number of changes per paper 8.5 9.3 8.8 Standard deviation of the number of changes 1.8 2.2 3.7 Range of the number of changes 36 322 36 292 36 262
a
Note: Average frequency is calculated relative to the number of observations, rather than months.
2.89–4.89); the longest 13 months (1.77–2.78). The average period between observations is 6.3 months.
Descriptive statistics on the number of price changes are in Table 1. On average, newspapers change prices once every three observations, or about once every 20 months. The average frequency of price changes is similar across groups, but the number of changes varies substantially among papers. The frequency of adjustment varies most among the independent papers: 30% of independent papers changed prices no more than five times while 50% changed prices at least 11 times; the corresponding proportions are 0 and 20% for chain A; 10 and 30% for chain B.
3. Are price changes staggered or synchronized?
To investigate the nature of price changes for each newspaper group, we compare the standard deviation of the actual proportion of price changes in each period to the standard deviations of two artificial series. If price changes were perfectly staggered, the proportion of price changes in any period would be equal to the average proportion of price changes over the sample weighted by the
2
fraction of total time elapsed since the last observation. If price changes were perfectly synchronized, the proportion of price changes in any period would be either 0 or 1. The average number of price changes per group is between 8.5 and 9.3, and so the standard deviation assuming perfect synchronization is computed from a series of nine ones and 20 zeros.
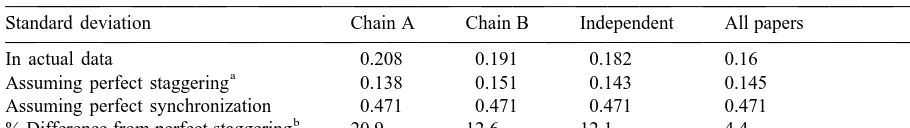
The standard deviations are shown in Table 2. The last row of Table 2 measures how close the standard deviation of the actual proportion is to the standard deviation assuming perfect staggering. The values are all less than 21%, indicating that price changes more closely resemble staggering than synchronization. In Lach and Tsiddon (1996), the standard deviation from the actual proportion of price changes is 25% of the standard deviation assuming perfect staggering, and in Tommasi (1993) it is about 50%. Thus, the ratios from our newspaper data are lower than those previously reported. However, the inflation rates are also much lower: average inflation is 6.8% in our data, compared with 60% in Lach and Tsiddon (1996), and 25 to 38% per week in Tommasi (1993). The inflation rate in
2
Table 2
Comparing standard deviations
Standard deviation Chain A Chain B Independent All papers
In actual data 0.208 0.191 0.182 0.16
a
Assuming perfect staggering 0.138 0.151 0.143 0.145 Assuming perfect synchronization 0.471 0.471 0.471 0.471
b
% Difference from perfect staggering 20.9 12.6 12.1 4.4
a
The standard deviations are calculated from the actual number of price changes. If the integer restriction is applied the numbers are 0.141, 0.156, 0.141 and 0.144, respectively.
b
Calculated as (s 2 sst d) /(s 2 sst sy)*100%, wheresd, sst andssy are the standard deviations in the data, the standard deviation under the assumption of perfect staggering, and the standard deviation under the assumption of perfect synchronization, respectively.
our data is also much less variable than inflation in the Israeli data, which in turn is less variable than inflation in the Argentinian data. It appears that the higher and the more variable is the inflation rate,
3
the higher is the degree of synchronization of price changes.
Note that, for all newspapers, the standard deviation is very close to that obtained under the assumption of perfect staggering. This suggests that price changes are staggered across groups
Although ratios of standard deviations are often used as a measure of the degree of sychronization, they turn out to be quite misleading in our data. Formal tests, to which we now turn, cast doubt on the conclusion drawn from Table 2 that price changes are staggered.
2
The hypothesis of uniform staggering can be tested formally with ax test for goodness of fit. We carry out the test separately for the two newspaper chains and for the group of independent
2
newspapers. Thex test statistic for Chain A is 22.43, for Chain B it is 30.74, and for the group of independent newspapers is 10.53. The critical value of the test statistic with 13 degrees of freedom is
4
22.36 at the 5% level. Therefore, we reject uniform staggering for Chain A and Chain B but not for the group of independent newspapers.
4. A simple regression test
We now use regression analysis to analyze price changing behaviour in the newspaper groups. If price changes in Chain A are synchronized (staggered), then the probability of a given Chain A newspaper changing price is higher (lower) the higher is the proportion of the remaining Chain A newspapers changing price. Similarly, if price changes in Chain A are synchronized with price changes in Chain B (independent) newspapers, then the probability of a given Chain A newspaper
3
This is the first evidence of this phenomenon in pricing data. Of course it is very tentative as the data used in the three studies are quite different.
4
Owing to a small number of price changes in some of the 29 observations, some adjacent observations are grouped to 2
changing price is higher the higher is the proportion of Chain B (independent) newspapers changing price. These effects may be estimated using a probit regression where the dependent variable for an observation is 1 if a newspaper in Chain A changed price, and 0 if it did not. The independent variables are the proportion of the remaining Chain A newspapers changing price, and the proportions of newspaper in the two other groups changing price.
Note that theory does not provide any priors about the coefficient signs. The Sheshinski and Weiss (1992) model implies that the effect of the proportion of remaining Chain A newspapers changing price (own proportion for short) depends on the nature of the price adjustment costs. The effects of the two other variables in the regression depend on the nature of aggregate and idiosyncratic shocks affecting the groups.
Similar regressions are also estimated for Chain B and for the independent newspapers. Each regression includes two additional control variables: the time between observations, to control for the varying time between observations, and dummy variables for each firm, to control the different
5
frequency of price changes across newspapers in the same group.
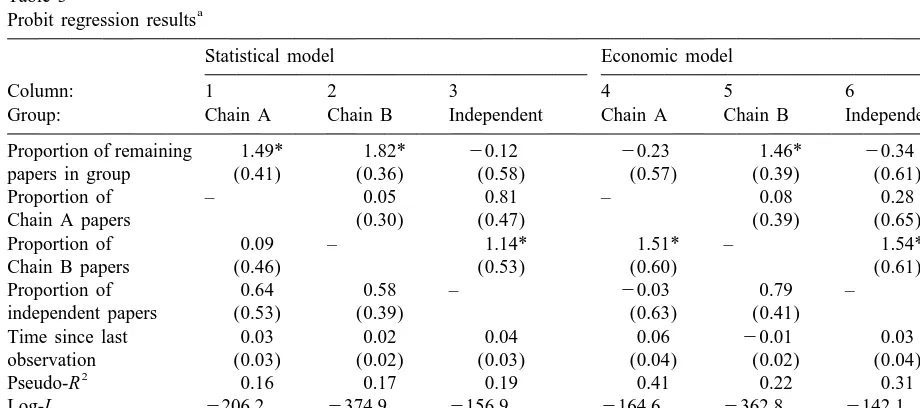
The results are in the first three columns of Table 3. For Chain A and Chain B, the coefficient on own proportion is positive and significant. For the independent newspapers, however, the effect of own ownership structure and not common shocks, for two reasons. First, independent newspapers
Table 3
a Probit regression results
Statistical model Economic model
Column: 1 2 3 4 5 6
Group: Chain A Chain B Independent Chain A Chain B Independent
Proportion of remaining 1.49* 1.82* 20.12 20.23 1.46* 20.34
papers in group (0.41) (0.36) (0.58) (0.57) (0.39) (0.61)
Proportion of – 0.05 0.81 – 0.08 0.28
Chain A papers (0.30) (0.47) (0.39) (0.65)
Proportion of 0.09 – 1.14* 1.51* – 1.54*
Chain B papers (0.46) (0.53) (0.60) (0.61)
Proportion of 0.64 0.58 – 20.03 0.79 –
independent papers (0.53) (0.39) (0.63) (0.41)
Time since last 0.03 0.02 0.04 0.06 20.01 0.03
observation (0.03) (0.02) (0.03) (0.04) (0.02) (0.04)
2
Pseudo-R 0.16 0.17 0.19 0.41 0.22 0.31
Log-L 2206.2 2374.9 2156.9 2164.6 2362.8 2142.1
Likelihood ratio test 44.5 87.3 42.3 127.8 111.5 71.7
Exclusion test – – – 83.4 24.2 29.4
a
Probit coefficients with standard errors in parentheses. The number of observations is not reported due to confidentiality considerations. * Denotes statistical significance at the 1% level.
5
behave differently from Chain A and Chain B; second, the effect of the remaining two groups is not
6
significant for the two chains.
5. The effect of shocks.
While the results answer the main question of the paper, they do so solely in a statistical sense. We can investigate the reasons for synchronization further by adding explanatory variables to the probit regression, based on the costly price adjustment model developed by Sheshinski and Weiss (1977) and modified by Cecchetti (1986).
When changing prices is costly, under general inflation firms increase nominal price only when inflation has reduced the real price to a threshold value. The further is the current real price from the threshold value, the lower is the probability of a price change. The threshold falls as the expected inflation rate or the real interest rate decrease (Sheshinski and Weiss, 1977). An increase in costs (proxied by change in the price of newsprint) and in demand (measured by change in circulation) raise the threshold (Cecchetti, 1986). If the costs of adjustment are the same for all papers, they are less important for large papers (measured by level of circulation) so larger papers have lower thresholds. A large previous price change may indicate a paper with large adjustment costs (a low threshold) or, alternatively, a mistake which would reduce the current probability of adjustment. Finally, if firms follow time-dependent policies, the probability of price change rises as time since the last change increases.
The results are in columns 4–6 of Table 3. The added variables are jointly significant at the 1% level, as indicated by the exclusion test in the last row (the critical value with seven degrees of
7
freedom is 18.48).
The effect of the added variables can be seen by comparing the coefficients with those in the ‘statistical’ regressions reported in Section 4. Synchronization within groups is less evident: the coefficient on own proportion falls for both chains. This indicates that synchronization within each chain is in part due to the effect of common shocks. The effect is more pronounced for Chain A. If shocks affecting both chains were identical, Chain A papers would not have synchronized price changes. There is little change in the corresponding coefficient for the independent newspapers.
When the menu-cost influence is controlled for, Chain B emerges as a market leader: the probability of a newspaper in chain A, as well as of an independent newspaper, changing price increases when the proportion of newspapers changing price in Chain B is high. The fact that the coefficients on the proportion of Chain B newspapers is smaller in the ‘statistical’ regressions of Section 4 indicates that the shocks across the groups lead to staggering of price changes.
6
The only significant effect is that of Chain B on independent newspapers. Together with results reported in Section 5 this suggests that Chain B is the market leader.
7
6. Conclusions
The results indicate the following story. Multiproduct firms synchronize price changes, while price changes across firms are staggered. This suggests the ‘menu cost’ interpretation of adjustment costs in Sheshinski and Weiss (1992). In part, synchronization is due to the common shocks within the group. Shocks across groups lead to staggering of price changes. Overall, the results suggest that staggering across price setters is important. Also, we find that the lower (and more stable) is the inflation rate, the more staggered are price changes.
Acknowledgements
We would like to thank Canadian Daily Newspaper Publishers Association for providing the data used in this study. Financial support from Social Sciences and Humanities Research Council and from Wilfrid Laurier University is gratefully acknowledged.
References
Caballero, R.J., Engel, E.M.R.A., 1991. Dynamic (S,s) economies. Econometrica 1, 1659–1686.
Caplin, A., Leahy, J., 1991. State-dependent pricing and the dynamics of money and output. Quarterly Journal of Economics 1, 683–708.
Caplin, A., Leahy, J., 1997. Aggregation and optimization with state-dependent pricing. Econometrica 1, 601–625. Caplin, A., Spulber, D.F., 1987. Menu costs and the neutrality of money. Quarterly Journal of Economics 1, 703–726. Cecchetti, S.G., 1986. The frequency of price adjustment: A study of the newsstand prices of magazines. Journal of
Econometrics 1, 255–274.
Lach, S., Tsiddon, D., 1996. Staggering and synchronization in price setting: an empirical analysis of disaggregated data. American Economic Review 1, 1175–1196.
Rotemberg, J.J., 1983. Aggregate consequences of fixed costs of price adjustment. American Economic Review 1, 433–436. Sheshinski, E., Weiss, Y., 1977. Inflation and costs of price adjustment. Review of Economic Studies 1, 287–303. Sheshinski, E., Weiss, Y., 1992. Staggered and synchronized price setting under inflation: the multiproduct monopoly case.
Review of Economic Studies 1, 331–359.
Tommasi, M., 1993. Inflation and relative prices: evidence from Argentina. In: Sheshinski, E., Weiss, Y. (Eds.), Inflation and Cost of Price Adjustment, MIT Press, Massachusetts, pp. 485–511.
Tsiddon, D., 1991. On the stubbornness of sticky prices. International Economic Review 1, 69–75.