Code: 0-139
A Paradigm Shift to Low Carbon Society 23-25 November 2011, Bangkok, Thailand Topic C: Energy efficiency or
Topic D: Cleaner use of fossil fuels and emission control
Energy and Exergy Analysis of Coal -Fired Power Plants: The Selected Case Studies in Thailand and Indonesia
Muhammad Penta Helios1,2,3, Suneerat Pipatmanomai1,2,*, Subriyer Nasir3
1
The Joint Graduate School of Energy and Environment, King Mongkut’s University of Technology Thonburi, Bangkok, Thailand
2
Center for Energy Technology and Environment, Ministry of Education, Thailand
3
Chemical Engineering Graduate Program , Sriwijaya University, Indonesia
* Corresponding Author. Tel: (662) 8729014 -5 Ext. 4148, Fax: (662) 8726978, E -mail: suneerat_p@jgsee.kmutt.ac.th Abstract: This study conducted the energy and exergy analysis based on data taken from the two selected coal fired-thermal power plants (TPPs): one in Thailand and the other plant in Indonesia. Both power plants are of similar characteristics that are lignite fired (superheated) steam power plant and approximately 300 MW gross power output. The aims of this case study are to illustrate the distribution of energy and exergy of each part in coal -fired power plants for energy improvement, to compare the value of energy and exergy performance of each component in both of plants, and to identify the effect of various loads respect to energy and exergy value. According to the first and second law of thermodynamics, even though the rate of coal consumption at the boiler in Power Plant B was less than that in Power Plant A, the net power generated and thermal efficiency o f B-PP was higher. This is likely due to the higher heating value of fuel supplied, and the better and newer steam cycle technology used for Power Plant B. In both plants, the energy losses at the condenser was the highest among major units of the power pl ants, percentage of heat rejected that was contributed by condensers in both plants reached 49.42% at Max load, 39.11% at 80% load and 25.33 at 60% load for A-PP whereas 49.31% at Max load, 38.90% at 80% load and 22.49% at 60% load for B -PP respectively. In addition, the average efficiency of A and B Power Plants accordance in loads, using energy analysis, was 39. 11% and 40.92%, respectively, whereas their exergy efficiency was 33.1% and 36.63%, respectively. The low exergy efficiency in A-PP was occurred in boiler, LPH 1, LPH 2, CEP and BFP, whereas low exergy efficiency in B -PP was identified in the boiler, CEP, BFP and LPH 1. Operating load is one of the parameters that influence the energy losses and exergy destructions of each device and therefore the energy and exergy efficiency of the plant. When the load is decreased, it is theoretically expected that both energy and exergy efficiency will decrease. However, such trend may not be achieved in real operation since there are other external influencing f actors which are uncontrollable. As observed in this study, parameters such as fuel properties, operated steam condition, etc, varied among different loads. However, part of this irreversibility can not be avoided due to physical, technological, and econom ic constraints.
Keywords: Exergy, Energy, Thermodynamics properties, Efficiency, Investigation
1. INTRODUCTION
As developing countries, the average growth of electricity around 8.4% and 6.6% every year for Thailand and Indonesia is quite high. In 2009, th e total electricity production in both countries reached almost 150 GWh per year [1]. While coal has a significant contribution to the electricity production, the average growth of electricity production from coal tended to increase by about 7.05% and 14.5 4% respectively during 1985 -2007 [2]. Due to the concern of energy supply security, diversifying energy resources and implementing high efficiency technologies have been target for both countries.
Coal is the major energy source for electricity generation in both Thailand and Indonesia. In Thailand, 2/3 of electricity generated is from natural gas, while almost 1/3 is from domestic lignite and imported sub -bituminous. Indonesia, on the other hand, relies almost completely on coal due to its abundant domest ic coal resource. Coal-fired (superheated) steam power plant is a typical technology used in both countries. Based on a similar plant technology and feed fuel properties, both power plants in Thailand and Indonesia in average have similar overall efficienc y around 36% in 2009 [3-6]. On the contrary, the efficiency of Indonesia coal-fired power plant decreased during the operation period, meanwhile Thailand plant tended to constant . Therefore, it is interesting to explore the coal -fired power plants in both countries, which will lead to useful comparative information and guideline for possible efficiency improvement.
Code: 0-139
A Paradigm Shift to Low Carbon Society 23-25 November 2011, Bangkok, Thailand
o o i
i
m
m
. .
o o i
i Q E W
E
. . . .
t pnet
W
W
W
. . .
LHV
m
Q
b fuels.
. .
. .
b net th
Q W
amount of energy converted into the useful work, but it also explains part of non -useful energy. Useful work is also called available energy, whereas non -useful energy is represented by the term of exergy destroyed or anergy. By this idea, the inevitability of energy loss or destruction throughout the process implies that all devices which are operated in the nature cannot reach 100% efficiency as stated by the first law of thermodynamics [7]. In exergy concept, the quality of energy term will be made visible referring to the real of entropy differences of the two energy stream. Because of the reasons above, the concept of energy analysis alone is insufficient since the quality of energy is not taken into consideration [8]. Therefore, exergy analysis will give better information of potential work produced and energy recycles [9].
The concept of exergy has been applied along with energy analysis for power plants in previous studies. Aljundi [10] determined the location of most energy an d exergy losses for Al-Hussein steam power plant with power capacity of 66 MW in Jordan through energy and exergy analyses and investigated the effects of variation of the reference ambient conditions on exergetic performance . Kopac and Hilalci [11] used the exergy concept to investigate the effects of reference environment temperature of power plant components (boiler, turbines, condenser, heaters, pumps, and pipe) on the performance of Catalagzi power plant in Turkey . Rosen and Dincer [12] indicated that the sensitivities of energy and exergy values and the results of energy and exergy analyses to reasonable variations in the dead state properties were sufficiently small. Erdem et al. [13] analysed and compared the irreversibilities and the exergy performa nces of the main components (boiler, steam turbine, condenser, pump, feed water heater) of nine thermal power plants in Turkey. Another research also compared between the actual design and simulated results , Regulagadda et al. [14] estimated the value of e xergy for Tecpro Power Systems Ltd. in Chennai, India, under various operating conditions, including pressures, temperatures, and flow rates, in order to determine the parameters that maximize plant performance.
In this paper, both energy and exergy analys is were conducted for two selected coal fired -thermal power plants (TPPs): one Power Plant in Thailand and the other Power Plant in Indonesia. Both power plants are of similar characteristics that are lignite fired (superheated) steam power plant and appro ximately 300 MW gross power output. Analysis was based on the actual plant data at three different loads. By applying energy and exergy concepts, the distribution of energy and exergy losses was determined, which has created benchmark study to the identifi cation of possible improvement in the future.
2. FORMULATION OF ENERGY AND EXERGY ANALYSES OF POWER PLANT
In these case studies, both energy and exergy analysis were made to analyze thermodynamics variables. In addition, this case also investig ated energy and exergy with respect to different loads. The input and output values of the plant components can be established using the measured/calculated thermodynamics variables such as enthalpy, pressure, temperature, entropy, and mass flow rate. Befo re analyzing energy and exergy performance, the process in each of components should be arranged by mass, energy and exergy balance for any control volume at steady state condition with neglecting potential and kinetic energy. For control volume system mas s balance, we can follow the equation below :
(1)
2.1 Energy efficiency analysis
According to the first law of thermodynamics, subtraction of contained energy in turbine by that in pump usually gives the net power of coal fired power pl ant [14]:
(2) The total required heat energy in the boiler can be determined from:
(3) Then, the overall thermal efficiency of the power plants can be calculated as:
(4) The energy balance for a control volume system is given by:
Code: 0-139
A Paradigm Shift to Low Carbon Society 23-25 November 2011, Bangkok, Thailand
o
d o
i
k
k k
i Q Ex W Ex
T T Ex
. . . . . .
1
. . .
) ( x
x m e
E
ch
x tm x
x me e
e
m
. .
o o
tm
x
h
h
T
s
s
e
0
Net total D
W x E
. .
, .
ch x coal
net x
E
e m
W
.
. .
i D total
D
E
x
x
E
,.
, .
2.2 Exergy efficiency analysis
According to the second law of thermodynamics, the value of exergy can be found by combining the entropy balance with energy balance equation. The steps of exergy balance calculation can be explained as sho wn below. The exergy balance for a control volume system is written as
(6)
Where the exergy rate of a stream is:
, where (7)
Refer to in eq. 7, the specific exergy is divided into two terms. The specific exergy of the thermo-mechanical process, ex
tm
, is related to thermo-mechanical activity and temperature difference in the system and the specific exergy of the chemical process, exch, isvery changable depending on types of fuel and chemical compounds. Only thermo-mechanical specific exergy is used in all devices , excepted boiler in which both terms are included and it is given by:
(8) Total exergy destruction rate in the plant can be determined as a sum of exergy destruction r ates of all considered components and it is given as follow:
(9) Thus, the overall exergy efficiency is given by
(10) Besides exergy destruction and exergy efficiency, the ot her important value that should be known in exergy analysis is exergetic performance coefficient, where it is defined as the amount of exergy loss rate per unit power output and it can be written as following equation:
(11)
3. METHODS
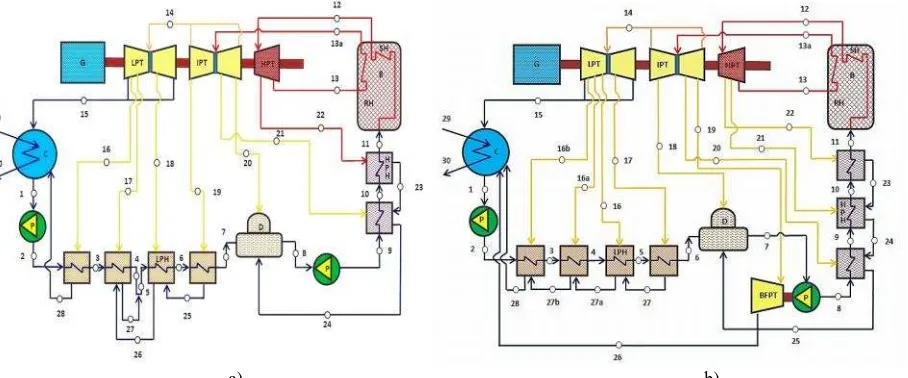
This study selected two coal -fired power plants in South East Asia Region, one power plant from Thailand and the other from Indonesia, denoted as Plant A and B, respectively. The flow diagram s of the two coal-fired power plants are simplified as shown in Fig. 1. The main components of the system include high, intermediate and low pressure turbine groups (HPT, IPT, and LPT, respectively), a boiler (B), several pumps (P) included condensate extraction pump (CEP) and boiler feed pump (BFP) , a deairator (D), a generator (G), a condenser (C), low and high pressure feed water heater groups (LPH and HPH).
a) b)
Code: x-xx
A Paradigm Shift to Low Carbon Society 23-25 November 2011, Bangkok, Thailand
.
Name Component figure Exergy destruction rate Exergy efficiency
1 Boiler observed such as the recycle of an output stream from LPH2 in Power Plant A where the two stream s of water from stream point 4 and 27 were mixed to be a single stream at point 5 and also BFPT (Boiler Feed Pump Turbine) in Power Plant B. According to the simplified schematic diagram above, the energy and exergy balance for each major device were constructed and the exergy equations are presented in Table 1.
Collection of the actual data from the plants as well as giving suitable assumptions for each main component was carried out to conduct the energy and exergy balance. The methodology can be described as following.
1. Analysis of coal properties, especially coal ra nk and heating value, was carried out to determine the heat supply from coal combustion.
2. Collection of data for the energy and exergy analysis of each main component (such as boiler, turbine, condenser, heater and pump). The data related to mass cover the mass and properties of fuels, water and steam and those related to energy and exergy include the thermodynamics properties of all mass streams and electricity.
3. Applying some assumptions to simplify and to analyze control volume devices.
4. Simplifying the schematic power plant and also preparing CATT2 (Computer Aid Thermodynamics Table version 2) and MS Excel for calculation.
5. Calculation of mass and energy balance of each component with aim at obtaining the energy efficiency value and identify the energy losse s.
6. Combining entropy and energy equation to earn exergy equations and assessing the value of exergy.
7. Identifying the influence of operating loads on energy and exergy distribution in form of constructed sankey and grassman diagram
Table 1. Exergy efficiency equations for main components of the coal -fired power plant [9]
4. RESULTS AND DISCUSSION
To analyze the mass, energy and exergy, data collected from both power plants were processed in MS Excel spread sheet with the thermodynamics properties calculated using CATT2 (Computer Aid Thermodynamics Table version 2) program. By using the more accurate thermodynamics properties determined, the errors in each step of calculation due to the uncertainties in actual plant data collection could be minimized and hence better overall plant analysis.
4.1 Energy and exergy comparison of power plants in Thailand and Indonesia
Code: x-xx
A Paradigm Shift to Low Carbon Society 23-25 November 2011, Bangkok, Thailand
design and operating conditions such as the heating value of fuels used, temperature differences of the exit flue gas and amount of produced steam.
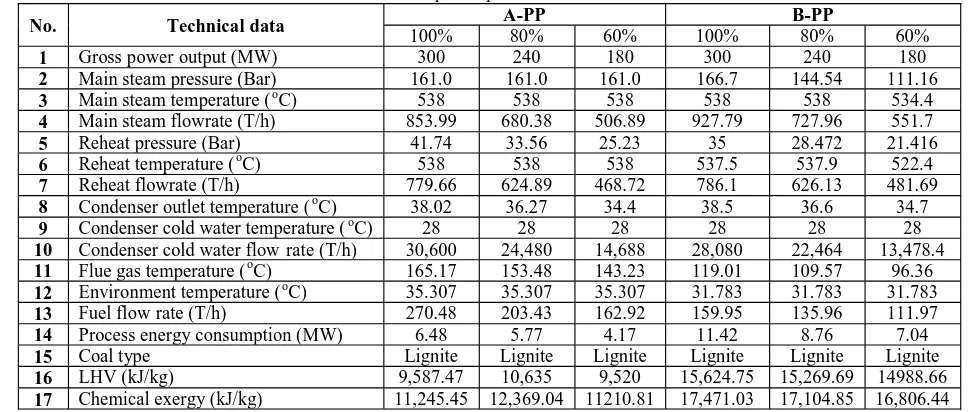
As seen from Table 2, the quality of lignite used for A -PP is much lower than that for B -PP. Another aspect can be analyzed from Table 2 is that the pressure of main steam operated at B -PP was 166 bar, which was 5.7 bar higher than that operated in A-PP at 100% load. Then, when the loads decrease, the pressure of main steam at B -PP will decrease but at A-PP, it will be constant.. Besides, the temperature of the flue gas released at the stack draft in B-PP is lower than A-PP by 45C and therefore heat was better utilised.
The calculation for energy analysis of both plants was carried out and the results are presented in Table 3. The net power generated and thermal efficiency of B -PP was higher. This is likely due to the better and newer steam cycle technology used for B-PP, which was first operated in 2009, where as power plant A was first operated since 1989 . The higher quality of lignite used for B -PP is also thought to be the reason for the high efficiency of plant B. In both plants, the energy losses at the condenser were the highest among major units of the power plants, which account for 49.42 % and 49.31 % of the input energy for plant A -PP and B-PP, respectively.
Table 2. Technical data of two coal -fired power plants in Thailand and Indonesia at various loads
Table 3. Energy balance for the main component s of two thermal power plants at various loads
Specific analytical point Heat loss in A-PP Heat loss in B-PP
100% 80% 60% 100% 80% 60%
Energy supplied in the boiler (MW) 720.35 600.98 430.99 694.21 576.67 466.17 Net power output (MW) 284.49 227.99 171.95 291.22 240.16 182.61
Leakage in LPH (MW) 0.53 0.31 0.34 1.26 0.28 0.23
Leakage in HPH (MW) 0.11 0.16 0.10 1.45 0.53 0.41
Condenser rejected heat (MW) 356.01 235.03 109.15 342.34 224.32 104.86
Leakage in turbine (MW) 15.29 11.82 8.62 15.09 12.70 9.71
Leakage in condenser (MW) 1.31 59.47 119.11 24.11 75.98 132.68 Leakage in boiler (MW) 62.61 66.20 21.72 18.74 22.72 35.67
Total energy loss (MW) 435.86 372.99 259.04 402.99 336.52 283.56
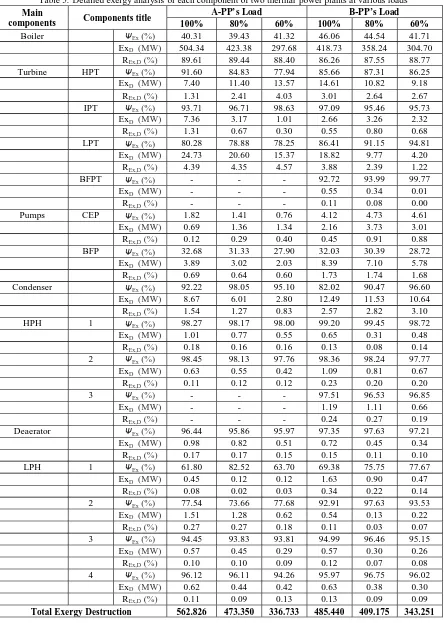
Results of overall and detailed exergy analysis in each component are summarized in Table 4 and 5. The fuel exergy in A-PP was higher. Due to higher exergy loss, the overall exergy efficiency was lower. This is clearly due to the higher exergy loss at the boiler, turbine and pumps in A -PP. Therefore, these components are recommended for further detailed investigation to improve efficiency.
Table 4. Overall exergy efficiency of two thermal power plants at various load s
Specific analytical point A-PP B-PP
100% 80% 60% 100% 80% 60%
Fuel exergy (MW) 844.92 698.96 507.34 776.24 645.98 522.70
Total exergy loss (MW) 562.83 473.35 336.90 483.28 405.45 340.24
Exergy loss per unit power 1.98 2.08 1.96 1.66 1.69 1.86
Exergy efficiency (%) 33.39 32.28 33.63 37.74 37.24 34.91
No. Technical data A-PP B-PP
100% 80% 60% 100% 80% 60%
1 Gross power output (MW) 300 240 180 300 240 180
2 Main steam pressure (Bar) 161.0 161.0 161.0 166.7 144.54 111.16
3 Main steam temperature (oC) 538 538 538 538 538 534.4
4 Main steam flowrate (T/h) 853.99 680.38 506.89 927.79 727.96 551.7
5 Reheat pressure (Bar) 41.74 33.56 25.23 35 28.472 21.416
6 Reheat temperature (oC) 538 538 538 537.5 537.9 522.4
7 Reheat flowrate (T/h) 779.66 624.89 468.72 786.1 626.13 481.69
8 Condenser outlet temperature (oC) 38.02 36.27 34.4 38.5 36.6 34.7
9 Condenser cold water temperature (oC) 28 28 28 28 28 28
10 Condenser cold water flow rate (T/h) 30,600 24,480 14,688 28,080 22,464 13,478.4 11 Flue gas temperature (oC) 165.17 153.48 143.23 119.01 109.57 96.36 12 Environment temperature (oC) 35.307 35.307 35.307 31.783 31.783 31.783 13 Fuel flow rate (T/h) 270.48 203.43 162.92 159.95 135.96 111.97 14 Process energy consumption (MW) 6.48 5.77 4.17 11.42 8.76 7.04
15 Coal type Lignite Lignite Lignite Lignite Lignite Lignite
16 LHV (kJ/kg) 9,587.47 10,635 9,520 15,624.75 15,269.69 14988.66
Code: x-xx
A Paradigm Shift to Low Carbon Society 23-25 November 2011, Bangkok, Thailand
Table 5. Detailed exergy analysis of each component of two thermal power plants at various loads Main
components Components title
A-PP’s Load B-PP’s Load
100% 80% 60% 100% 80% 60%
Boiler ΨEx(%) 40.31 39.43 41.32 46.06 44.54 41.71
ExD (MW) 504.34 423.38 297.68 418.73 358.24 304.70
REx,D(%) 89.61 89.44 88.40 86.26 87.55 88.77
Turbine HPT ΨEx(%) 91.60 84.83 77.94 85.66 87.31 86.25
ExD (MW) 7.40 11.40 13.57 14.61 10.82 9.18
REx,D(%) 1.31 2.41 4.03 3.01 2.64 2.67
IPT ΨEx(%) 93.71 96.71 98.63 97.09 95.46 95.73
ExD (MW) 7.36 3.17 1.01 2.66 3.26 2.32
REx,D(%) 1.31 0.67 0.30 0.55 0.80 0.68
LPT ΨEx(%) 80.28 78.88 78.25 86.41 91.15 94.81
ExD (MW) 24.73 20.60 15.37 18.82 9.77 4.20
REx,D(%) 4.39 4.35 4.57 3.88 2.39 1.22
BFPT ΨEx(%) - - - 92.72 93.99 99.77
ExD (MW) - - - 0.55 0.34 0.01
REx,D(%) - - - 0.11 0.08 0.00
Pumps CEP ΨEx(%) 1.82 1.41 0.76 4.12 4.73 4.61
ExD (MW) 0.69 1.36 1.34 2.16 3.73 3.01
REx,D(%) 0.12 0.29 0.40 0.45 0.91 0.88
BFP ΨEx(%) 32.68 31.33 27.90 32.03 30.39 28.72
ExD (MW) 3.89 3.02 2.03 8.39 7.10 5.78
REx,D(%) 0.69 0.64 0.60 1.73 1.74 1.68
Condenser ΨEx(%) 92.22 98.05 95.10 82.02 90.47 96.60
ExD (MW) 8.67 6.01 2.80 12.49 11.53 10.64
REx,D(%) 1.54 1.27 0.83 2.57 2.82 3.10
HPH 1 ΨEx(%) 98.27 98.17 98.00 99.20 99.45 98.72
ExD (MW) 1.01 0.77 0.55 0.65 0.31 0.48
REx,D(%) 0.18 0.16 0.16 0.13 0.08 0.14
2 ΨEx(%) 98.45 98.13 97.76 98.36 98.24 97.77
ExD (MW) 0.63 0.55 0.42 1.09 0.81 0.67
REx,D(%) 0.11 0.12 0.12 0.23 0.20 0.20
3 ΨEx(%) - - - 97.51 96.53 96.85
ExD (MW) - - - 1.19 1.11 0.66
REx,D(%) - - - 0.24 0.27 0.19
Deaerator ΨEx(%) 96.44 95.86 95.97 97.35 97.63 97.21
ExD (MW) 0.98 0.82 0.51 0.72 0.45 0.34
REx,D(%) 0.17 0.17 0.15 0.15 0.11 0.10
LPH 1 ΨEx(%) 61.80 82.52 63.70 69.38 75.75 77.67
ExD (MW) 0.45 0.12 0.12 1.63 0.90 0.47
REx,D(%) 0.08 0.02 0.03 0.34 0.22 0.14
2 ΨEx(%) 77.54 73.66 77.68 92.91 97.63 93.53
ExD (MW) 1.51 1.28 0.62 0.54 0.13 0.22
REx,D(%) 0.27 0.27 0.18 0.11 0.03 0.07
3 ΨEx(%) 94.45 93.83 93.81 94.99 96.46 95.15
ExD (MW) 0.57 0.45 0.29 0.57 0.30 0.26
REx,D(%) 0.10 0.10 0.09 0.12 0.07 0.08
4 ΨEx(%) 96.12 96.11 94.26 95.97 96.75 96.02
ExD (MW) 0.62 0.44 0.42 0.63 0.38 0.30
REx,D(%) 0.11 0.09 0.13 0.13 0.09 0.09
Code: x-xx
A Paradigm Shift to Low Carbon Society 23-25 November 2011, Bangkok, Thailand
B o ile r 1 8 .7 4 1 M W
T u rb in e s 1 5 .0 8 8 M W
H e a te rs 2 .7 0 5 M W
C o n d e n s e r 2 4 .1 1 2 M W
T o ta l e n e rg y p ro d u c tio n 6 9 4 .2 1 M W
W n e tt 2 9 1 .2 2 M W
H e a t R e je c te d o f c o n d e n s e r 3 4 2 .3 4 2 M W
Boiler 418.73 MW
Turbines 36.64 MW Heaters
7.02 MW
Pumps 8.39 MW
Condenser 12.49 MW
Total exergy production 776.24 MW
W nett 291.22 MW
According to the calculated results of exergy destruction shown in Table 5, boiler, turbine and pumps are the main contributors to the total rate of exergy destruction for both plants. Boiler , as the largest reactor for energy transforming, should be analyzed in more details because almost 90% of the total exergy destruction occurred in there and it was also called by exergy destructio n ratio. Exergy destruction ratio is also defined as total of exergy destruction in the device divided by total exergy destruction in whole plant . Around 1-5 % of exergy destruction was occur red in the turbine. Differ from the boiler and turbine that inter acted with high temperature heat - high quality energy, another device that gave a surprise fact in term of exergy destruction is pumps. Pump, as a distribution device that consumed electricity which is considered as high quality energy, had low exergy efficiency. It was caused by too much temperature disparity between inlet and outlet water temperature, in other words, when the pumps consumed amount of electricity, some electricity was converted simultaneously into heat and it influenced the value of exerg y in that device Where it refers to the previous study, this condition on pumps was commonly caused by friction heat or mixing fluid [10].
In addition, Table 3 and 5 suggest that energy and exergy efficiency in each component, especially for boiler, CEP, and BFP, can be improved but further investigation is needed . Operating load is one of the parameters that influence the energy losses and exergy destruction s of each device and therefore the energy and exergy efficiency of the plant. When the load is decreased, it is theoretically expected that both energy and exergy efficiency will decrease. However, such trend may not be achieved in real operation since there are other external influencing factors which are uncontrollable. As observed in this study , parameters such as fuel properties, operated steam condition, etc, varied among different loads.
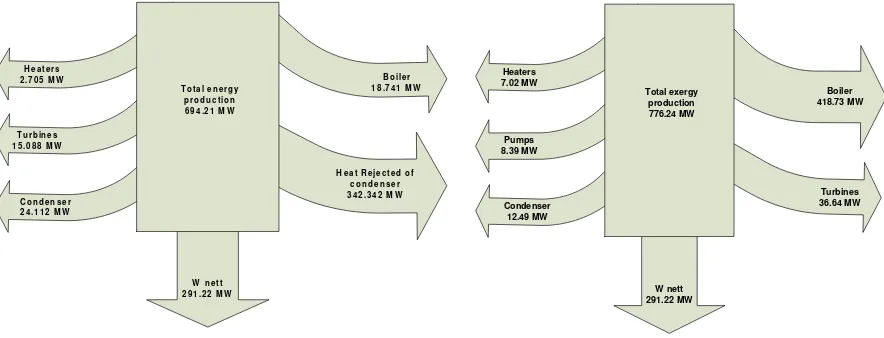
As a summary, the typical distribution of energy and exergy for power plant B at 100% load is illustrated in Fig. 2 as sankey and grassman diagram . The energy losses and exergy destruction in four major components, i.e. boiler, turbines, heaters, pumps and condensers, are identified.
Fig. 2 Distribution of energy and exergy of power plant B at 100% load
5. CONCLUSIONS
This study combined the energy and exergy concept to analyze where the largest energy losses and exergy destruction occur in the system and what decision should be made in the next step. The comparison of the energy and exergy analysis that was conducted in the coal-fired power plants in Thailand and Indonesia showed that the physical conditions of components have effects on the value of energy, exergy efficiency, and exergy destruction at various loads. In both plants, the energy losses at the condenser, especially in A-PP, were the highest among major units of the power plants. Percentage of heat rejected that was contributed by condensers in both plants reached 49.42% at Max load, 39.11% at 80% load and 25.33 at 60% load for A-PP whereas 49.31% at Max load, 38.90% at 80% loa d and 22.49% at 60% load for B -PP respectively. Although the fuel exergy in A -PP was higher than the other, the exergy efficiency was lower. The low exergy efficiency in A -PP was attributed to the low exergy efficiency of boiler, LPH 1, LPH 2, CEP and BFP, whereas low exergy efficiency in B -PP was identified for the boiler, CEP, BFP and LPH 1 .
Code: x-xx
A Paradigm Shift to Low Carbon Society 23-25 November 2011, Bangkok, Thailand
D x E
.
h
s
T.
W
.
Q LHV
x
e
.
x E
.
D Ex
R ,
Sin
Sout
th
Wout Win
t
pnet n i,
t o,
o p k , 6. UNITS AND SYMBOLS
Exergy transfer rate (kW) Specific exergy (kJ kg-1) Exergy destruction rate (kW) Enthalpy (kJ kg-1)
Lower Heating Value (kJ kg-1) Entropy (kJ kg-1K-1)
Temperature (K oroC) Heat transfer rate (kW) Electrical power output (kW) Exergy destruction ratio
Greek letters
Energy efficiency Exergy efficiency
Subscripts
Steam input Steam output Water input Water output Thermal Turbine
Pump Netto
Initial stream each component Final stream each component Reference environment temperature Variables of temperatures
Exergetic performance coefficient
7. ACKNOWLEDGMENTS
The authors would like to express special thanks and deep gratitude to Perusahaan Gas Negara (PGN) Company in Indonesia for providing scholarships for Muhammad Penta Helios.
8. REFERENCES
[1] International Energy Agency (IEA). (2010) World Energy Outlook 2010 , Paris, France.
[2] http://www.bp.com.(2010) Statistical Review of World Energy, the British Petroleum Company 2010, London, Inggris.
[3] Department of Alternative Energy Development and Efficiency ( DEDE). (2009)Thailand Energy Outlook 2009, Bangkok, Thailand.
[4] Ministry of Energy and Mineral Resources of Indonesia (MEMR) . (2010) Handbook of Energy & Economic Statistics of Indonesia 2010, Jakarta, Indonesia
[5] http://www.tradingeconomi cs.com. (2011) Indonesia - National Statistical Data; Indonesia - IMF Data & Forecasts; Indonesia - World Bank Data, New York, US.
[6] http://www.tradingeconomics.com. (2011) Thailand - National Statistical D ata; Thailand - IMF Data & Forecasts; Thailand - World Bank Data, New York, US.
[7] Cengel, Y. A. (2011) Thermodynamics: An Engineering Approach (7th Edition) in SI Units. Mc-Graw Hill. Singapore.
[8] Lior, N., and N. Zhang (2007) Energy, Exergy, and Second Law performance criteria, Energy, 32, (4): pp. 281-296.
[9] S. C. Kamate, and Gangavati, P. B. (2009) Exergy Analysis of cogeneration Power Plant s in Sugar Industries. Applied Thermal Engineering, 29, (5-6): pp 1187-1194.
[10] Aljundi, I. H. (2009) Energy and Exergy Analysis of a Steam Power Plant in Jordan, Applied Thermal Engineering, 29, (2-3): pp.324-328.
[11] Kopac, M. and Hilalci, A. (2007) E ffect of Ambient Temperature on The Efficiency of The Regenerative and Reheat Catalagzi Power Plant in Turkey, Applied Thermal Engineering, 27, (8-9): pp. 1377-1385.
[12] Rosen, M. A. and I.Dincer (2004) Effect of Varying Dead -State Properties on Energy and Exergy Analyses Of Thermal Systems, International Journal of Thermal Sciences. 43. (2): pp. 121-133.
[13] Erdem, H. H., A. V. Akkaya, et al. (2009) Comparative Energetic and Exergetic Performance Analyses for Coal -Fired Thermal Power Plants in Turkey. International Journal of Thermal Sciences, 48, (11): pp. 2179-2186. [14] Regulagadda, P., I. Dincer, et al. (2010) Exergy Analysis of a Thermal Power Plant with Measured Boile r and
Turbine Losses, Applied Thermal Engineering , 30, (8-9): pp. 970-976.
![Table 1. Exergy efficiency equations for main components of the coal -fired power plantComponent [9]](https://thumb-ap.123doks.com/thumbv2/123dok/1656113.1092438/4.612.118.493.312.584/table-exergy-efficiency-equations-components-fired-power-plantcomponent.webp)