Correcting eddy-covariance flux underestimates over a grassland
T.E. Twine
a,∗, W.P. Kustas
b, J.M. Norman
c, D.R. Cook
d, P.R. Houser
e, T.P. Meyers
f,
J.H. Prueger
g, P.J. Starks
h, M.L. Wesely
daDepartment of Atmospheric and Oceanic Sciences, 1225 West Dayton St., University of Wisconsin-Madison, Madison, WI 53706, USA bUSDA-ARS Hydrology Laboratory, Beltsville, MD 20705, USA
cDepartment of Soil Science, University of Wisconsin-Madison, Madison, WI 53706, USA dArgonne National Laboratory, Argonne, IL 60439, USA
eHydrological Sciences Branch, NASA Goddard Space Flight Center, Greenbelt, MD 20771, USA fNOAA Atmospheric Turbulence and Diffusion, Oak Ridge National Laboratory, Oakridge, TN 37831, USA
gUSDA-ARS National Soil Tilth Laboratory, Ames, IA 50011, USA hUSDA-ARS Grazinglands Research Laboratory, El Reno, OK 73036, USA
Received 9 April 1999; received in revised form 28 January 2000; accepted 28 January 2000
Abstract
Independent measurements of the major energy balance flux components are not often consistent with the principle of conservation of energy. This is referred to as a lack of closure of the surface energy balance. Most results in the literature have shown the sum of sensible and latent heat fluxes measured by eddy covariance to be less than the difference between net radiation and soil heat fluxes. This under-measurement of sensible and latent heat fluxes by eddy-covariance instruments has occurred in numerous field experiments and among many different manufacturers of instruments. Four eddy-covariance systems consisting of the same models of instruments were set up side-by-side during the Southern Great Plains 1997 Hydrology Experiment and all systems under-measured fluxes by similar amounts. One of these eddy-covariance systems was collocated with three other types of eddy-covariance systems at different sites; all of these systems under-measured the sensible and latent-heat fluxes. The net radiometers and soil heat flux plates used in conjunction with the eddy-covariance systems were calibrated independently and measurements of net radiation and soil heat flux showed little scatter for various sites. The 10% absolute uncertainty in available energy measurements was considerably smaller than the systematic closure problem in the surface energy budget, which varied from 10 to 30%. When available-energy measurement errors are known and modest, eddy-covariance measurements of sensible and latent heat fluxes should be adjusted for closure. Although the preferred method of energy balance closure is to maintain the Bowen–ratio, the method for obtaining closure appears to be less important than assuring that eddy-covariance measurements are consistent with conservation of energy. Based on numerous measurements over a sorghum canopy, carbon dioxide fluxes, which are measured by eddy covariance, are underestimated by the same factor as eddy covariance evaporation measurements when energy balance closure is not achieved. Published by Elsevier Science B.V.
Keywords:Eddy-covariance; Friction velocity; Evapotranspiration flux
∗Corresponding author. Fax:+1-608-263-4190.
E-mail address:[email protected] (T.E. Twine)
1. Introduction
A better understanding of how energy and mass are partitioned at the earth’s surface is necessary for
improving regional weather and global climate mod-els. Because measurements of scalar fluxes can only be made at a few locations, these weather and global climate models will be used to assess the impact of societal choices, such as abiding by the Kyoto Pro-tocol for carbon sequestration. Usually surface flux models are only as accurate as the measurements used to validate them; therefore, accurate measurements of surface energy components are imperative for accurate modeling of surface energy and mass balances. The importance of accurate micrometeorological measure-ments of surface fluxes is a justification for long-term flux measurement networks (Baldocchi et al., 1996). Unfortunately, the micrometeorological literature con-tains numerous anecdotal references to possible sys-tematic underestimates of surface scalar fluxes by the preferred measurement system; namely eddy covari-ance (Dugas et al., 1991; Nie et al., 1992; Fritschen et al., 1992; Goulden et al., 1997; McCaughey et al., 1997; Mahrt, 1998). The potential problems that sys-tematic errors can create in long-term surface flux measurements, particularly selective systematic errors (different daytime errors from night-time errors), are considered by Moncrief et al. (1996) and can be se-rious. Therefore, dealing with lack of energy-balance closure should be considered in the standards for long-term, flux-measurement networks even though it has received little attention (Baldocchi et al., 1996).
All models of surface energy and mass exchange are based on the fundamental conservation prin-ciples; namely, conservation of energy and con-servation of mass. The major components of the conservation of energy equation, which we often re-fer to as ‘energy-balance closure’, can be depicted as
Rn=H+LE+G+S+ε, (1)
where Rn is net radiation,His convective sensible heat exchange, LE is latent heat exchange or evapotranspi-ration,Gis the soil-surface heat conduction flux,Sis the heat storage in the canopy and ε is any residual flux associated with errors. This equation neglects en-ergy partitioned to photosynthesis, which is less than a few percent of the net radiation. If field measurements of surface fluxes are not consistent with Eq. (1), then modelers will have to make adjustments to the
mea-sured fluxes or accept uncertainties in their models that are of the same magnitude as the measured energy conservation discrepancy. Because the discrepancy in energy-balance closure (D=[H+LE]/[Rn−G−S]) is a bias that varies from 0 to−30% (0.7<D<1), this prob-lem is serious if the cause for this discrepancy is not known. With D<0.7, the utility of the sensible and latent heat flux measurements for model validation or calibration is greatly reduced (Kustas et al., 1999). Operationally, a systematic error that underestimates the evapotranspiration component of a water budget of a crop by 25% is intolerable to an irrigation scheduler. By half-way through a growing season, the underes-timated portion of the evaporation could accumulate to an amount of water equivalent to half the total soil moisture available to the crop and result in erroneous predictions of severe yield reductions if not corrected. Likewise, the underestimation of a daytime net CO2 flux by 25% could easily lead one to conclude that a forest site was a net source of carbon when in fact it was a significant sink of carbon; because night-time fluxes are estimated by alternative methods that may not underestimate respiratory fluxes (Moncrief et al., 1996).
2. Review of surface flux measurements and energy-balance closure
Two primary micrometeorological systems for mea-suring surface scalar fluxes are in wide-spread use; the energy-balance-Bowen-ratio (EBBR) method and the eddy-covariance (EC) method (Dabberdt et al., 1993). The EBBR method uses direct measurements of Rn,
G, and gradients of temperature and water vapor in the atmosphere to estimate LE and H by assuming similarity between heat and water vapor transport and conservation of energy. The EC method is based on direct measurements of the product of vertical velocity fluctuations (w′
) and scalar concentration fluctuations (c′) yielding a direct estimate ofHand LE assuming the mean vertical velocity is negligible. Clearly the EBBR method must be consistent with conservation of energy because it forces energy-balance closure; however, the EC method provides estimates ofHand LE separately so that when combined with measure-ments of Rn,G, and S all the major components of the energy balance are independently measured.
Several reasons for lack of closure of the sur-face energy budget have been discussed by Mahrt (1998) and may include the following: (1) lack of coincidence of the source areas among various flux components measured very near a surface such as evaporation coming from leaves and sensible heat from a hot, dry soil surface; (2) flux divergence aris-ing from transport that is not one-dimensional such as insufficient fetch; (3) non-stationarity of measured time series over the typical 30 min averaging periods so that covariance arising from very low frequency fluctuations is missed; (4) turbulent dispersive fluxes arising from organized planetary-boundary-layer cir-culations that may have preferred locations so that the mean vertical velocities at an instrument location may be systematically different from zero giving rise to a vertical advective flux; and (5) measurement er-rors related to sensor separation, frequency response, alignment problems, and interference from tower or instrument-mounting structures.
The accuracy of the measurement of surface en-ergy fluxes can be assessed two ways to increase confidence in the evaluation: (1) Evaluate the clo-sure of the surface energy balance using independent measurements of all the components of the energy budget contained in Eq. (1) and (2) compare
measure-ments at the same time and same site using EC and EBBR instrumentation. Closure can be quantified us-ingD=[H+LE]/[Rn−G−S] or specified as a residual flux density,ε.
Agreement between two independent methods for measuring surface fluxes increases confidence in both approaches; therefore, comparisons between the EC and EBBR methods are valuable. The EBBR method, which is based on measurements of temperature and vapor pressure gradients, provides estimates ofHand LE that are independent of the EC method even though Rn,GandSwould not be independent. Because the EBBR method assumes closure of the energy budget to solve for H and LE, differences between EBBR and EC methods include the lack of closure issue with the EC method along with differences of measured Bowen-ratios.
Closure was assessed over grassland ecosystems during the FIFE experiment (Sellers et al., 1992), and in a semi-arid environment during Monsoon’90 (Stannard et al., 1994). During the FIFE experiment, Nie et al. (1992) found that the four flux components measured by an EC system summed to a maximum residual of 160 W m−2. An EC system and EBBR sys-tem were collocated at site 926 for 3 days. The closure rate for the eddy-covariance system averaged 0.84 over the period of comparison (Fritschen et al., 1992). Sensible heat fluxes between both systems compared better than latent heat fluxes. Investigators noted that the systems were located 30 m apart at a heavily grazed site, which may have made fluxes found from either system unrepresentative of the entire area.
et al. (1994) showed little change in closure after a rainfall.
The largest residual to energy budget closure dur-ing the Monsoon’90 experiment (Kustas et al., 1991) occurred at the poorest-rated site (in terms of flatness and slope), with a value of 36 W m−2(Stannard et al., 1994). Typical midday Bowen-ratio values were near 1.0. The H and LE fluxes were believed to be under-measured because this was a sloping site and mean vertical wind speed may not have been equal to zero. Even coordinate rotation corrections do not compensate completely for severe slope con-ditions. The smallest residual was 2 W m−2, which occurred at the best-rated site. Stannard et al. (1994) were able to eliminate flux divergence, mismatch of source areas, and over-measurement of available en-ergy as reasons for non-closure. They concluded that under-measurement ofHand LE was most likely.
During the BOREAS experiment (Sellers et al., 1997), 24 h average closure rates over the boreal for-est ranged from 68% over dry jack pine (McCaughey et al., 1997), to 97% over black spruce (Jarvis et al., 1997). Energy-balance closure over a forest includes heat storage in stems, leaves, and air column, and energy used in photosynthesis. Measurements from a different black spruce forest within the BOREAS region resulted in closure rates as low as 80% without accounting for storage or soil heat flux (Goulden et al., 1997). Typically soil and canopy storage fluxes are less than 5% of net radiation in mature black spruce forests (Jarvis et al., 1997). Goulden et al. (1997) found no errors in instrument calibration and no non-linearity between friction velocity and vertical wind speed during neutral stability periods. They also found that lack of closure was independent of the Bowen-ratio, which led them to conclude that neither the H-measuring instrument nor the LE-measuring instrument were biased. Fluxes approached closure under three conditions: in the middle to late after-noon, when the wind came from a certain direction, and when friction velocity was relatively large. The variation of closure rate with wind direction may have proven that some areas within the measuring region were not homogeneous. The change in clo-sure rate with friction velocity may have proven that the flow was not stationary during some sampling periods. Goulden et al. (1997) also concluded that the change in closure rate with time of day proved
that a change in storage did not contribute to lack of closure.
The boreal forest has been suggested to contain the missing ‘sink’ of the global carbon budget. If, in fact, more transpiration is occurring than what has been measured with EC systems, this probably means that more photosynthesis is also occurring; therefore, the storage of carbon in biomass may also be more than what has been estimated (Goulden et al., 1998).
During an experiment in Amazonia, Wright et al. (1992) found excellent agreement between flux mea-surements from the EC method and the EBBR method. Over a 4-day measurement period, the average devi-ation of measurements from both methods from the hourly average of evaporation was 21 W m−2. Dugas et al. (1991) set three EC systems next to four EBBR systems in an irrigated wheat field in Arizona for a 2-day experiment. Bowen-ratios and sensible heat fluxes were negative the entire time due to advection from an adjacent dry bare-soil field. EC closure aver-aged near 70% over both the days of the experiment. They found that the EC measurements came closest to closure at times when latent heat fluxes were simi-lar to those estimated by the EBBR systems. From the 2 days of data discussed, these times were between noon and sundown for 1 day, where the Bowen-ratio decreased from−0.2 to−1, and only near sundown on the other day, where the Bowen-ratio decreased from−0.4 to−0.8. At all other times the EC latent heat flux was lower than the EBBR latent heat flux. EC sensible heat fluxes were also less than EBBR es-timates, but the magnitude of this bias was less than the variation in H values from four EBBR systems.
heat flux. EBBR latent heat fluxes were 30% smaller than those determined by residual-LE closure, due in part to larger estimates ofHwith the EBBR system.
The relative uncertainties associated with measure-ments of soil heat conduction flux can be large because the area of measurement is several orders of magnitude smaller than the averaging area of eddy-covariance measurements. The unequal thermal conductivities of the heat flux plate and surrounding soil can cause divergence/convergence errors; usually these errors are small because heat flux plates are made with conduc-tivities that are midway in the conductivity range of soils. VanLoon et al. (1998) describe a method for calibration that accounts for the difference in thermal conductivity between the plate and soil. To avoid prob-lems with blocking liquid and water vapor movement, heat flux plates are buried at a depth of 5–10 cm and temperature and water content measurements in the layer above the plate are used to estimate heat stor-age above the heat flux plate. Adjusting for the heat storage above the plate can be a major source of er-ror. Fortunately the soil conduction flux for fully veg-etated surfaces is relatively small, typically 5–10% of the net radiation during midday. Stannard et al. (1994) found good agreement over a 14-day period among soil surface heat flux measurements from three REBS HFT-3 plates; the kind of plates used in the SGP97 experiment.
3. Methods for energy-balance closure
The use of surface flux data to validate land sur-face models requires that conservation of energy be satisfied; therefore, the measured energy budget must be closed by some method. As we will discuss later, the net radiation is probably the most accurate measurement (accurate to about 5–7%) of the major components of the surface energy balance for large homogeneous sites even though some studies have reported otherwise based on past measurements with particular instruments (Field et al., 1992; Halldin and Lindroth, 1992). Halldin and Lindroth (1992) com-pared instruments from six different manufacturers and noted that differences with a four-component system ranged from 6 to 20%. Moreover, they found that on-site calibration of the instruments varied by as much as 30% from the manufacturers’ calibration.
Al-though poorly designed or calibrated instruments may have large errors, with reasonable care and knowledge errors of 6% in Rn are achievable. Of this 6% error in Rn, typically 3% may arise from an uncertainty of 3% in the net solar radiation and the remaining 3% comes from a 15% uncertainty in the net thermal radiation. For canopies of full cover, such as those studied in this comparison, the maximum value ofGis less than about 100 W m−2, while the typical uncertainty in the mean of measurements from two locations is less than about 15 W m−2; most of this uncertainty arises from spatial sampling. The resultant, total, probable error of Rn−G, including the random uncertainty inG, is 10% for homogeneous sites. At least 1/3 of this 10% error, that arising from soil heat flux, should be random because of spatial sampling and water content uncer-tainties, so that only a 6–7% bias in energy-balance closure should be apparent in the available energy. Based on this discussion, and more details that fol-low, the shortfall in energy-balance closure is most reasonably removed by adjustingHand LE.
Closure is most reasonably forced by assuming that the measured available energy (Rn−G) is represen-tative of the area measured by the EC system so that
fluxes at heights greater than the roughness sublayer is expected. For these two reasons, we suggest that Bowen-ratio closure may be the most appropriate.
4. Field measurement methods
The Southern Great Plains 1997 Hydrology Exper-iment (SGP97), sponsored by NASA and USDA, took place in Oklahoma during June and July of 1997 (Jack-son, 1997). The main objectives of SGP97 were to study the remote sensing of soil moisture and the ef-fect of soil moisture on the development of the at-mospheric boundary layer and clouds over the SGP97 region during the warm season (Jackson, 1997). One aspect of the project was the measurement of surface fluxes at numerous locations across the SGP97 region. Surface flux measurements were compared from seven of the 11 sites within the SGP97 region where surface flux measurements were made. This region included three main study areas: (1) The Department of Energy’s Atmospheric Radiation Measurement (ARM) experiment at the Southern Great Plains Cloud And Radiation Testbed (CART) Central Facility, (2) the USDA Agricultural Research Service (ARS) Grazinglands Research Lab in El Reno, OK and (3) the Little Washita watershed. The total area extended from about 34.5–37◦
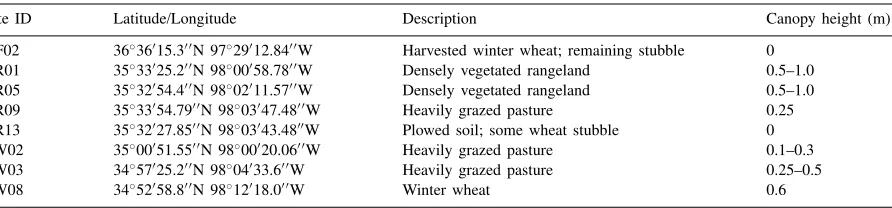
North latitude and from 97 to 99◦ West longitude. Land cover varied from bare fields to fully vegetated rangeland. Fluxes were measured or estimated from eddy-covariance (EC) systems and energy-balance-Bowen-ratio (EBBR) systems from several manufacturers. Table 1 lists SGP97 surface flux site identifiers and locations along with a descrip-tion of the sites and approximate canopy heights.
Table 1
Site identifier, site location, site description, and canopy height for SGP97 data used in this study
Site ID Latitude/Longitude Description Canopy height (m)
CF02 36◦36′15.3′ ′N 97◦29′12.84′ ′W Harvested winter wheat; remaining stubble 0
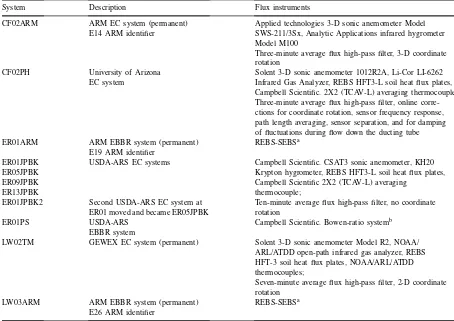
All SGP97 EC systems obtained 30 min-average values of Rn, H, LE, and G. In addition, mean and standard deviations were obtained for air temperature, windspeed, wind direction, friction velocity, and va-por pressure. EBBR systems measured net radiation, Bowen-ratio, and soil-surface heat flux. All systems that measured soil heat flux used the average output of at least two heat flux plates buried at nominal depths of 0.07 m with thermocouples at two depths to account for heat storage between the plate and the soil surface. The ARM-operated EBBR systems also measured soil moisture between the plates and the soil surface. Soil moisture in the top 5 cm was also measured at the other sites except for LW02. When multiple measurement locations forGwere available at a site, a site-averaged value of soil-surface heat flux was then determined in the hope of obtaining the best spatially representative value. System identifiers, descriptions and instruments are listed in Table 2.
Some surface flux measurement systems were col-located at site ER01 at the Grazinglands Lab for a week before the experiment began for intercom-parison and shakedown efforts. A recent rain event produced a homogeneous surface over most sites at the Grazinglands Lab. At this time, the UW-CNR1, Kipp and Zonen, four-way, net radiometer was collo-cated with five net radiometers over the USDA-ARS Grazinglands Research Lab parade ground.
Table 2
System identifier, system description, flux instruments, and EC processing methods for systems involved in this study
System Description Flux instruments
CF02ARM ARM EC system (permanent) Applied technologies 3-D sonic anemometer Model E14 ARM identifier SWS-211/3Sx, Analytic Applications infrared hygrometer
Model M100
Three-minute average flux high-pass filter, 3-D coordinate rotation
CF02PH University of Arizona Solent 3-D sonic anemometer 1012R2A, Li-Cor LI-6262 EC system Infrared Gas Analyzer, REBS HFT3-L soil heat flux plates,
Campbell Scientific. 2X2 (TCAV-L) averaging thermocouple Three-minute average flux high-pass filter, online corre-ctions for coordinate rotation, sensor frequency response, path length averaging, sensor separation, and for damping of fluctuations during flow down the ducting tube ER01ARM ARM EBBR system (permanent) REBS-SEBSa
E19 ARM identifier
ER01JPBK USDA-ARS EC systems Campbell Scientific. CSAT3 sonic anemometer, KH20
ER05JPBK Krypton hygrometer, REBS HFT3-L soil heat flux plates,
ER09JPBK Campbell Scientific 2X2 (TCAV-L) averaging
ER13JPBK thermocouple;
ER01JPBK2 Second USDA-ARS EC system at ER01 moved and became ER05JPBK
Ten-minute average flux high-pass filter, no coordinate rotation
ER01PS USDA-ARS Campbell Scientific. Bowen-ratio systemb
EBBR system
LW02TM GEWEX EC system (permanent) Solent 3-D sonic anemometer Model R2, NOAA/ ARL/ATDD open-path infrared gas analyzer, REBS HFT-3 soil heat flux plates, NOAA/ARL/ATDD thermocouples;
Seven-minute average flux high-pass filter, 2-D coordinate rotation
LW03ARM ARM EBBR system (permanent) REBS-SEBSa E26 ARM identifier
aRadiation energy balance systems surface energy balance system: Chromel-constantan thermocouple, Omega Engineering, REBS Model # ATP-1, Capacitive element, Vaisala, Model #s HMP 35A and HMP35D, Platinum Resistance Temperature Detector, MINCO Products, REBS Model #STP-1, MINCO Model #XS11PA40T260X36(D) with soil heat flow probes, radiation & energy balance systems, Model #s HFT-3, HFT3.1.
bCampbell Bowen-ratio System: Li-Cor LI-6262 CO2/H2O analyzer, Type E fine-wire thermocouples (TCBR-3), REBS HFT-3 soil heat flux transducers, Campbell Scientific 2X2 (TCAV) averaging thermocouple.
3-D Sonic Anemometer (Campbell Scientific Instru-ments, Logan, UT) to measure the three wind com-ponents and sensible heat flux, a Campbell Scientific Instruments Inc. KH20 Krypton hygrometer to mea-sure latent heat flux, and a Kipp and Zonen CNR1 four-way net radiometer (Kipp and Zonen, Delft, Holland) to measure net radiation. This system will hereafter be referred to as the UW EC system. The UW EC system measured the same fluxes as other EC systems and used three 10 min average flux values to
Table 3
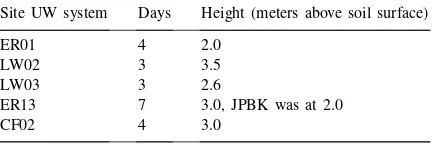
Summary of site location, number of days at site, and instrument heights for the UW roving eddy-covariance system measurement of sensible and latent heat fluxes
Site UW system Days Height (meters above soil surface)
ER01 4 2.0
LW02 3 3.5
LW03 3 2.6
ER13 7 3.0, JPBK was at 2.0
CF02 4 3.0
direction occur during an averaging period. Co-ordinate rotations were performed on sensors at CF02ARM, CF02PH and LW02TM.
After the comparison of eddy-covariance systems at site ER01, the various systems were taken to their des-ignated locations for the remainder of the experiment. One system, the University of Arizona EC system was stationed at ER01 for half of the experiment and was then moved to CF02 for the remainder of the experi-ment. Only the UW EC system was moved about from site to site during the experiment to compare flux mea-surements and to calibrate net radiometers to the UW reference. This strategy provides for a comparison of several eddy-covariance systems at the same site; then a second comparison at another site. Sites visited, du-ration of stay, and heights of instruments for the UW EC system are shown in Table 3. UW instruments were placed at the same height as the other instruments ex-cept at ER13 where the UW instruments were placed one meter above the JPBK instruments.
The soil-surface heat flux is estimated from a com-bination of REBS (Radiation Energy Balance Systems, Seattle, WA) heat flux plates and the heat storage in the soil layer above the plates. Four REBS HFT-3 plates used in SGP97 were calibrated with a specially de-signed system at the University of Wisconsin-Madison laboratories. The plates were placed in the middle of an insulated box measuring 0.66 m by 0.71 m by 0.2 m that was filled with quartz sand. The conductivity of the dry quartz sand (0.77 W m−1K−1) was midway between the likely soil conductivity variation in the field of 0.5–1.3 W m−1K−1, and the absence of water minimized errors from latent heat associated with wa-ter movement. Heat storage in the soil layer above the plates, which was based on two temperature measure-ments, gravimetric soil water content and bulk density
measurements, usually accounted for about half of the total surface heat flux.
5. Results
If the measurements of the components of the sur-face energy budget given by Eq. (1) do not balance, the discrepancy may arise from errors in any flux com-ponent. Identifying the flux components most likely to be responsible for the lack of energy-balance clo-sure requires establishing the absolute accuracy of as many flux components as possible. Therefore, the re-sults address the absolute accuracy of radiation and heat storage measurements and then consider compar-isons among eddy-covariance measurements.
5.1. Accuracy of available energy measurements
5.1.1. Net radiation
and the ARM pyranometer was 10 W m−2 on an average solar flux density of 587 W m−2(1.7%).
The second issue of spatial sampling is difficult to address in a general way because it depends on the characteristics of the sites. Although the downward-facing UW-CNR1 pyranometer was about 30 m from the ARM downward-facing pyranome-ter, the albedo from the two instruments was within 0.002 or 1% relative difference. The uniformity of the various sites used for radiation comparisons was excellent; particularly the ER01 site in El Reno, OK, where most of the net radiometer and eddy-covariance flux comparisons took place. Because pyranometers can be matched to a fraction of a percent, the abso-lute error in the net solar radiation is less than 3%; therefore, the final absolute error associated with the UW-CNR1 net solar radiation measurement is less than 3% with a 1.7% random error.
The ARM thermal radiation measurements of sky and ground fluxes are made with pyrgeometers that are matched to reference pyrgeometers at the National Oceanic and Atmospheric Administration (NOAA) to insure 3–5% consistency. Although no absolute stan-dards exist for pyrgeometers, the measurements done at the ARM sites are done as carefully as any in the world. The most difficult thermal measurement is the sky thermal flux density, because of the nonuniformity of the sky emission versus zenith angle and nonuni-form heating of the pyrgeometer domes by the sun. The upward-facing ARM pyrgeometers are shaded from the sun by an occulting disk on an equitorial mount to minimize heating of the dome by the sun; a precaution rarely taken by scientists monitoring sky thermal fluxes. A comparison between the UW-CNR1 pyrgeometer and the ARM pyrgeometer between 3 and 7 July 1997 revealed that the UW-CNR1 upward-facing pyrgeometer has an average daytime bias of+7 W m−2(2%). Under night-time conditions, the UW-CNR1 pyrgeometer measures a surface emis-sion flux density about 2 W m−2 less than the ARM pyrgeometer (<1%). The larger bias during daytime confirms the importance of solar heating on the upper surface of the unshaded UW-CNR1 pyrgeometer. The graph of the downward-facing UW-CNR1 pyrgeome-ter against the ARM downward-facing pyrgeomepyrgeome-ter yielded a slope of 0.999 and a standard error about the regression line of 2 W m−2 (0.5%). The agree-ment between the thermal radiation measureagree-ments
from the UW-CNR1 pyrgeometers and the ARM pyrgeometers is very encouraging because the ARM pyrgeometers are from Eppley Instruments in the US and the UW-CNR1 is from Kipp and Zonen in Hol-land; clearly these two companies have independent calibration references. Furthermore, the CNR1 has a flat upper surface that is not cosine corrected while the ARM Eppley instruments have domes with cosine correction; in spite of this, the agreement is excellent. The pyrgeometer measurements from the UW-CNR1 four-way radiometer were not adjusted in any way for the comparison with other net radiometers used in the SGP97 experiment. Because pyrgeometers can be matched with each other better than they can be calibrated to known absolute accuracy, the error in net thermal flux density (W m−2) should only be slightly larger than the error in the unidirectional flux density.
Fig. 1. One-to-one graph of measurements of net radiation from UW-CNR1 Kipp and Zonen net radiometer collocated with other net radiometers after UW-CNR1 has been calibrated with ARM radiation instruments.
calibrations. The other REBS net radiometers agreed well with the UW-CNR1 measurements.
The spatial variability associated with the reflected solar and emitted thermal radiation is also a source of error in net radiation measurements. However, this error should be a random error and not a bias when associated with the numerous sites used in this com-parison, so that it is not a reasonable explanation for systematic underestimates of energy-balance closure. At site ER01 two net radiometers were mounted at a height of 2 m above the ground, separated by a distance of about 100 m, and a third net radiometer mounted at a 10 m height about 50 m away from the other two radiometers. All the net radiometers agreed to within 3% of the mean of the three net-radiometer measure-ments. Clearly, spatial variability was not a significant problem at site ER01.
Table 4
Soil heat flux plate calibration in dry quartz sand expressed as percent difference between measured soil heat flux and reference flux for each plate
Plate R1 (%)a R2 (%) R3 (%) R4 (%) R5 (%) R6 (%) R7 (%) R8 (%)
REBS −10 6 −9 −15 −2 −2 −10 −6
aR1 through R4 were REBS HFT-3 plates used at ER01; R5 and R6 were REBS HFT-1; R7 and R8 were REBS HFT-3.
5.1.2. Soil-surface heat-conduction flux
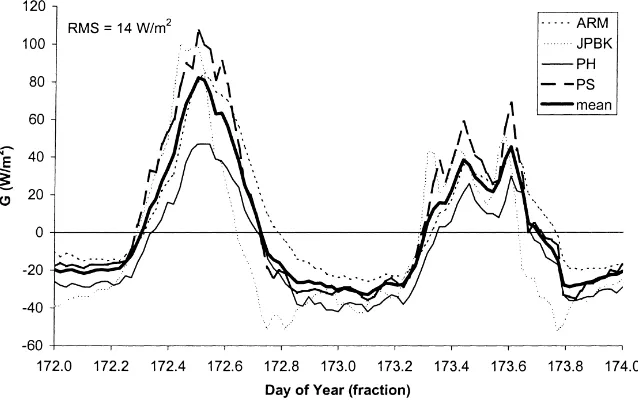
Fig. 2. Time series (30 min averages) of soil surface heat flux from several instrument systems at ER01 on DOY 172-173. Each time series is an average of two to five locations of measurements for a total of 11 locations.
the calibration box (0.77 W m−1K−1). Therefore, the range in conductivity of the silt loam at the El Reno sites suggests a typical uncertainty of about 5% in the soil heat flux plate measurement. The uncertainty as-sociated with the heat capacity of the soil layer above the heat flux plate is about 20% if water content is not measured and a nominal volumetric water content of 0.25 is always used (Campbell and Norman, 1998). Because water content in the top 5 cm of soil was measured in the SGP97 experiment, this error is re-duced to less than 10%. Combining the errors in heat flux plate accuracy and heat storage uncertainties, the probable error in the soil heat flux measurement is 15% because approximately half the flux density is measured by the heat-flux plate and 1/2 measured by the heat storage change. From the variability of calibration results in Table 4 and the random nature of soil water content errors, these errors in soil heat flux are likely to be random errors and thus are not likely to contribute to a systematic overestimate of available energy across all the sites used in the SGP97 comparison.
The spatial variability of soil-surface heat flux mea-surements is shown by the time series at site ER01 in Fig. 2 for both a clear day (DOY 172) and a partly cloudy day (DOY 173). Each data value is an average
of measurements from at least two soil heat flux plates after adjustment for heat storage between the soil sur-face and the plate. The phase response of each set of sensors may depend on the overlying surface. The re-sults in Fig. 2 include errors from sensor calibration, soil water content uncertainty and spatial variability, and suggest that the standard error associated with soil heat flux measurement at the ER01 site during flux comparisons was about 14 W m−2, or about 15–20% of a typical daytime soil heat flux. Again, these er-rors are random erer-rors and should not contribute to systematic biases in the closure of the surface energy balance.
5.2. Comparisons of eddy-covariance fluxes
5.2.1. Latent and sensible heat fluxes
Fig. 3. One-to-one graph of EC system comparison between UW Campbell Scientific (CSI) type and other CSI type systems: (a) latent heat flux (LE) measurements, and (b) sensible heat flux (H) measurements.
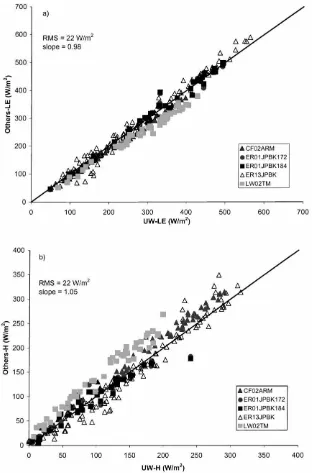
Results from the comparison of the UW EC system with three non-CSI (Mixed) types of eddy-covariance systems are shown in Fig. 4. The RMS value of 38 W m−2for LE is larger than that for the CSI com-parison. The CF02ARM system agreed with the UW EC system as well as with the CSI types, but the LW02TM system usually measured a lower latent heat flux and a slightly larger sensible heat flux than the UW EC system. All the CSI and non-CSI systems
Fig. 4. One-to-one graph of EC system comparison between UW CSI type and non-CSI (mixed) type systems: (a) LE measurements, and (b)Hmeasurements.
systems from 1000 to 1500 CST are compared in Fig. 5. Like the LE andHcomparison, Bowen-ratios compared better among the CSI type instruments while LW02TM showed the poorest correlation. The overall standard deviation for the Bowen-ratio com-parison of all EC systems is 0.18 for Bowen-ratio values that varied from 0.1 to 2.
5.2.2. Energy-balance closure
Fig. 5. One-to-one graph comparing midday Bowen-ratios (β) (1000–1500 CST) measured by the UW CSI system with Bowen-ratios measured by all other types of EC systems.
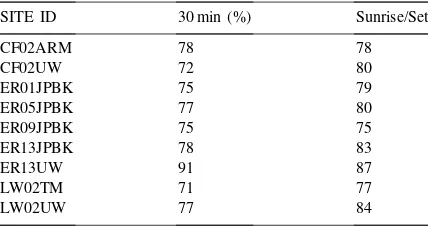
rate based on 30 min flux averages and sunrise to sunset average flux values. Sunrise to sunset aver-age flux closure rates were usually slightly greater than the 30 min values, but in some cases they were equal or smaller. These results are somewhat different from those found by Mahrt (1998), who determined that 24 h average fluxes from towers in BOREAS attained better closure than midday values of fluxes.
Closure of ER13JPBK was near 80% during the experiment period (June and July), but increased to about 90% under very dry conditions in August.
In-Table 5
Closure rates of various systems from 30 min flux averages and fluxes averaged from sunrise to sunset
SITE ID 30 min (%) Sunrise/Set
CF02ARM 78 78
CF02UW 72 80
ER01JPBK 75 79
ER05JPBK 77 80
ER09JPBK 75 75
ER13JPBK 78 83
ER13UW 91 87
LW02TM 71 77
LW02UW 77 84
creased closure rates at very dry sites may imply ac-curate sensible heat flux measurement or latent heat flux measurement errors; possible evidence for forcing closure by calculating the latent heat flux as a resid-ual of the energy budget. However, at this site, it can-not be assumed that sensible heat flux was measured more accurately than latent heat flux because the en-ergy budget did not result in an average value ofDnear unity.
5.2.3. Forcing closure
Two methods for forcing energy-balance clo-sure, that is assuring conservation of energy for the eddy-covariance measurements, are the following: (1) calculating the LE flux as a residual of the sur-face energy budget and (2) assuming the Bowen-ratio is measured accurately by the eddy-covariance sys-tem and adjusting both LE and H to preserve the Bowen-ratio and conserve energy.
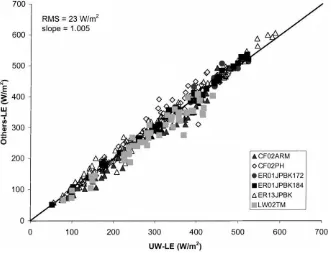
Fig. 6 shows latent heat flux values from all eddy-covariance systems (CSI and Mixed types) during daylight hours (Rn>50 W m−2) after the en-ergy budget has been closed by estimating the latent heat flux as the residual of the surface energy bud-get and ignoring the latent heat flux measurements. The scatter seen in Fig. 4a has decreased with this method and contributes to the total standard devia-tion of 23 W m−2. The bias toward low LE values from the LW02TM system seen in Fig. 4a has been eliminated. CF02PH LE values appear here since LE measurements were not used in this comparison. It was possible to close the energy budget for this
sys-Fig. 6. Comparison of LE estimates from the UW EC system with LE estimates from other EC systems after applying residual LE closure to the energy budget. All LE estimates were obtained as a residual from the surface energy balance using measured values of Rn,G, andH. tem since only values of Rn,H, andGwere used in this method of closure.
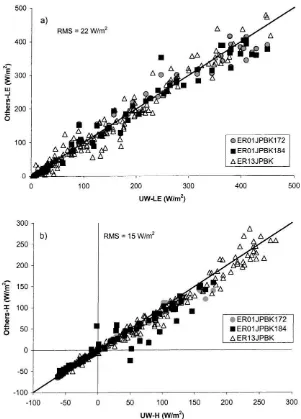
Fig. 7 shows LE and Hduring daylight hours as-suming that energy was correctly partitioned into the Bowen-ratio, although values ofHand LE may have been under-measured. This closure method resulted in an RMS value of 22 W m−2for LE, which is not sta-tistically different from closing the energy budget with residual LE (Fig. 6), although LW02TM values retain the low bias seen in Fig. 4a.
Fig. 7. Comparison of (a) LE, and (b)Hfluxes from the UW EC system with fluxes from other EC systems after closure using measured Bowen-ratio.
closure because of uncertainties in the value and phase ofG.
Another way to evaluate the preferred method for closing the measured energy budget may be to com-pare eddy-covariance measurements to EBBR
Table 6
Comparison of LE and H from UW EC measurements with three EBBR measurement systems at two sites using two closure methods for the UW EC system. The slope of the regression (forced through the origin) of each EBBR flux measurement against the adjusted UW EC flux and the standard error about the regression line are tabulated
UW EC closed with residual-LE method UW EC closed with Bowen-ratio method Slope Standard error (W m−2) Slope Standard error (W m−2)
LE ER01ARM 1.14 29 1.17 26
LE ER01PS 0.85 17 0.84 22
LE LW03ARM 0.83 36 0.99 13
H ER01ARM 0.51 26 0.47 24
H ER01PS 0.91 18 0.93 22
H LW03ARM 1.23 48 1.01 13
from three EBBR systems at two sites with the UW EC system. The slope of a 1:1 regression (adjusted UW EC fluxes on abcissa) and the standard error about the regression line are included for both closure assump-tions of the UW EC system for both LE andH. The results in Table 6 do not demonstrate a clear advantage for either closure method. However, the Bowen-ratio closure method agrees more closely with the EBBR measurements for the LW03ARM system, which clearly had the largest sensible heat fluxes (300 W m−2
for LW03ARM versus 100 W m−2 for ER01ARM
and ER01PS) and may thus represent the best test with the lowest EBBR measurement errors. Because of the large disagreement between ER01ARM fluxes ofHand other measurements, the results are less con-clusive than desirable. However, the flux of H from ER01ARM does not agree with the UW EC flux ofH
regardless of the closure method used. A small error in the temperature gradient measurement at ER01ARM (approximately 0.1–0.2 C) could account for this dis-agreement because of small fluxes ofH; however, the actual reason for this discrepancy is unknown.
5.3. Implications for CO2fluxes
The lack of closure of the surface energy budget alerts us to the possibility that eddy-covariance flux measurements may be underestimates of the actual fluxes. With other fluxes, such as CO2 or momen-tum, applying a conservation principle to check the validity of the fluxes is not practical. If the under-estimation of eddy covariance fluxes arises from a fundamental process, such as point measurements not accommodating dispersive fluxes or covariance
measurements along the direction of the mean wind missing some of the total covariance, then we might expect the underestimates to carry over to other fluxes because of similarity among fluxes. The relationship between the underestimation of evaporation flux and the possible underestimation of CO2 flux can be in-vestigated by determining both fluxes with several independent methods: (1) Direct measurement using eddy covariance instruments, (2) direct measure-ment with conditional sampling, (3) measuremeasure-ment by energy-balance-Bowen-ratio method combined with CO2 concentration gradient (EBBR/CO2) and (4) estimation by combining the scaling of leaf measure-ments to the canopy with soil-surface measuremeasure-ments of CO2flux. Such an experiment was done at Lincoln, NE on 15–18 July, 1992 over sorghum.
pressure measurements within the infrared-gas-analyzer sampling cell, which were monitored for later correc-tions. The various corrections to the water vapor and CO2fluxes, including Webb–Pearman, sensor spacing and tube-damping corrections, typically were about 20%. The conditional-sampling measurements (by J. Baker) were made at a height of 2.5 m with the same instruments as those used for eddy-covariance mea-surements (Baker et al., 1992). Eddy covariance heat and water vapor measurements (without CO2 mea-surements) were made at a height of 2.2 m using two CSI one-dimensional sonic anemometers and krypton hygrometers (by B. Tanner, J. Green and E. Swaitek). The eddy-covariance krypton hygrometer measure-ments (corrected for Webb-Pearman effects) agreed reasonably with the corrected, closed-path (LI-6262) measurements (mean difference in LE over all mea-surements was 10 W m−2). EBBR/CO2measurements of heat, water vapor, and CO2 fluxes were made at two locations with CSI equipment (by B. Tanner, J. Green and E. Swaitek) with lower sampling at 1.7 m and upper sampling at 2.5 m. Net radiation was mea-sured at two locations (by J. Baker and B. Tanner) with instruments from two manufacturers that agreed within about 20 W m−2. Soil heat flux was measured
Fig. 8. Four flux ratios are plotted against the closure fraction based on 30 min measurements: (1) The ratio of CO2 flux measured by conditional sampling to scaled-leaf CO2 flux (open squares), (2) the ratio of CO2 flux measured by conditional sampling to CO2 flux measured by EBBR with CO2concentration gradient (solid squares), (3) the ratio of CO2flux measured by eddy-covariance to scaled-leaf CO2flux (open circles) and (4) the ratio of CO2flux measured by eddy-covariance to CO2flux measured by EBBR with CO2concentration gradient (solid circles). The 1:1 line corresponds to the condition that CO2flux is underestimated by the same amount as evaporation flux. at four locations at a depth of 0.08 m with temperature measurements at 0.02 and 0.06 m. Leaf physiological measurements (leaf photosynthetic rate and stom-atal conductance) for scaling were made through out the experiment with LI-6200 (LICOR, Lincoln, NE) gas exchange systems (by J. Welles, D. McDermitt and K. Peterson). Soil-surface measurements of CO2 fluxes also were made during the experiment with the LI-6200 (by T. Arkebauer, P. Mielnick, K. Leap-ley, and D. Lathrop) to adjust scaled photosynthesis measurements for surface fluxes to match microm-eteorological measurements. The scaling method is described in Norman et al. (1992) and incorporates ef-fects of light interception, atmospheric humidity, wind speed and CO2concentration. In addition, the scaling approach includes the effect of a leaf boundary-layer resistance in the LI-6200 chamber being lower than the boundary-layer resistance on leaves in the field.
conditional-sampling fluxes (Fig. 8). The CO2 flux ratios that fall along the 1:1 line in Fig. 8 indicate that eddy-covariance CO2 fluxes are underestimated by the same fraction as eddy covariance evapora-tion fluxes. Clearly the flux ratios referenced to the EBBR/CO2 measurements (dark symbols in Fig. 8) show that CO2fluxes measured with eddy covariance and conditional sampling instruments are underesti-mated by the same factor as measured energy fluxes. The scaled-leaf estimates of CO2flux are completely independent of any micrometeorological flux mea-surements and thus represent a truly independent test of the closure effect on CO2 fluxes. Although the CO2flux ratios referenced to the scaled-leaf estimates (open symbols in Fig. 8) show more scatter than CO2 flux ratios referenced to EBBR/CO2 measurements, the results show that eddy-covariance and conditional sampling measurements of CO2 fluxes are underesti-mated by comparable fractions to the water vapor flux under-measurements. Clearly these results support the similarity of measured, eddy-covariance, CO2 and water vapor fluxes; namely, that CO2 fluxes are underestimated by an amount similar to water vapor fluxes when energy-balance closure is not achieved.
6. Concluding remarks
Energy into and out of a region of measurement must be conserved, but eddy-covariance systems do not always satisfy conservation of energy. Surface fluxes can be under-measured for a number of rea-sons including mismatched sources of LE and H, inhomogeneous surface cover and soil characteristics, flux divergence or dispersion, non-stationarity of the flow, lack of a fully developed turbulent surface layer, flow distortion, sensor separation, topography and instrument error.
During the Southern Great Plains 1997 Hydrol-ogy Experiment, eddy-covariance systems appeared to under-measure LE and H fluxes systematically by 10–30%. The accuracy of net radiation measure-ments was shown to be 6% of the midday, clear sky, mid-season fluxes. The random errors in spatial sam-pling of reflected solar and emitted thermal radiation and random errors in soil heat flux should not produce systematic biases in closure over the four different sites involved. Thus the consistent shortfall in LE
and H fluxes from eddy-covariance measurements at all sites with all instruments is most likely to be associated with the eddy-covariance measurements themselves and not net radiation and soil heat flux measurements. Even if all the random errors in net radiation and soil heat flux are included as errors in the available energy (Rn–G), these errors represent only about 1/2 of the shortfall in LE andH.
The fetch at ER01, which was much larger than the minimum suggested by Leclerc and Thurtell (1990) and Heilman et al. (1989), and the rain that occurred just before the comparison, provided a near-ideal site for measuring micrometeorological fluxes. Sensor sep-aration did not account for lack of closure as Krypton hygrometers were placed within 10 cm of the sonic anemometer transducers on all systems so that errors were less than 3% of the fluxes (Villalobos, 1997). Although UW EC measurements were not coordinate transformed, three other systems in the comparison used coordinate rotations and their closure rates were equal to or less than the UW EC system.
Non-stationarity and flux divergence may be fac-tors in the lack of closure, but they cannot be easily assessed and flux values cannot be easily corrected for this influence. Clearly a variety of factors may prevent the eddy-covariance systems from measuring all the turbulent scales correctly; therefore, the most reason-able assumption is that closure should be forced in order to account for measurement inadequacies. Sen-sible and latent heat fluxes from the eddy-covariance systems compared best to fluxes from EBBR sys-tems when closure was forced by assuming that eddy-covariance systems accurately partitionedHand LE fluxes into the Bowen-ratio. Furthermore, we see no reason to discard LE measurements as would be required with the residual LE method. This implies that eddy-covariance systems underestimated H and LE in the same proportion. This might also mean that the friction velocity is underestimated — a difficult hypothesis to test. The results from an experiment in Lincoln, NE over sorghum in 1992, which included 13 participants from five institutions, suggest that CO2 flux is undermeasured by the same factor as evapotranspiration flux.
Fig. 9. Total daytime LE in equivalent millimeters of water over DOY 180–195 at the USDA Grazinglands Research Lab measured using the four eddy-covariance systems and calculated after closure of the energy budget according to both suggested methods of closure.
systems, is shown in Fig. 9. The bars show three quantities: (1) The measured LE, (2) LE after closure is forced by calculating LE as the residual to the en-ergy budget and (3) LE after closure is forced using the measured Bowen-ratio. Regardless of the method of closure, differences between measured LE and LE after forcing closure can become significant with time. For sites that can be treated as relatively homoge-neous such that Rn−Gis considered reliable and rep-resentative of the eddy covariance flux footprint, our recommendation is to close eddy-covariance energy flux measurements. Since there is no compelling ev-idence that latent heat flux is under-measured more significantly than the sensible heat flux, the method of closure that assumes the Bowen-ratio is measured accurately is probably most reasonable. Results from this study suggest Bowen-ratio closure is preferred but do not prove it. A record of this closure factor should be maintained with the data so that the original mea-surements can be easily restored at some date in the future if desirable.
Acknowledgements
This research was supported by NASA Grant NAGW-4138, USDA Cooperative Agreement No. 58-1270-7-008, and the University of Wisconsin Ex-periment Station. The authors appreciate the efforts of Dr. Tom Jackson of USDA Hydrology Laboratory in Beltsville, MD for his leadership of the SGP97 experiment.
Jerry L. Hatfield from USDA-ARS National Soil Tilth Laboratory and Tom J. Sauer from USDA-ARS Biomass Research Center provided valuable assistance in the maintenance of the four flux towers operating at the El Reno facility during SGP97. Analyses of ARM Bowen-ratio data were supported by the US Depart-ment of Energy under Contract No. W-31-109-Eng-38 as part of the Atmospheric Radiation Measurement Program of the Office of Energy Research, Office of Health and Environmental Research.
of Campbell Scientific, Logan, UT; Jon Welles, Dayle McDermitt and Kerry Peterson of LICOR, Lincoln, NE; John Baker of the USDA/ARS, University of Minnesota, St. Paul, MN; Tim Arkebauer, Pat Miel-nick, Kevin Leapley, and David Lathrop of the Uni-versity of Nebraska, Lincoln, NE; John Norman and Tim Wilson, University of Wisconsin, Madison, WI. The measurements were done on the farm of Harry and Raymond Leavitt.
The authors thank the reviewers and editors for their patient and constructive assistance in the refining of this paper.
References
Adams, R.S., Black, T.A., Fleming, R.L., 1991. Evapotranspiration and surface conductance in a high elevation, grass-covered forest clearcut. Agric. For. Meteorol. 56, 173–193.
Ashktorab, H., Pruitt, W.O., PawU, K.T., George, W.V., 1989. Energy balance determinations close to the soil surface using a micro-Bowen ratio system. Agric. For. Meteorol. 46, 259–274. Baker, J.M., Norman, J.M., Bland, W.L., 1992. Field scale application of flux measurement by conditional sampling. Agric. For. Meteorol 62, 31–52.
Baldocchi, D., Valentini, R., Running, S., Oechel, W., Dahlman, R., 1996. Strategies for measuring and modeling carbon dioxide and water vapour fluxes over terrestrial ecosystems. Global Change Biol. 2, 159–168.
Barr, A.G., King, K.M., Gillespie, T.J., denHartog, G., Neumann, H.H., 1994. A comparison of Bowen ratio and eddy correlation sensible and latent heat flux measurements above deciduous forest. Boundary-Layer Meteorol. 71, 21–41.
Blanken, P.D., Black, T.A., Yang, P.C., Newmann, H.H., Nesic, Z., Staebler, R., denHartog, G., Novak, M.D., Lee, X., 1997. Energy balance and canopy conductance of a boreal aspen forest: partitioning overstory and understory components. J. Geophys. Res. 102 (D24), 28915–28928.
BORCAL, 1997. Broadband outdoor radiometer calibration report, 14–31 July 1997, Atmospheric Radiation Measurement Archive, Calibration Facility, Southern Great Plains.
Campbell, G.S., Norman, J.M., 1998. Introduction To Environmental Biophysics. Springer, New York.
Dabberdt, W.F., Lenschow, D.H., Horst, T.W., Zimmerman, P.R., Oncley, S.P., Delany, A.C., 1993. Atmosphere-surface exchange measurements. Science 260, 1472–1481.
Dugas, W.A., Fritschen, L.J., Gay, L.W., Held, A.A., Matthias, A.D., Reicosky, D.C., Steduto, P., Steiner, J.L., 1991. Bowen ratio, eddy correlation, and portable chamber measurements of sensible and latent heat flux over irrigated spring wheat. Agric. For. Meteorol. 56, 1–20.
Field, R.T., Fritschen, L.J., Kanemasu, E.T., Smith, E.A., Stewart, J.B., Verma, S.B., Kustas, W.P., 1992. Calibration, comparison, and correction of net radiation instruments used during FIFE. J. Geophys. Res. 97 (D17), 18681–18695.
Fitzjarrald, D.R., Moore, K.E., 1994. Growing season boundary layer climate and surface exchanges in a subarctic lichen woodland. J. Geophys. Res. 99 (D1), 1899–1917.
Fritschen, L.J., Qian, P., Kanemasu, E.T., Nie, D., Smith, E.A., Stewart, J.B., Verma, S.B., Wesely, M.L., 1992. Comparisons of surface flux measurement systems used in FIFE 1989. J. Geophys. Res. 97 (D17), 18697–18713.
Goulden, M.L., Daube, B.C., Fan, S.M., Sutton, D.J., Bazzaz, A., Munger, J.W., Wofsy, S.C., 1997. Physiological responses of a black spruce forest to weather. J. Geophys. Res. 102 (D24), 28987–28996.
Goulden, M.L., Wofsy, S.C., Harden, J.W., Trumbore, S.E., Crill, P.M., Gower, S.T., Fires, T., Daube, B.C., Fan, S.M., Sutton, D.J., Bassas, A., Munger, J.W., 1998. Sensitivity of boreal forest carbon balance to soil thaw. Science 279, 214–217.
Halldin, S., Lindroth, A., 1992. Errors in net radiometry: comparison and evaluation of six radiometer designs. J. Atmos. Oceanic. Technol. 9, 762–783.
Heilman, J.L., Brittin, C.L., Neale, C.M.U., 1989. Fetch requirements for Bowen ratio measurements of latent and sensible heat fluxes. Agric. For. Meteorol. 44, 261–273. Hodges, G.B., Smith, E.A., 1997. Intercalibration, objective
analysis, intercomparison and synthesis of BOREAS surface net radiation measurements. J. Geophys. Res. 102 (D24), 28885–28900.
Jackson, T., 1997. Experiment plan: Southern Great Plains 1997 (SGP97) Hydrology Experiment, USDA-ARS Hydrology Laboratory, Beltsville, MD.
Jarvis, P.G., Massheder, J.M., Hale, S.E., Moncrieff, J.B., Rayment, M., Scott, S.L., 1997. Seasonal variation of carbon dioxide, water vapor, and energy exchanges of a boreal black spruce forest. J. Geophys. Res. 102 (D24), 28953–28966.
Katul, G., Hsieh, C.-I., Bowling, D., Clark, K., Shurpali, N., Turnipseed, A., Albertson, J., Tu, K., Hollinger, D., Evans, B., Offerle, B., Anderson, D., Ellsworth, D., Vogel, C., Oren, R., 1999. Spatial variability of turbulent fluxes in the roughness sublayer of an even-aged pine forest. Boundary-Layer Meteorol. 93, 1–28.
Kustas, W.P., Goodrich, D.C., Moran, M.S., Amer, S.A., Bach, L.B., Blanford, J.H., Chehbouni, A., Claassen, H., Clements, W.E., Doraiswamy, P.C., Dubois, P., Clarke, T.R., Daughtry, C.S.T., Gellman, D.I., Grant, T.A., Hipps, L.E., Huete, A.R., Humes, K.S., Jackson, T.J., Keefer, T.O., Nichols, W.D., Parry, R., Perry, E.M., Pinker, R.T., Pinter, J.P.J., Qi, J., Riggs, A.C., Schmugge, T.J., Shutko, A.M., Stannard, D.I., Swiatek, E., vanLeeuwen, J.D., vanZyl, J., Vidal, A., Washburne, J., Weltz, M.A., 1991. An interdisciplinary field study of the energy and water fluxes in the atmosphere-biosphere system over semi-arid rangelands: description and preliminary results. Bull. Am. Meteorol. Soc. 72, 1683–1705.
Kustas, W.P., Prueger, J.R., Humes, K.S., Starks, P.J., 1999. Estimation of surface heat fluxes at field scale using surface layer versus mixed layer atmospheric variables with radiometric temperature observations. J. Appl. Meteorol. 38, 224–238. Leclerc, M.Y., Thurtell, G.W., 1990. Footprint prediction of scalar
Lloyd, C.R., P. Bessemoulin, F.D. Cropley, A.D. Culf, A.J. Dolman, J. Elbers, B. Heusinkveld, J.B. Moncrieff, B. Monteny, A. Verhoef, 1997. A comparison of surface fluxes at the HAPEX-Sahel fallow bush sites. J. Hydrol., 188-189:400-425. Mahrt, L., 1998. Flux sampling errors for aircraft and towers. J.
Atmos. Oceanic Technol. 15, 416–429.
McCaughey, J.H., Lafleur, P.M., Joiner, D.W., Bartlett, P.A., Costello, A.M., Jelinski, D.E., Ryan, M.G., 1997. Magnitudes and seasonal patterns of energy, water, and carbon exchanges at a boreal young jack pine forest in the BOREAS northern study area. J. Geophys. Res. 102 (D24), 28997–29007. Moncrief, J.B., Malhi, Y., Leuning, R., 1996. The propagation of
errors in long-term measurements of land-atmosphere fluxes of carbon and water. Global Change Biol. 2, 231–240.
Moore, C.J., 1986. Frequency response corrections for eddy correlation systems. Boundary-Layer Meteorol. 37, 17–35. Nie, D., Kanemasu, E.T., Fritschen, L.J., Weaver, H.L., Smith,
E.A., Verma, S.B., Field, R.T., Kustas, W.P., Stewart, J.B., 1992. An intercomparison of surface energy flux measurement systems used during FIFE 1987. J. Geophys. Res. 97 (D17), 18715–18724.
Norman, J.M., J.M. Welles, D.K. McDermitt, 1992. Estimating canopy light-use and transpiration efficiencies from leaf measurements. LICOR Application Note 105, LICOR, Lincoln, NE 68504.
Reda, I., 1996. Results of NREL pyrheliometer comparisons, 1–5 October 1996. NPC1096, National Renewable Energy Laboratory, Measurement and Instrumentation Team. Sauer, T.J., Norman, J.M., Tanner, C.B., Wilson, T.B., 1995.
Measurements of heat and vapor transfer coefficients at the soil
surface beneath a maize canopy using source plates. Agric. For. Meteorol. 75, 161–189.
Sellers, P.J., Hall, F.G., Asrar, G., Strebel, D.E., Murphy, R.E., 1992. An overview of the first international satellite land surface climatology project (ISLSCP) field experiment (FIFE). J. Geophys. Res. 97 (D17), 18345–18371.
Sellers, P.J., Hall, F.G., Kelly, R.D., Black, A., Baldocchi, D., Berry, J., Ryan, M., Ranson, K.J., Crill, P.M., Lettenmaier, D.P., Margolis, H., Cihlar, J., Newcomer, J., Fitzjarrald, D., Jarvis, P.G., Gower, S.T., Halliwell, D., Williams, D., Goodison, B., Wickland, D., Guertin, F.E., 1997. BOREAS in 1997: experiment overview, scientific results, and future directions. J. Geophys. Res. 102 (D24), 28731–28769.
Stannard, D.I., Blanford, J.H., Kustas, W.P., Nichols, W.D., Amer, S.A., Schmugge, T.J., Weltz, M.A., 1994. Interpretation of surface flux measurements in heterogeneous terrain during the Monsoon’90 experiment. Wat. Resour. Res. 30 (5), 1227–1239.
Unland, H.E., Houser, P.R., Shuttleworth, W.J., Yang, Z.-L., 1996. Surface flux measurement and modeling at a semi-arid Sonoran Desert site. Agric. For. Meteorol. 82, 119–153.
VanLoon, W.K.P., Bastings, H.M.H., Moors, E.J., 1998. Calibration of soil heat flux sensors. Agric. For. Meteorol. 92, 1–8. Villalobos, F.J., 1997. Correction of eddy covariance water vapor
flux using additional measurements of temperature. Agric. For. Meteorol. 88, 77–83.