EVALUATION OF ASTER GDEM v.2 USING GPS CHECKPOINTS, OSGB DEM
VALUES AND PHOTOGAMMETRICALLY DERIVED DEMS
Haval Sadeq, Jane Drummond, Zhenhong Li.
School of Geographical and Earth Sciences, College of Science and Engineering, University of Glasgow, G12 8QQ, UK. ([email protected]).
Commission IV, WG IV/6
KEYWORDS: ASTER GDEM, accuracy, bias, test-sites, slope-effect, coastal-effect.
ABSTRACT:
A 2010 study examining ASTER GDEM v1 data revealed accuracies of 12-25m and strong negative discrepancy biases compared to precise GPS observations, in several test sites in China. Rather than further investigating these, with the advent of ASTER GDEM v2 a new series of tests, also using precise GPS observations but also other DEMs, was performed. In these tests better than the expected 17m accuracies were found (RMSE values of 3.9m to 15.3m) and no strong biases.
1. BACKGROUND
A study, with colleagues (Li, et al., 2012) revealed accuracies of 12-25m in five Chinese test areas when comparing ASTER GDEM v1 values with high accuracy GPS check points. This accuracy was poorer than expected, but also exposed a strong negative bias in most of the test areas. For purposes of comparison SRTM data of the test areas were also investigated revealing no negative bias. The test areas were coastal, agricultural, steep /mountainous and high plateau. We proposed several reasons for the bias including landcover effects, the lack of a water mask and other systematic errors in the data processing. It was planned to look at the data further in more extensive areas in China and three test sites in the UK (mountainous, coastal and agricultural). However the very recent advent (October, 2011) of ASTER GDEM v2 encouraged us to immediately investigate these new data, particularly with respect to the negative bias, using the three British test areas, only. Comparisons were planned with GPS check points, 10m DTMs supplied by the national mapping organization (Ordnance Survey of Great Britain or OSGB) and in-house generated digital photogrammetric DTMs. Investigation has shown improved accuracy (15.2m, 8.7m and 3.7m, respectively) in the three sites. This paper will present the findings and details of our validation with regard to the three test areas and the four data sources (ASTER GDEM v2; OSGB Profile DTMs; digital photogrammetry; high accuracy GPS).
2. TEST AREAS
The test areas are Plockton (forest /mountainous), Caerlaverock Merse (coastal/ salt-marsh/pasture), Wicken Fen (low lying/ inland/arable). They are located in northern, central, and southern Britain, as follows (shown by their approx. centrepoints’ Lat/Long):
Lat Long
Plockton 57.33oN 5.61oW Caerlaverock Merse 54.98oN 3.54oW
o o
photogrammetric heights (derived from digitally processed 1:14000 scale RC20 aerial photography, flown 2004); all heights are on the ODN vertical datum (that used by OSGB).
3. METHODOLOGY
For all three areas ASTER GDEM v2 was compared with OSGB Profile DTMs. The ASTER GDEM v2 is supplied at 1 arc-second resolution (approx. 30x15m at the UK’s latitude), with geographical coordinates based on the WGS84 ellipsoid and height values based on the EGM96 geoid. The coordinates used by ASTER are the same as the Google Earth reference system, importantly with heights, for the UK, some 30m different from those based on the WGS84 ellipsoid, according to Lemoine et al. (1998). The difference between the EGM96 and ODN is small, being about 80cm over the British Isles (Stillman, 2009). The data sets were imported into ArcMap having been appropriately labelled for their original planimetric coordinates (ASTER: Lat, Long on WGS84; OSGB Profile: BNG). The project in ArcMap was set up with BNG planimetric coordinates, thus, on import to ArcMap, ASTER Lat, Long values were displayed as BNG coordinates. The height correction, ensuring both terrain models were based on the same vertical datum (ODN), involved a simple -80cm shift to the ASTER data. Thus all terrain models were approximately the same resolution, and the same coordinate frame and vertical datum.
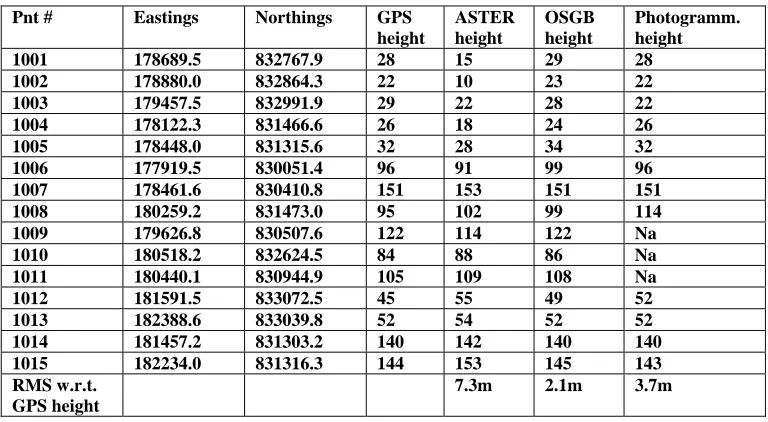
TABLE 1. Check point accuracies derived from precise GPS points 1001:1015 and their corresponding ASTER GDEMv2, OSGB and photogrammetrically derived heights (all heights with respect to the ODN vertical datum).
Pnt # Eastings Northings GPS
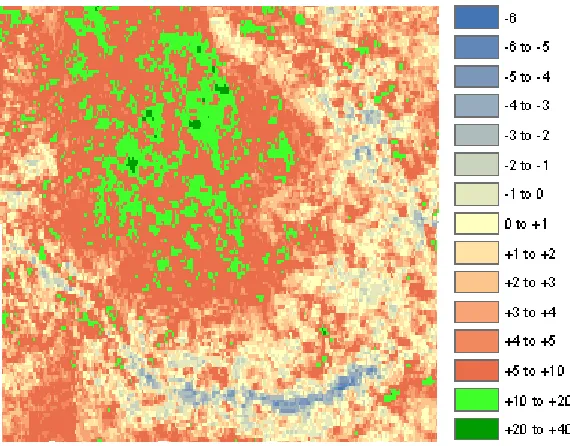
The findings for Plockton are shown in Figures 1 and 2, for Caerlaverock Merse in Figure 3 and for Wicken Fen in Figure 4. The same methods are used in all three areas, that is producing a difference map of the Aster and OSGB terrain models - heights with respect to the same vertical datum (ODN). Shifts from EGM96 to ODN are from the Google-Earth-Plotter facility (Stillman, 2009). The legend for differences between OSGB and ASTER is similar for each test area and is in Fig 1a for the Plockton case.
Some consideration was given to the stack numbers also supplied with ASTER GDEM v2. This gives, per pixel, the number of images processed to provide heights. In the Plockton case the maximum number was 7, which is low, and the mean was 4; results are quoted as being especially poor for stack numbers of 4 or less (MicroImages, 2009). The correlation coefficient for stack number against absolute height differences was only -0.07, indicating stack numbers’ unimportance in this case.
5. CONCLUSIONS
The ASTER GDEM v2 data are within their specified accuracy of 17m and show no large negative bias; the Wicken Fen area shows a small positive bias. Perhaps the bias previously found related to the choice of datum? Largest discrepancies are found where slopes are steep and in coastal, low lying areas where image matching may be difficult. An anomalous situation (level arable land below sea-level) requires further consideration, particularly considering
ASTER GDEM’s potential use for flood management in these and coastal areas.
6. REFERENCES
Lemoine, FG., Kenyon, SC., Factor, JK., Trimmer, RG., Pavlis, NK., Chinn,DS., Cox, CM., Klosko, SM., Luthcke, SB., Torrence, MH., Wang, YM., Williamson, RG., Pavlis, EC., Rapp, RH. and Olson, Tr., 1998. “The Developoment of the Joint NASA GSFC and NIMA Geopotential Model EGM96”,
http://cddis.nasa.gov/926/egm96/ egm96.html
Li, P., Li, Z., Shi, C., Muller, J-P., Drummond, J.,and Liu, J., 2012. “Validation of ASTER GDEM Using GPS Benchmarks and SRTM over China”, Int.Jo.RS, in press.
Stillman, D.M., 2009. “Plotting Surveying Data in Google Earth”, http//code.google.com/ p/google-earth-plotter
MicroImages Inc, 2009. “ASTER GDEM Accuracy Assessment” http://www.microimages.com/documentation/ TechGuides/75asterDEM.pdf
7. ACKNOWLEDGEMENTS
Anne Dunlop, Kenny Roberts and the BSc Class of 2007 GeoInfo&MappingScience students, Glasgow Univ., for GPS observations.
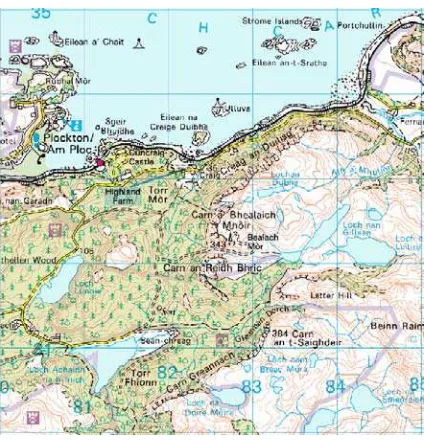
Figure 1. Plockton Study area.
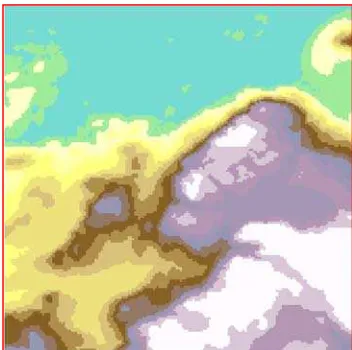
Figure 1a. ASTER GDEM v2 and OSGB Height Differences, for Plockton, created from Figs. 2a and 2b (below) . Green pixels are those whose positive difference exceeds three times the RMS Difference and purple pixels are those whose negative difference exceeds three times the RMS Difference, coinciding with steep forested areas and intertidal islands, in this case, as can be seen in
Figure 1b.
Figure 2. Plockton Study area, continued.
Figure 2a ASTER GDEM v2 heights, Plockton area Figure 2b OSGB Profile heights, Plockton area.
Figure 2c. Histogram of differences, Plockton, between ASTER v2 and OSGB terrain models
Largest negative difference/error: 66.2m Largest positive difference/error: 116.1m Mean difference: -1.1m
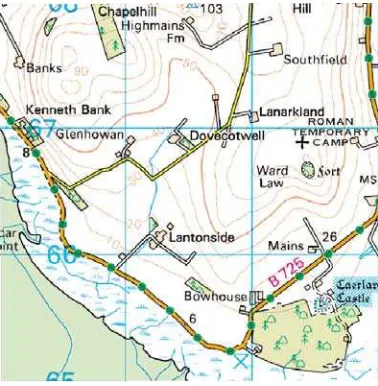
Figure 3. Caerlaverock Study Area
Fig 3a. . Difference between ASTER v2 and OSGB heights in Caerlaverock area. (Green pixels are those with positive or negative differences > 3 x RMSdifferences)
Fig 3b. Topographic map of Caerlaverock – an area of salt-marsh and pasture, without steep slopes. Differences
-30 to -25
-25 to -20
-20 to -15
-15 to -10
-10 to -5
-5 to 0
0 to 5
5 to 10
10 to 15
15 to 20
20 to 25
25 to 30
Fig 3c. Histogram of Differences, Caerlaverock, between ASTER v2 and OSGB terrain models
Largest negative diff./error: -30.7m Largest positive diff./error: 39.9m Mean difference: 0.4m
Figure 4. Wicken Fen Study Area
Figure 4a. Difference between ASTER v2 and OSGB heights in Wicken area. (Green pixels are those with discrepancies > 3 x RMSdifferences)
Figure 4b. Topographic Map of Wicken area (extremely level, low-lying - some, Soham Mere - below sea-level), arable and
residential terrain)
Figure 4c. Histogram of differences between ASTER v2 and OSGB terrain models, Wicken Fen area.