www.elsevier.com/locate/econedurev
Improving teacher preparation and selection: lessons from
the Pennsylvania experience
Robert P. Strauss
a,*, Lori R. Bowes
a, Mindy S. Marks
b, Mark R. Plesko
caThe Heinz School, Carnegie Mellon University, Pittsburgh, PA 15213-3890, USA bDepartment of Economics, Washington University, St. Louis, MO, USA
cSchool of Computer Science, Carnegie Mellon University, Pittsburgh, PA 15213-3890, USA
Received 15 December 1997; accepted 15 June 1999
Abstract
This paper examines Pennsylvania’s teacher preparation and selection processes over the last decade. Teacher test scores are examined across colleges of education, and extreme differences in teacher test scores are found. Also, extreme variations are evident among districts’ employed teachers. A unique survey of district employment practices reveals that, on average, 40% of a district’s teachers previously attended there as students. An exploratory econometric model indicates that the higher the unemployment rate in a district, the more likely it will hire its former students to teach, and that the greater the fraction of former students now in the district’s teacher force, the lower is student achievement. The paper concludes with a discussion of conventional and unconventional strategies to improve the quality of teachers actually hired by school boards.2000 Elsevier Science Ltd. All rights reserved.
JEL classification: I21; I22
“You’re damn right we only hire by nepotism in this district. But there are two kinds of nepotism:
1. Good nepotism is when this Board you and I were elected to is smart enough to hire my son or daughter, and
2. Bad nepotism is when this Board is dumb enough to hire your son or daughter.”
—Minutes of New Castle, Pennsylvania School Board Meeting, as reported in the New Castle News.
* Corresponding author. Tel.: +1-412-269-4798; fax: + 1-412-268-7036.
E-mail address: [email protected] (R.P. Strauss).
0272-7757/00/$ - see front matter2000 Elsevier Science Ltd. All rights reserved. PII: S 0 2 7 2 - 7 7 5 7 ( 0 0 ) 0 0 0 0 9 - 1
1. Introduction
1.1. Some preliminaries
thereof. Such accountability models presume that those in charge of local public education, facing financial rewards and penalties, will adjust their activities in order to gain rewards and avoid penalties.
The public education system, however, is a very com-plicated set of large institutions that may react defens-ively to external criticism or externally imposed change. The result often is that they remain immune or unrespon-sive to systems of financial rewards and penalties unless great care (and courage) is taken to place these incentives at meaningful locations in the public education system. The very size, complexity and unresponsiveness of the system probably explains why some favor side-stepping the frustrating problems of redesign, political and admin-istrative implementation and simply favor giving parents of school-age children vouchers. In this view, empow-ered parents can buy education services from whomever wishes to sell them. Whether parents will have adequate or sufficient information about these new entrants into the education business to make wise choices for their children is usually not (openly) discussed. Advocates often assert that such alternatives have to be better than the current morass, or that anything will be better that what currently exists.
Legislative battles in many states over the nature of charter schools or vouchers often center on whether or not the teachers in these new forms of schools must be certificated like their public school counterparts. Debate often focuses on whether teacher certification, and edu-cation school course-work in particular, is necessary or sufficient to ensure effective classroom teaching. Under-lying much of the debate over charter schools or vouch-ers is often an (unstated) antipathy to teachvouch-ers’ unions, teacher tenure, large and unresponsive bureaucratic school administrations, and unpopular local property taxes, increasingly falling on homeowners, as well as a concern that US secondary students do worse on stan-dardized tests than their counterparts in other parts of the world.
To understand where among and within public edu-cation institutions policy change can improve student performance, one must step back and examine its overall institutional architecture. Free provision of public edu-cation to school age children, who are required by law to attend some form of school, is typically a state consti-tutional obligation. State laws in our older, industrialized states typically create local school districts on a parallel basis to municipalities, and empower them to impose local real estate taxes which, in conjunction with state payments to school districts, are used to pay for school costs. Local school districts are also empowered to issue debt for capital purposes and required to balance their budgets and to report to the state on their financial activi-ties. Typically capital activities (debt issuance and school construction) are heavily supervised by state agencies to ensure safety and proper use of funds.
State constitutions also typically require that impo-sition of any tax be through an elected council or legis-lative body. In the case of school districts, school direc-tors often serve pro bono, and act as the state legislature’s agents in providing a thorough and efficient education. School director elections are often non-parti-san in contrast to other local state and local elections which prohibit cross-over voting by voters with expressed political affiliation.
While there are relatively few requirements on who may serve as a school board director, the statutory and regulatory requirements about who may teach in a public school are both very complicated and often very impre-cise.
In Pennsylvania, to be eligible to become a member of a school board, one need only be a citizen of Pennsyl-vania, a person of good moral character, 18 years or older, and have been a resident of the school district for at least one year prior to election or appointment.1Direct
self-dealing is limited statutorily in several ways:
1. School employees are prohibited in Pennsylvania, under Act 2 of 1980, from serving on a board where they are employed; however, this does not preclude them serving on a board where they live if the district of residence is different than the district of employ-ment.2
2. School board members are prohibited under the School Code, Section 1111, from voting on the appointment of a relative to a teaching position on the board;
3. The Public School Code, at Section 324, directs no school director from being interested in, or doing business, with the school district during the term of office.3
Teachers in most states, however, must earn educational credentials, have a college degree, and pass certain stan-dardized tests. By and large, a college degree, which reflects some sort of course work on pedagogy and the content area in which the prospective teacher will teach, in conjunction with passing scores on standardized tests, are all that are required to become certified. The degree is typically from a state approved program of teacher
1 Act 138, June 16, 1972, reduced the age of a school direc-tor to 18.
2 Only Philadelphia and Pittsburgh may impose residency requirements for teachers and school administrators; all other districts are prohibited from doing so.
preparation, and standardized tests are devised by national testing firms such as Educational Testing Ser-vice or National Evaluation Systems. These are, as will be indicated below, rather minimal requirements, and often do not attract the most academically talented indi-viduals.
Changes in student and teacher demographics, as well as rising expectations for student performance, are cre-ating new classroom needs and opportunities for substan-tially renewing many districts’ teachers. In the older, industrialized states, school age children will be rela-tively older in the next ten to fifteen years, thereby requiring relatively more secondary than elementary classroom teachers. At the same time, classroom teachers are, much like the rest of our society, getting older, and retirements will provide an opportunity to hire younger, less expensive teachers, and hopefully those able (or bet-ter able) to ensure that students can achieve high learn-ing standards.
Some have commented that these demographic changes should be recognized by teacher preparation institutions so they prepare teachers with the right skills for the classroom needs of the next century. However, higher education faces its own financial incentives, and also has its own rigidities towards change. Colleges and universities with sizable education schools find it diffi-cult to alter the activities of their own highly tenured education faculties, some also unionized, to not only train the right sort of teachers, but also ensure that those trained are able to help students achieve high learning standards. Another aspect of higher education’s struggle with its schools of education involves the cross-subsidiz-ation which educcross-subsidiz-ation schools provide for other parts of their campus. Professional schools are often viewed with suspicion by other parts of a university campus, and schools of education perhaps fare worst. They are fre-quently viewed as profit centers to be taxed to support other programs. Admissions policies are then pursued which encourage many, who would otherwise not attend college, to prepare for a career in education which may never materialize.
Relatively little emphasis has been placed by edu-cational researchers on the role of the local employment decision and role of elected, volunteer school boards in responding to public demands for better student perform-ance, although several recent papers have demonstrated that many local school districts do not hire the most aca-demically qualified applicants.4 Ballou & Podgursky
(1997) concluded:
1. Higher teacher salaries have had little if any discern-ible impact on the quality of newly recruited teachers.
4 See Ballou & Podgursky (1995, 1997) and Ballou (1996).
2. The failure of this policy can be traced, in part, to structural features of the teacher labor market. 3. Recruitment of better teachers is further impeded by
the fact that public schools show no preference for applicants who have strong academic records.5
While they go on to propose, as solutions to these prob-lems, market-based salaries based on performance, our analysis of the public education problem below focuses on the employment and personnel management decisions and the institutional/legal framework within which they are made for several reasons.
First, Pennsylvania, along with other states, accords a permanent teaching certificate quite early in the career of teachers. Even in states which no longer have life-time certification, recertification typically requires no more than earning continuing education credits through inservice training, or, as in the case of Pennsylvania, col-lege credits without regard to the linkage between teach-ing content area and graduate courses taken.
Second, evaluation of historical personnel in any pro-fessional organization is frequently difficult, and especially so when one cannot readily measure outcomes as in the private sector. Simply ascribing student achievement to the efforts of an individual teacher ignores the obvious reality that student achievement is cumulative and dependent on those who taught the stud-ent earlier, as well as the studstud-ent’s own intellect, motiv-ation, and home environment. Third, given the aging of the teacher force, there may be an opportunity, if decision makers are selective, to raise the quality of the teacher force by both improving the teacher preparation process as well as improving the teacher selection pro-cess.
Thus, while we agree with the Ballou & Podgursky (1997) observations about the results of teacher hiring practices, we arrive at a different set of policy rec-ommendations to remedy them; however, neither set of recommendations precludes the other.
Who a district hires, unless they choose to leave vol-untarily, is thus likely to be with the school district for a very long time. The employment decision, because it is therefore a long-term decision, involves the long-term commitment to pay salaries which will rise with if not above the rate of inflation. One commentator6on an
earl-ier version of this paper observed that the sort of finan-cial commitment made at the time of hiring is on the order of $300,000 to $500,000 per teacher, or well above the national median price of a new home purchase of $125,000. As we shall see below, many school districts in Pennsylvania do not pay enough attention to the per-sonnel process, and make such $300,000 to $500,000
decisions on the basis of no more than an hour of con-sideration.
The purpose of this paper is:
1. to provide a variety of facts about public school teacher preparation in Pennsylvania and around the US which are not well known, and will be of general interest; and,
2. to interpret these facts in relation to the public policy design problem of creating incentives which will pro-mote high learning standards.
The data on the matters of the nature of teacher prep-aration and certification and selection decisions in Pennsylvania are compelling. They raise serious ques-tions about whether local control as currently construed, the mantra of public education in the US, is capable of doing any more than ensure mediocrity. When one looks closely at who gets hired, how they get hired and retained, to teach in our public school classrooms, much of the mystery and confusion about mediocre student performance disappears. How one changes this, how-ever, is not easy, and will likely be controversial.
1.2. Organization of paper
The paper is organized as follows:
Section 2 outlines the major features of the market for classroom teachers in Pennsylvania.
Section 3 explores the quality of teachers prepared in Pennsylvania teacher preparation institutions and the sel-ectivity of school districts in their hiring practices as reflected in the content knowledge scores achieved by prospective and employed teachers;
Section 4 reports the results of an extensive survey of Pennsylvania school district employment practices, cor-relations across districts between differing personnel practices and average student achievement in mathemat-ics and reading in 1996, and some econometric estimates of an exploratory model of who gets hired and the effects on student achievement.
Section 5 summarizes the stylized facts and their implications for educational policy, vis a` vis teacher preparation standards, program approval, and the stan-dardization of employment practices by local school boards.
2. The market for classroom teachers in Pennsylvania and their preparation
Pennsylvania’s 501 school districts currently enroll about 1.8 million students; they have employed about 100,000 classroom teachers annually for the last 15 years; overall there are about 130,000 professional
per-sonnel in the public education system. In the 1990s, between 3,700 to 6,300 teachers were hired annually; new hires have increasingly come from the experienced teacher force. In 1984 54% of newly hired teachers had prior experience; in 1996 68% of newly hired teachers had prior teaching experience in Pennsylvania. In 1996 only 1,285 newly hired teachers had no prior teaching experience. Somewhere between 4,000 and 6,000 teach-ers, administrators and coordinators have been annually hired by all of Pennsylvania’s local districts and inter-mediate units. In 1993 a temporary early retirement win-dow was opened by the Pennsylvania General Assembly. About 10,000 teachers, administrators and coordinators retired, and about 8,000 new hires took place. Hires of inexperienced classroom teachers have been on the order of no more than 2,000 per year, and in the last two years, that number has dropped to no more than 1,200.
Like teachers in other industrialized states, Pennsyl-vania’s teachers are getting closer to retirement: the median age was 45 and the median years of professional experience was 19 years; 25% of Pennsylvania’s class-room teachers had 26 or more years of experience.
2.1. Supply of teaching certificates from Pennsylvania colleges and universities
Pennsylvania trains far more teachers than it hires. Pennsylvania currently has better than 90 teacher prep-aration institutions including 14 state supported insti-tutions which were originally two year normal schools. In the past several years, Pennsylvania certificating insti-tutions have issued better than 20,000 certificates per year of various kinds. Compared to the 1980s, the pro-duction of various teaching and administrative certifi-cates is accelerating. It follows, of course, that the vast bulk of newly trained teachers each year are unable to obtain teaching positions in Pennsylvania. Table 1 dis-plays the astounding production of teaching certificates by broad certification area over 5 year intervals.7
2.2. Supply and demand through school year 2005
Demographic analysis of student enrollment by school district, grade and course through 2005, and demo-graphic analysis of possible teacher retirement scenarios by school district and course through 2005 indicate a wide range of teacher replacement needs.8Table 2
indi-cates by broad certification area the ratio of hiring needs, under three retirement assumptions and historical quits,
7 Note that the Total column includes certificates issued before 1966. Also, departmental records before the mid-1960s were not computerized.
391
R.P.
Strauss
et
al.
/
Economics
of
Education
Review
19
(2000)
387–415
Education certificates by broad area across timea
Certification area 66–70 71–5 76–80 81–85 96–90 91–95 96–97 Total
Administrative/supervisory 1,476 3,444 5,214 5,009 4,753 4898 2,147 28,202
Agriculture 17 42 59 64 32 31 14 286
Art 1,508 3,095 2,617 1,279 1,038 1,786 708 12,452
Biology 841 1,409 938 667 901 1,120 554 6,611
Business education 1,238 1,718 1,312 913 772 860 344 7,658
Chemistry 238 537 355 289 387 529 298 2,675
Coordinate services 3,387 8,113 6,824 3,820 4,186 6,588 3,011 36,619
Driver education 346 926 781 343 232 279 85 3,133
Early childhood 320 1,382 3,260 3,080 3,304 6,438 2,428 20,492
Earth/space 178 446 300 148 180 292 113 1,678
English 5,258 8,384 4,818 2,750 2,714 4,865 1,929 31,596
French 1,015 1,560 679 385 330 477 205 4,912
General elementary 17,374 31,512 20,020 11,432 13,892 28,316 11,017 138,934
General science 1,580 1,900 1,215 995 975 1,569 679 9,556
German 317 577 333 189 134 217 86 1,931
Gifted 2 3 0 0 0 0 0 6
Health/phys education 2,097 5,275 4,348 2,951 1,754 2,660 1,106 20,517
Hearing impaired 68 205 380 344 267 308 158 1,747
Home economics 1,297 2,094 1,499 659 364 333 166 6,801
Industrial arts 554 1,154 1,133 795 458 493 230 5,045
Mathematics 2,572 4,419 2,469 1,580 2,565 4,087 1,552 19,684
Mental/phys handi 1,780 4,214 6,266 5,543 4,542 6,586 3,260 32,536
Music 1,568 3,244 3,415 2,074 1,604 2,287 818 15,310
Not listed elsewhere 588 2,633 5,423 3,817 5,304 7,327 1,652 26,829
Other handicapped 139 864 1,255 251 91 64 17 2,684
Other languages 271 287 173 120 135 175 69 1,369
Other science 143 52 19 31 14 3 0 507
Physics 243 490 302 169 225 512 230 2,219
Reading specialists 411 2,106 4,035 2,743 2,145 2,856 1,085 15,417
Social studies 5,964 9,841 4,818 2,607 2,842 4,982 1,895 35,346
Spanish 961 1,747 997 550 551 1,007 515 6,550
Speech/lang impaired 511 1,385 1,980 1,302 814 853 343 7,300
Visually impaired 55 151 228 157 134 291 119 1,145
Vocational education 1,045 1,253 1,844 1,198 870 1,101 516 8,006
Vocational health 86 46 84 27 34 61 36 381
Vocational tech educt 61 78 69 51 50 53 27 392
Total 55,509 106,586 89,462 58,332 58,593 94,304 37,412 516,526
R.P.
Strauss
et
al.
/
Economics
of
Education
Review
19
(2000)
387–415
Table 2
Pennsylvania classroom teacher hiring needs: 1997–2005 as percentage of 1996/7 employed classroom teachersa
Model 1 Model 2 Model 3 Model 1 Model Model 3 Total predicted demand as % of 1996/7
1997–05 1997–05 1997–05 teachers
Certification area 96/7 Quits Age 65 30 yrs Age 55 and Quits Age 65+ 30 yrs+ 55 and 27+ Model 1 Model 2 Model 3
teachers (ann. retires exper. 27 yrs exp 1997–05 quits quits quits Rep % Age Rep % 30 Rep %
Avg) Retires retires 65 yrs 55+27
(2) (3) (4) (5) (6) (7) (8) (9) (10) (11) (12) (13)
Agriculture 162 8 13 58 52 72 85 130 124 53% 80% 77%
Art 1,532 46 121 778 688 414 535 1,192 1,102 35% 78% 72%
Biology 1,858 32 330 1,084 1,026 288 618 1372 1,314 33% 74% 71%
Business education 1,926 42 385 1,182 1,119 378 763 1,560 1,497 40% 81% 78%
Chemistry 967 24 168 522 491 216 384 738 707 40% 76% 73%
Driver education 226 3 43 171 161 27 70 198 188 31% 88% 83%
Early childhood 1,385 26 (100) 184 121 234 134 418 355 10% 30% 26%
Earth/space 612 11 81 386 334 99 180 485 433 29% 79% 71%
English 6,662 102 1,122 4,106 3,860 918 2,040 5,024 4,778 31% 75% 72%
French 786 19 123 462 442 171 294 633 613 37% 81% 78%
General elementary 39,787 559 (1,388) 13,826 11,559 5,031 3,643 18,857 16,590 9% 47% 42%
General science 2,027 38 325 1,197 1,143 342 667 1,539 1,485 33% 76% 73%
German 402 10 69 239 229 90 159 329 319 40% 82% 79%
Gifted 586 7 36 306 289 63 99 369 352 17% 63% 60%
Health/phys education 3,123 73 325 1,823 1,567 657 982 2,480 2,224 31% 79% 71%
Home economics 1,652 30 316 877 775 270 586 1,147 1,045 36% 69% 63%
Industrial arts 1,939 34 281 1,192 1,042 506 587 1,498 1,348 30% 77% 70%
Mathematics 6,067 94 906 3,653 3,380 846 1,752 4,499 4,226 29% 74% 70%
Music 1,834 97 117 728 594 873 990 1,601 1,467 54% 87% 80%
Other languages 178 5 40 93 87 45 85 138 132 48% 78% 74%
Other science 28 0 3 15 14 0 3 15 14 11% 54% 50%
Physics 544 12 93 280 267 108 201 388 375 37% 71% 69%
Social studies 5,782 66 1,061 3,804 3,627 594 1,655 4,398 4,221 29% 76% 73%
Spanish 1,559 28 238 714 691 252 490 966 943 31% 62% 61%
Vocational educat 532 22 130 241 262 198 328 439 460 62% 83% 87%
Vocational health 30 1 11 8 15 9 20 17 24 67% 57% 80%
Vocational tech 6 5 26 115 99 45 71 160 144 31% 71% 64%
Total 82,412 1,394 4,875 38.044 33.934 12 546 17,421 50.59 46.48 21% 61% 56%
in relation to the number of employed classroom teachers in 1996/7.
Three different retirement assumptions are enter-tained: (1) teachers will retire at age 65; (2) teachers will retire upon reaching 30 years of service; or (3) teachers will retire when they have achieved 27 years of service and age 55 (the incentives in place in 1993).
Columns 8, 9, and 10 of Table 2 show the projected accumulated retirements and voluntary quits between 1997 and 2005 under the three retirement assumptions. Each projection also takes into account changing student demographics and course enrollments. Columns 11, 12, and 13 show the projected turnover rate, or the percent-age of the currently employed teachers (Column 2) who will be replaced between now and school year 2005.
This analysis indicates:
1. The net number of elementary teachers will decline overall across the next 9 years by 1,388 teachers if elementary school teachers wait until age 65 to retire. Under the other retirement assumptions, around 11– 14,000 elementary school teachers will be needed, of whom 5,000 will be due to voluntary quits.
2. If teachers retire earlier, e.g. do not wait until age 65 to retire, the numbers of teachers needed jumps dramatically to somewhere between 46,000 and 50,000 or anywhere from 56% to 61% of the 1996/7 stock of employed teachers.
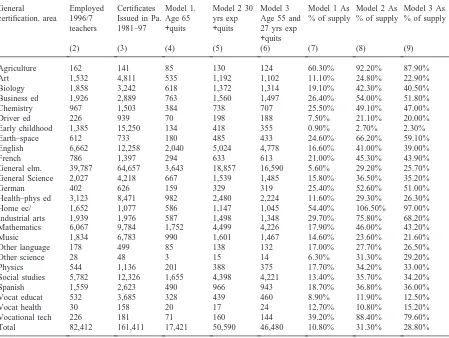
3. When one combines the predictions with historical teacher production levels, it is difficult to reach the conclusion that there will be teacher shortages. Table 3 indicates that there are vast numbers of certified teachers produced during the 1980s and 1990s who actually outnumber the number of employed teachers by about 2:1 overall. In areas such as elementary edu-cation, mathematics, and social studies, vast numbers of teachers were trained. The ratio of hiring needs or demand to this measure of supply is anywhere from 12% to 65%, depending on the certification area in question.
Several conclusions suggest themselves from this analy-sis. The public education system has an opportunity under reasonable or accelerated retirement scenarios to employ younger teachers, who presumably will be con-siderably less expensive than those retiring, and an opportunity, if selective, to employ teachers more able to ensure that students meet high learning standards. The problem local districts will face involves how to choose wisely among many applicants.9
9 See Section 4 below for school district survey results on the ratio of applicants to vacancies.
2.3. Pennsylvania’s teacher certification framework
To be employed as a public school teacher in Pennsyl-vania, the applicant:
1. must be of good moral character;
2. is mentally and physically qualified to perform the duties of a teacher;
3. is 18 years of age; and,
4. have earned a baccalaureate degree as a general edu-cation requirement in a program of teacher prep-aration approved by the Pennsylvania Department of Education, and be recommended to the Department of Education for certification by the program.10
Also, under ¶49.18 (a) of the Teacher Certification Regu-lations, the Secretary of Education was required, as of May 9, 1985, to “institute a testing program for candi-dates for certification designed to assess their basic skills, general knowledge, professional knowledge, and knowl-edge of the subjects in which they seek certification”.
As a practical matter, those interested in pursuing a career in public school teaching must apply to and be admitted to a college or university which has an approved program of teacher preparation. Such programs are approved by area of certification, e.g. elementary education, various types of special education, or areas of specialization at the secondary level (social studies, mathematics, etc.). Satisfactory completion of the pro-gram’s stipulated course requirements, coupled with a letter of recommendation, and passing scores on stan-dardized teacher examinations offered by the Edu-cational Testing Service of Princeton, New Jersey, enables one to obtain teacher certification. In turn, such certification enables the applicant to be legally employed by a public school district.
2.4. SAT scores of Pennsylvania high school seniors interested in education careers
Pennsylvania is among 19 states that do not require standardized tests for admissions to teacher preparation programs. Some evidence is available from ETS, how-ever, on the comparative scholastic aptitude of those interested in becoming public school teachers compared to other college majors in Pennsylvania. Table 4 displays the mean verbal and math SAT scores for Pennsylvania and the US for 1996, and the combined math and verbal score stated as the percentile in the overall national dis-tribution of scores. Several things are evident. First, Pennsylvania’s SAT scores are lower than their counter-part US scores; this has been explained by some observers as due to large numbers of Pennsylvania high
Table 3
Balance between Pennsylvania’s projected classroom teacher needs (1997–2005) and historical supply of new certificates issued 1981– 97 in Pennsylvaniaa
General Employed Certificates Model 1. Model 2 30 Model 3 Model 1 As Model 2 As Model 3 As certification. area 1996/7 Issued in Pa. Age 65 yrs exp Age 55 and % of supply % of supply % of supply
teachers 1981–97 +quits +quits 27 yrs exp
+quits
(2) (3) (4) (5) (6) (7) (8) (9)
Agriculture 162 141 85 130 124 60.30% 92.20% 87.90%
Art 1,532 4,811 535 1,192 1,102 11.10% 24.80% 22.90%
Biology 1,858 3,242 618 1,372 1,314 19.10% 42.30% 40.50%
Business ed 1,926 2,889 763 1,560 1,497 26.40% 54.00% 51.80%
Chemistry 967 1,503 384 738 707 25.50% 49.10% 47.00%
Driver ed 226 939 70 198 188 7.50% 21.10% 20.00%
Early childhood 1,385 15,250 134 418 355 0.90% 2.70% 2.30%
Earth–space 612 733 180 485 433 24.60% 66.20% 59.10%
English 6,662 12,258 2,040 5,024 4,778 16.60% 41.00% 39.00%
French 786 1,397 294 633 613 21.00% 45.30% 43.90%
General elm. 39,787 64,657 3,643 18,857 16,590 5.60% 29.20% 25.70%
General Science 2,027 4,218 667 1,539 1,485 15.80% 36.50% 35.20%
German 402 626 159 329 319 25.40% 52.60% 51.00%
Health–phys ed 3,123 8,471 982 2,480 2,224 11.60% 29.30% 26.30%
Home ec/ 1,652 1,077 586 1,147 1,045 54.40% 106.50% 97.00%
Industrial arts 1,939 1,976 587 1,498 1,348 29.70% 75.80% 68.20%
Mathematics 6,067 9,784 1,752 4,499 4,226 17.90% 46.00% 43.20%
Music 1,834 6,783 990 1,601 1,467 14.60% 23.60% 21.60%
Other language 178 499 85 138 132 17.00% 27.70% 26.50%
Other science 28 48 3 15 14 6.30% 31.30% 29.20%
Physics 544 1,136 201 388 375 17.70% 34.20% 33.00%
Social studies 5,782 12,326 1,655 4,398 4,221 13.40% 35.70% 34.20%
Spanish 1,559 2,623 490 966 943 18.70% 36.80% 36.00%
Vocat educat 532 3,685 328 439 460 8.90% 11.90% 12.50%
Vocat health 30 158 20 17 24 12.70% 10.80% 15.20%
Vocational tech 226 181 71 160 144 39.20% 88.40% 79.60%
Total 82,412 161,411 17,421 50,590 46,480 10.80% 31.30% 28.80%
a Source: Supply–Demand simulation model.
Table 4
1996 SAT scores of high school seniors by intended college majora
Mean SAT verbal Mean SAT math Combined mean math Combined math and and verbal verbal percentile
US education 487 477 964 37.7%
PA education 483 471 954 35.3%
US math 552 626 1178 85.3%
PA math 542 614 1156 81.9%
US biological science 546 545 1091 69.0%
PA biological science 540 528 1068 63.7%
US physical science 575 595 1170 84.1%
PA physical science 562 578 1140 79.1%
US language and literature 605 545 1150 80.9%
PA language and literature 595 527 1122 75.6%
US business 482 500 982 42.2%
PA business 479 488 967 38.5%
school students taking the examinations. Second, Pennsylvania’s high school seniors intending to become education majors score substantially below their counter-parts interested in pursuing academic majors. For example, the mean math SAT score of an intended edu-cation major was 471 compared to a 614 for intended math majors, or a 30% difference. A 471 is well below the median or 50th percentile. Compare the combined percentiles of an intended education major in Pennsyl-vania at the 35th percentile to the 82nd percentile for an intended math major. When the verbal score of intended education majors, 483, is compared to that of an intended language and literature major of 595, we observe a 26% difference in absolute scores. The relative overall pos-ition of intended education majors and language and literature majors is, respectively, the 35th and 81st per-centiles.
Another way to view these SAT scores is to recognize that 65% of those taking the SAT test in 1996 demon-strated greater scholastic aptitude than those intending to return to public education upon earning their teaching certificate.
There is national evidence that those who got hired and remain in teaching have SAT scores at about the 25th percentile of all employed college graduates.11 If
the academic aptitude level of classroom teachers hovers around the 25th or 35th percentile of those overall, it is easy to understand why international comparisons of US 14 year olds compares unfavorably with their counter-parts around the world. Having classroom teachers with below average aptitude levels themselves can easily dilute the motivation and achievement level of the majority whom they teach, since the majority of students in the classroom display stronger academic aptitude than their classroom teacher did.
2.5. National Teacher Examination (NTE) tests and passing levels
Beginning in the late 1980s, Pennsylvania, along with many other states, began testing the general and content knowledge of prospective teachers. In 1987, Pennsyl-vania replaced its own teacher preparation tests with selected ETS examinations. The National Teacher Exam and its successor, Praxis, is designed by ETS to measure competency in the knowledge of core basic skills (reading, writing, and mathematics), competency in core education knowledge (general, professional and communication), and competency in the content knowl-edge in various specialty areas.
States vary widely in their use of ETS testing pro-ducts. As of January, 1997, ETS core battery tests in reading and writing were used by 22 states and the
11 See Hanushek & Pace (1995).
Department of Defense, but only 14 purchased the ETS mathematics examination, and fewer (11) purchased the mathematics content knowledge test; only 6 purchased the mathematics test of proofs, models and problems. Only California and Oregon purchased the second math-ematics test of proofs, models and problems. It seems likely that states which test their mathematics teachers more widely are more demanding of what their math-ematics teachers know about mathmath-ematics than states which do not test as widely.
The current versions of the various exams do not pur-port to measure teacher classroom effectiveness, usually described as pedagogy, although the core battery tests of professional knowledge test for understanding of peda-gogy as contrasted with actual effective classroom per-formance. Also, the NTE/Praxis tests are not validated on the subsequent performance of the teacher’s students’ performance or academic achievement, rather they have been developed on the notion of developing a pool of competent teachers as determined by practitioners and those in teacher preparation programs. The definition of what constitutes a minimum level of content knowledge is left to the states to determine through annual panels of experienced teachers who review the most recent examinations, and set passing thresholds based on their peer evaluation.12
While ETS is emphatic in their position that NTE/Praxis tests do not measure the competency of a prospective teacher, common sense suggests that the greater the content knowledge competency of a class-room teacher, the stronger the likelihood that the teach-er’s students will have an opportunity to learn that parti-cular subject matter. That is, subject matter knowledge or content knowledge, as reflected in higher NTE/Praxis tests, is a necessary but not sufficient condition for being an effective teacher. This would seem especially important at the middle school and secondary levels.
In Pennsylvania, prospective teachers must pass ETS’s National Teacher Exam core battery tests in Communi-cation Skills, General Knowledge, and Professional Knowledge, and as of 1997 also core battery tests in Reading and Writing (but not Mathematics) and ETS subject matter tests.13Passing scores are determined by
the Department through panels of experienced teachers, and have been implemented over time.
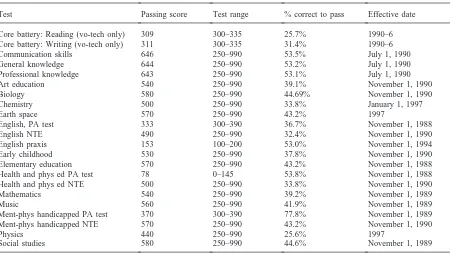
Table 5 shows the passing score (Column 2), test range (Column 3), a calculation of the fraction of ques-tions of average difficulty correctly answered which are
12 See the discussion below in Section 3.1 on evidence of the relationship between teacher content knowledge and student achievement.
Table 5
Pennsylvania teacher examination passing scoresa
Test Passing score Test range % correct to pass Effective date
Core battery: Reading (vo-tech only) 309 300–335 25.7% 1990–6
Core battery: Writing (vo-tech only) 311 300–335 31.4% 1990–6
Communication skills 646 250–990 53.5% July 1, 1990
General knowledge 644 250–990 53.2% July 1, 1990
Professional knowledge 643 250–990 53.1% July 1, 1990
Art education 540 250–990 39.1% November 1, 1990
Biology 580 250–990 44.69% November 1, 1990
Chemistry 500 250–990 33.8% January 1, 1997
Earth space 570 250–990 43.2% 1997
English, PA test 333 300–390 36.7% November 1, 1988
English NTE 490 250–990 32.4% November 1, 1990
English praxis 153 100–200 53.0% November 1, 1994
Early childhood 530 250–990 37.8% November 1, 1990
Elementary education 570 250–990 43.2% November 1, 1988
Health and phys ed PA test 78 0–145 53.8% November 1, 1988
Health and phys ed NTE 500 250–990 33.8% November 1, 1990
Mathematics 540 250–990 39.2% November 1, 1989
Music 560 250–990 41.9% November 1, 1989
Ment-phys handicapped PA test 370 300–390 77.8% November 1, 1989
Ment-phys handicapped NTE 570 250–990 43.2% November 1, 1990
Physics 440 250–990 25.6% 1997
Social studies 580 250–990 44.6% November 1, 1989
a Source: Pennsylvania Department of Education, Bureau of Teacher Preparation, and ETS.
needed to pass (Column 4), and the effective date the passing score was set (Column 5). Since the test range of the tests is centered above zero, typically from 250 to 990, and guessing is allowed without penalty on these examinations, there really are fewer points available to be earned than the top score of, say, 990. If we subtract the lower bound of the range, we note that 740 points are available to be earned since 250 points are available simply for taking the test. If we subtract 250 from the median score and from 990, we can calculate the per-centage of questions of average difficulty that must be correctly answered to pass the test.
In general, one need not score better than 50% correct to pass the teacher content knowledge examinations in Pennsylvania, and, in the basic area of reading, one need correctly answer only 26 percent of the questions of average difficulty. The fact that the passing scores or cut scores are set so low necessarily implies very high pass-ing rates for those who take the NTE examination. For Pennsylvania they are, with the exception of Social Stud-ies and the most recent science examinations, on the order of 95% or higher.14Low cut scores, coupled with
vague15and loosely applied teacher preparation program
approval standards, through forgiving state oversight,
14 See Strauss (1994) for a discussion of these high pass rates. 15 See Section 2.
implies that virtually anyone can become certified to teach in Pennsylvania if they are willing to spend a num-ber of years taking teacher preparation courses and achi-eve the cut scores. This was especially the case in phys-ics, chemistry, and earth and space science during the period 1987–97 when there was no cut score whatsoever promulgated by the Pennsylvania Department of Edu-cation, and remains the case for General Science which continues not to have any cut score.16An interested
gen-eral science teacher candidate merely has to take the ETS general science test to pass it.
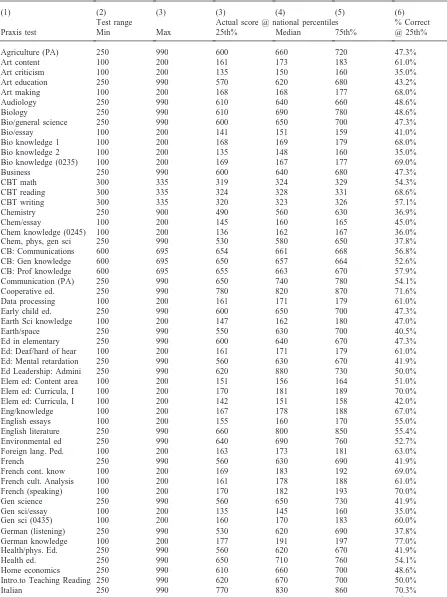
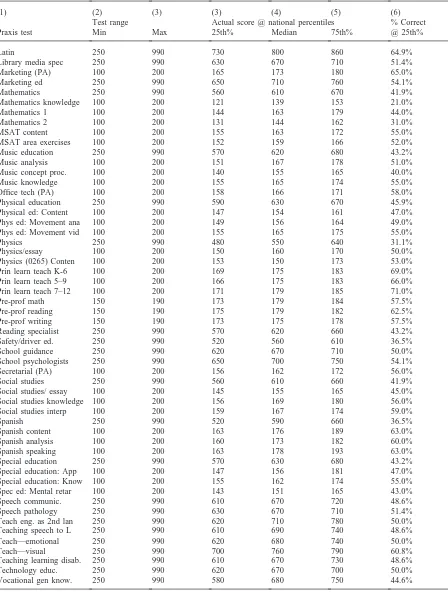
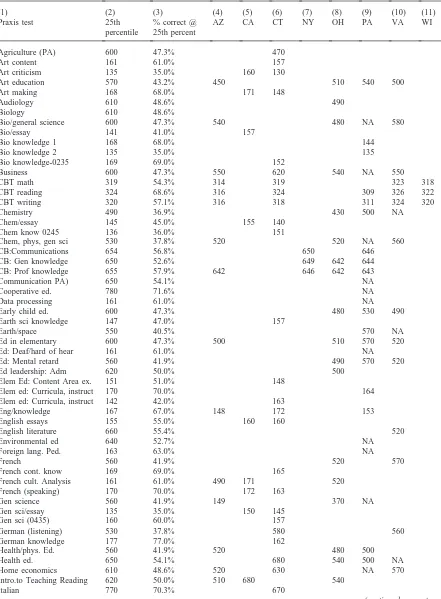
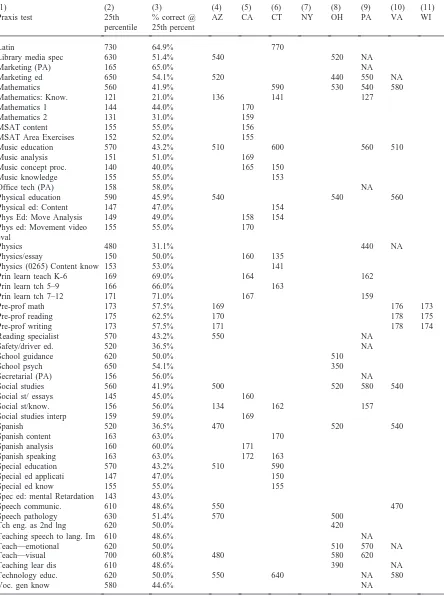
Table 6 shows all of ETS’ Praxis teacher tests, the range of test scores (Column (2) and Column (3)), the national scores at the 25th, 50th, and 75th percentiles of the national distribution (columns (3)–(5)), and the percentage of questions of average difficulty correctly answered for the score at the 25th percentile (column (6)).
Table 7 carries forward from Table 6 the actual score at the 25th percentile, the percentage of questions of average difficulty answered correctly at that score, and then, in subsequent columns, the passing scores as of
Table 6
1998 Praxis test ranges, 1997 actual national score distributions, and % correct at 25th percentile of national distributiona
(1) (2) (3) (3) (4) (5) (6)
Test range Actual score @ national percentiles % Correct
Praxis test Min Max 25th% Median 75th% @ 25th%
Agriculture (PA) 250 990 600 660 720 47.3%
Art content 100 200 161 173 183 61.0%
Art criticism 100 200 135 150 160 35.0%
Art education 250 990 570 620 680 43.2%
Art making 100 200 168 168 177 68.0%
Audiology 250 990 610 640 660 48.6%
Biology 250 990 610 690 780 48.6%
Bio/general science 250 990 600 650 700 47.3%
Bio/essay 100 200 141 151 159 41.0%
Bio knowledge 1 100 200 168 169 179 68.0%
Bio knowledge 2 100 200 135 148 160 35.0%
Bio knowledge (0235) 100 200 169 167 177 69.0%
Business 250 990 600 640 680 47.3%
CBT math 300 335 319 324 329 54.3%
CBT reading 300 335 324 328 331 68.6%
CBT writing 300 335 320 323 326 57.1%
Chemistry 250 900 490 560 630 36.9%
Chem/essay 100 200 145 160 165 45.0%
Chem knowledge (0245) 100 200 136 162 167 36.0%
Chem, phys, gen sci 250 990 530 580 650 37.8%
CB: Communications 600 695 654 661 668 56.8%
CB: Gen knowledge 600 695 650 657 664 52.6%
CB: Prof knowledge 600 695 655 663 670 57.9%
Communication (PA) 250 990 650 740 780 54.1%
Cooperative ed. 250 990 780 820 870 71.6%
Data processing 100 200 161 171 179 61.0%
Early child ed. 250 990 600 650 700 47.3%
Earth Sci knowledge 100 200 147 162 180 47.0%
Earth/space 250 990 550 630 700 40.5%
Ed in elementary 250 990 600 640 670 47.3%
Ed: Deaf/hard of hear 100 200 161 171 179 61.0%
Ed: Mental retardation 250 990 560 630 670 41.9%
Ed Leadership: Admini 250 990 620 880 730 50.0%
Elem ed: Content area 100 200 151 156 164 51.0%
Elem ed: Curricula, I 100 200 170 181 189 70.0%
Elem ed: Curricula, I 100 200 142 151 158 42.0%
Eng/knowledge 100 200 167 178 188 67.0%
English essays 100 200 155 160 170 55.0%
English literature 250 990 660 800 850 55.4%
Environmental ed 250 990 640 690 760 52.7%
Foreign lang. Ped. 100 200 163 173 181 63.0%
French 250 990 560 630 690 41.9%
French cont. know 100 200 169 183 192 69.0%
French cult. Analysis 100 200 161 178 188 61.0%
French (speaking) 100 200 170 182 193 70.0%
Gen science 250 990 560 650 730 41.9%
Gen sci/essay 100 200 135 145 160 35.0%
Gen sci (0435) 100 200 160 170 183 60.0%
German (listening) 250 990 530 620 690 37.8%
German knowledge 100 200 177 191 197 77.0%
Health/phys. Ed. 250 990 560 620 670 41.9%
Health ed. 250 990 650 710 760 54.1%
Home economics 250 990 610 660 700 48.6%
Intro.to Teaching Reading 250 990 620 670 700 50.0%
Italian 250 990 770 830 860 70.3%
Table 6 (continued)
(1) (2) (3) (3) (4) (5) (6)
Test range Actual score @ national percentiles % Correct
Praxis test Min Max 25th% Median 75th% @ 25th%
Latin 250 990 730 800 860 64.9%
Library media spec 250 990 630 670 710 51.4%
Marketing (PA) 100 200 165 173 180 65.0%
Marketing ed 250 990 650 710 760 54.1%
Mathematics 250 990 560 610 670 41.9%
Mathematics knowledge 100 200 121 139 153 21.0%
Mathematics 1 100 200 144 163 179 44.0%
Mathematics 2 100 200 131 144 162 31.0%
MSAT content 100 200 155 163 172 55.0%
MSAT area exercises 100 200 152 159 166 52.0%
Music education 250 990 570 620 680 43.2%
Music analysis 100 200 151 167 178 51.0%
Music concept proc. 100 200 140 155 165 40.0%
Music knowledge 100 200 155 165 174 55.0%
Office tech (PA) 100 200 158 166 171 58.0%
Physical education 250 990 590 630 670 45.9%
Physical ed: Content 100 200 147 154 161 47.0%
Phys ed: Movement ana 100 200 149 156 164 49.0%
Phys ed: Movement vid 100 200 155 165 175 55.0%
Physics 250 990 480 550 640 31.1%
Physics/essay 100 200 150 160 170 50.0%
Physics (0265) Conten 100 200 153 150 173 53.0%
Prin learn teach K-6 100 200 169 175 183 69.0%
Prin learn teach 5–9 100 200 166 175 183 66.0%
Prin learn teach 7–12 100 200 171 179 185 71.0%
Pre-prof math 150 190 173 179 184 57.5%
Pre-prof reading 150 190 175 179 182 62.5%
Pre-prof writing 150 190 173 175 178 57.5%
Reading specialist 250 990 570 620 660 43.2%
Safety/driver ed. 250 990 520 560 610 36.5%
School guidance 250 990 620 670 710 50.0%
School psychologists 250 990 650 700 750 54.1%
Secretarial (PA) 100 200 156 162 172 56.0%
Social studies 250 990 560 610 660 41.9%
Social studies/ essay 100 200 145 155 165 45.0%
Social studies knowledge 100 200 156 169 180 56.0%
Social studies interp 100 200 159 167 174 59.0%
Spanish 250 990 520 590 660 36.5%
Spanish content 100 200 163 176 189 63.0%
Spanish analysis 100 200 160 173 182 60.0%
Spanish speaking 100 200 163 178 193 63.0%
Special education 250 990 570 630 680 43.2%
Special education: App 100 200 147 156 181 47.0%
Special education: Know 100 200 155 162 174 55.0%
Spec ed: Mental retar 100 200 143 151 165 43.0%
Speech communic. 250 990 610 670 720 48.6%
Speech pathology 250 990 630 670 710 51.4%
Teach eng. as 2nd lan 250 990 620 710 780 50.0%
Teaching speech to L 250 990 610 690 740 48.6%
Teach—emotional 250 990 620 680 740 50.0%
Teach—visual 250 990 700 760 790 60.8%
Teaching learning disab. 250 990 610 670 730 48.6%
Technology educ. 250 990 620 670 700 50.0%
Vocational gen know. 250 990 580 680 750 44.6%
Table 7
Passing Praxis scores in selected states, as of February, 1998a
(1) (2) (3) (4) (5) (6) (7) (8) (9) (10) (11)
Praxis test 25th % correct @ AZ CA CT NY OH PA VA WI
percentile 25th percent
Agriculture (PA) 600 47.3% 470
Art content 161 61.0% 157
Art criticism 135 35.0% 160 130
Art education 570 43.2% 450 510 540 500
Art making 168 68.0% 171 148
Audiology 610 48.6% 490
Biology 610 48.6%
Bio/general science 600 47.3% 540 480 NA 580
Bio/essay 141 41.0% 157
Bio knowledge 1 168 68.0% 144
Bio knowledge 2 135 35.0% 135
Bio knowledge-0235 169 69.0% 152
Business 600 47.3% 550 620 540 NA 550
CBT math 319 54.3% 314 319 323 318
CBT reading 324 68.6% 316 324 309 326 322
CBT writing 320 57.1% 316 318 311 324 320
Chemistry 490 36.9% 430 500 NA
Chem/essay 145 45.0% 155 140
Chem know 0245 136 36.0% 151
Chem, phys, gen sci 530 37.8% 520 520 NA 560
CB:Communications 654 56.8% 650 646
CB: Gen knowledge 650 52.6% 649 642 644
CB: Prof knowledge 655 57.9% 642 646 642 643
Communication PA) 650 54.1% NA
Cooperative ed. 780 71.6% NA
Data processing 161 61.0% NA
Early child ed. 600 47.3% 480 530 490
Earth sci knowledge 147 47.0% 157
Earth/space 550 40.5% 570 NA
Ed in elementary 600 47.3% 500 510 570 520
Ed: Deaf/hard of hear 161 61.0% NA
Ed: Mental retard 560 41.9% 490 570 520
Ed leadership: Adm 620 50.0% 500
Elem Ed: Content Area ex. 151 51.0% 148
Elem ed: Curricula, instruct 170 70.0% 164
Elem ed: Curricula, instruct 142 42.0% 163
Eng/knowledge 167 67.0% 148 172 153
English essays 155 55.0% 160 160
English literature 660 55.4% 520
Environmental ed 640 52.7% NA
Foreign lang. Ped. 163 63.0% NA
French 560 41.9% 520 570
French cont. know 169 69.0% 165
French cult. Analysis 161 61.0% 490 171 520
French (speaking) 170 70.0% 172 163
Gen science 560 41.9% 149 370 NA
Gen sci/essay 135 35.0% 150 145
Gen sci (0435) 160 60.0% 157
German (listening) 530 37.8% 580 560
German knowledge 177 77.0% 162
Health/phys. Ed. 560 41.9% 520 480 500
Health ed. 650 54.1% 680 540 500 NA
Home economics 610 48.6% 520 630 NA 570
Intro.to Teaching Reading 620 50.0% 510 680 540
Italian 770 70.3% 670
Table 7 (continued)
(1) (2) (3) (4) (5) (6) (7) (8) (9) (10) (11)
Praxis test 25th % correct @ AZ CA CT NY OH PA VA WI
percentile 25th percent
Latin 730 64.9% 770
Library media spec 630 51.4% 540 520 NA
Marketing (PA) 165 65.0% NA
Marketing ed 650 54.1% 520 440 550 NA
Mathematics 560 41.9% 590 530 540 580
Mathematics: Know. 121 21.0% 136 141 127
Mathematics 1 144 44.0% 170
Mathematics 2 131 31.0% 159
MSAT content 155 55.0% 156
MSAT Area Exercises 152 52.0% 155
Music education 570 43.2% 510 600 560 510
Music analysis 151 51.0% 169
Music concept proc. 140 40.0% 165 150
Music knowledge 155 55.0% 153
Office tech (PA) 158 58.0% NA
Physical education 590 45.9% 540 540 560
Physical ed: Content 147 47.0% 154
Phys Ed: Move Analysis 149 49.0% 158 154
Phys ed: Movement video 155 55.0% 170
eval
Physics 480 31.1% 440 NA
Physics/essay 150 50.0% 160 135
Physics (0265) Content know 153 53.0% 141
Prin learn teach K-6 169 69.0% 164 162
Prin learn tch 5–9 166 66.0% 163
Prin learn tch 7–12 171 71.0% 167 159
Pre-prof math 173 57.5% 169 176 173
Pre-prof reading 175 62.5% 170 178 175
Pre-prof writing 173 57.5% 171 178 174
Reading specialist 570 43.2% 550 NA
Safety/driver ed. 520 36.5% NA
School guidance 620 50.0% 510
School psych 650 54.1% 350
Secretarial (PA) 156 56.0% NA
Social studies 560 41.9% 500 520 580 540
Social st/ essays 145 45.0% 160
Social st/know. 156 56.0% 134 162 157
Social studies interp 159 59.0% 169
Spanish 520 36.5% 470 520 540
Spanish content 163 63.0% 170
Spanish analysis 160 60.0% 171
Spanish speaking 163 63.0% 172 163
Special education 570 43.2% 510 590
Special ed applicati 147 47.0% 150
Special ed know 155 55.0% 155
Spec ed: mental Retardation 143 43.0%
Speech communic. 610 48.6% 550 470
Speech pathology 630 51.4% 570 500
Tch eng. as 2nd lng 620 50.0% 420
Teaching speech to lang. Im 610 48.6% NA
Teach—emotional 620 50.0% 510 570 NA
Teach—visual 700 60.8% 480 580 620
Teaching lear dis 610 48.6% 390 NA
Technology educ. 620 50.0% 550 640 NA 580
Voc. gen know 580 44.6% NA
March, 1998 for seven comparison states. Very few states set passing scores above the 25th percentile, con-sistent with the passing scores observed for NTE tests in Pennsylvania discussed earlier.
These low cut scores and high passing rates can also be compared to practices in other countries for public education, and to other professions in the US. Bishop (1996) reviews the evidence on teacher preparation stan-dards in the US vs. France and the Netherlands, and the performance of high school students on international achievement tests, and emphasizes the far more selective nature of teacher preparation programs overseas than in the US. In France, for example, only 31% who took the
Certificat d’Aptitude au Professorat de l’Enseignement du Secondaire passed it, while the more rigorous Aggre-gation Externe had a pass rate of 17.7% rate.
With regard to pass rates in other US professions, in accounting, 20,213 candidates sat the Spring, 1994, CPA examination; passing score standards are set by each state CPA society. Nationally, only 17.6% passed all of the various portions of the exam while 50.4% failed all portions of the examination. In Pennsylvania, 5.2% passed all portions of the 1994 examination, and 62% failed all portions. Overall, 32.0% nationally and 32% in Pennsylvania passed some portion of the overall CPA examination.17
In law, 69.8% of those who took a state bar exam passed it throughout the US in the Winter of 1995; in Pennsylvania the comparable passing rate was 48%.18By
contrast, the passing rates in Pennsylvania and most other states on teacher certification tests is 95% or high-er.
2.6. Example of Pennsylvania program approval standard: mathematics program
Pennsylvania Department of Education regulations governing approved programs of instruction are both quite voluminous and quite vague. As an example, con-sider those governing the approval of mathematics prep-aration. They are quoted in their entirety below to acquaint the reader with the nature of the state stan-dards:19
Standard I
The program shall require studies of the mathematical concepts and logic in statistics and probability, algebraic structures, geometry, linear algebra,
calcu-17 Source: National Association of Schools of Business Administration, 1994.
18 BAR/BRI Group (1998).
19 These mathematics standards are found at Pennsylvania Department of Education (1985), p. 50.
lus, trigonometry, number theory, and finite math-ematics.
Standard II
The program shall require studies of the historical and cultural significance of mathematics.
Standard III
The program shall require studies of and experiences in the development and application of mathematical models in other disciplines such as physics, biology, sociology, psychology, and economics.
Standard IV
The program shall require studies of and experiences in the use of the computer, fundamental program-ming, and educational software development and use.
Standard V
The program shall require studies of the mathematical content included in secondary, junior high school, and middle school curricula.
Standard VI
The program shall require studies of and experience in adapting mathematical instruction to the needs and abilities of each student including the needs of the exceptional student.
Standard VII
The program shall require professional studies distrib-uted over the areas defined in General Standard XIV. The student teaching experience should require the candidate to demonstrate competency in these areas.
No minimum number of courses in algebra, calculus, matrix algebra, etc. are stipulated, nor are the particular topics within any of the areas of mathematics defined. In an area as well defined as computer programming, the student is not required to take one of several popular languages such as Pascal or C++, but merely to have been involved in studies and experiences in the use of the computer.
2.7. Comparison with other states
Many (40) states require that the college education earned in conjunction with earning a teaching certificate be from a regionally accredited institution; Pennsylvania does not. Of Pennsylvania’s 90+ teacher preparation institutions, 16 are NCATE accredited. Remarkably, in Pennsylvania, there is a negative, highly significant stat-istical relationship between a district’s high school stu-dents going on to post-secondary education and the dis-trict employing greater proportions of NCATE accredited teachers (20.38).20
Pennsylvania’s certification requirements are silent with regard to whether or not the prospective teacher
must have a major in professional education. The pro-gram of preparation must be approved by PDE; 14 states require the prospective teacher’s degree be an education major while 11 others prohibit21 the college major be
in professional education. This second group of states includes California, Connecticut, Maine, Massachusetts, New Jersey, New York, Tennessee and Utah.
NASDTEC reports that Pennsylvania’s program approval standards have the effect of requiring that pro-spective teachers take general education courses in humanities, fine arts, social science, history, and natural science. Thus, general studies in English and mathemat-ics are not required in Pennsylvania, in contrast to vir-tually all of the other 37 states that have some sort of general education requirements.22
At the turn of the century, all but nine states issued life teaching certificates.23 By 1996, however, only six
states, including New Jersey, New York, and Pennsyl-vania, continued to issue permanent or life certificates.24
3. Teacher quality and teacher selectivity in Pennsylvania
Questions naturally arise about whether or not teacher quality, as measured by content knowledge performance on standardized examinations, matters vis a` vis student achievement of a teacher’s students. Also, questions nat-urally arise about how much variation there is in teacher test scores in Pennsylvania, and how selective school dis-tricts have been when hiring teachers since teacher test-ing began.
3.1. Teacher quality and student achievement
There is a small academic literature on the effect of teacher quality and substantive preparation on student performance in the US.25In an examination of the
stat-istical relationship between NTE scores and student competency and student achievement in North Carolina, Strauss & Sawyer (1986) found very strong evidence of a very sizable linkage between core battery NTE tests and 11th grade reading and math competency and achievement scores.26 In that study, a 1% relative
increase in average core battery scores at the district level was associated with a 3% relative decline in the
21 See NASDTEC (1996), Table B-4. 22 NASDTEC (1996), Table B-4.
23 Connecticut, Delaware, Louisiana, Massachusetts, Oklah-oma, New Mexico, South Carolina, Vermont and West Vir-ginia.
24 NASDTEC (1996), Table E-1.
25 See Boardman, Davis & Sanday (1977), Ehrenberg & Brewer (1994, 1995) and Ehrenberg & Brewer (1995).
26 See Strauss & Sawyer (1986).
fraction of students who fell below grade level in reading and math; this result was after controlling for ethnicity, student teacher ratio, college going plans, and per capita income of the school district.
Ferguson (1991) found a similar relationship, although not as large, between measures of teacher quality and student achievement in Texas, and Ferguson & Ladd (1996) found similar relationships in Alabama.
Monk & King (1995) examined the effects of teacher preparation, as measured by the extent of a teacher or group of teachers’ substantive training, in turn measured by his/her college credits in the substantive area of accreditation, on their immediate and previous students’ achievement. Importantly, Monk & King (1995) found that one more semester of teacher’s preparation in math-ematics translates into a 1.5% improvement in student performance. The score gains of low-pretest students in math were more sensitive to the level of teacher prep-aration than were high-pretest students. Also, high-pre-test students in math were more adversely affected by variability in preparation than were low-pretest students.
3.2. Content knowledge levels of secondary teachers trained by institution in Pennsylvania
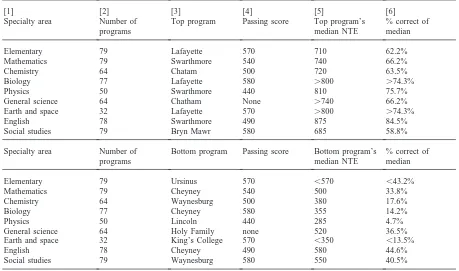
Table 8 summarizes the range of NTE scores for elementary education and eight secondary specialty areas. For each test, test scores across time were grouped by teacher preparation institution which the student indi-cated to ETS at the time of the exam, and the median of the test score distribution determined. Table 8 displays the minimum passing score, the lowest median test score and institution, and the highest median test score by institution, along with the number of institutions for whom NTE test scores exist.27Table 8 also displays the
percent of questions of average difficulty correctly answ-ered which are implied by the median score.
The range of test scores between lowest and highest institutions is quite large, and in several instances the median score is below the minimum passing score. The range of correctly answered questions of average dif-ficulty varies from as low as 14% in Biology to as high as 84% in English. If one subtracts the lowest from the highest median score for each specialty test, one finds the largest range in Biology: the lowest median score was 355 and the highest median was 810 or a difference of 455 points.
Elite, expensive liberal arts schools dominate the list
Table 8
Teacher test scores in Pennsylvania by college or university median national teacher exam scores (1987–97) in 9 specialty areasa
[1] [2] [3] [4] [5] [6]
Specialty area Number of Top program Passing score Top program’s % correct of
programs median NTE median
Elementary 79 Lafayette 570 710 62.2%
Mathematics 79 Swarthmore 540 740 66.2%
Chemistry 64 Chatam 500 720 63.5%
Biology 77 Lafayette 580 .800 .74.3%
Physics 50 Swarthmore 440 810 75.7%
General science 64 Chatham None .740 66.2%
Earth and space 32 Lafayette 570 .800 .74.3%
English 78 Swarthmore 490 875 84.5%
Social studies 79 Bryn Mawr 580 685 58.8%
Specialty area Number of Bottom program Passing score Bottom program’s % correct of
programs median NTE median
Elementary 79 Ursinus 570 ,570 ,43.2%
Mathematics 79 Cheyney 540 500 33.8%
Chemistry 64 Waynesburg 500 380 17.6%
Biology 77 Cheyney 580 355 14.2%
Physics 50 Lincoln 440 285 4.7%
General science 64 Holy Family none 520 36.5%
Earth and space 32 King’s College 570 ,350 ,13.5%
English 78 Cheyney 490 580 44.6%
Social studies 79 Waynesburg 580 550 40.5%
a Source: Authors’ tabulations of NTE scores and Professional Personnel and Certification files in Pennsylvania.
of high performing teacher preparation institutions; their high scores undoubtedly reflect their high admissions requirements and the quality of their own programs.
3.3. Selectivity of local teacher hires: 1987–96
Given the range in content knowledge of teachers trained in Pennsylvania teacher preparation institutions, a question arises about the final result of the hiring pro-cess. Do Pennsylvania school districts sift through the vast number of teachers offering themselves to the labor market each year? Several sorts of information are avail-able to answer this question.
First, one can look at where teachers were prepared and where they were hired to ascertain if the teacher markets are local, regional, statewide or national in character. Second, one can also look at the test scores of teachers hired in relation to the distribution of test scores to see how selective, in terms of content knowl-edge, school districts have been. Also, as reported below in Section 4, we directly asked school districts about the nature of their employment procedures and experience.
With regard to the geography of hiring practices, it appears, based on 1993 analysis, that most districts hire from local institutions. An exhaustive analysis of new
hires28indicates that 60% of newly hired teachers come
from institutions no more than 70 miles away from the hiring school district. For Allentown, Erie, Lancaster, Pittsburgh, and Sharon metropolitan school districts, 90% of the teachers come from 70 miles or less, while districts in the Philadelphia, Johnstown, Reading and Williamsport metropolitan areas hired 80% of their tea-chers from within 70 miles.
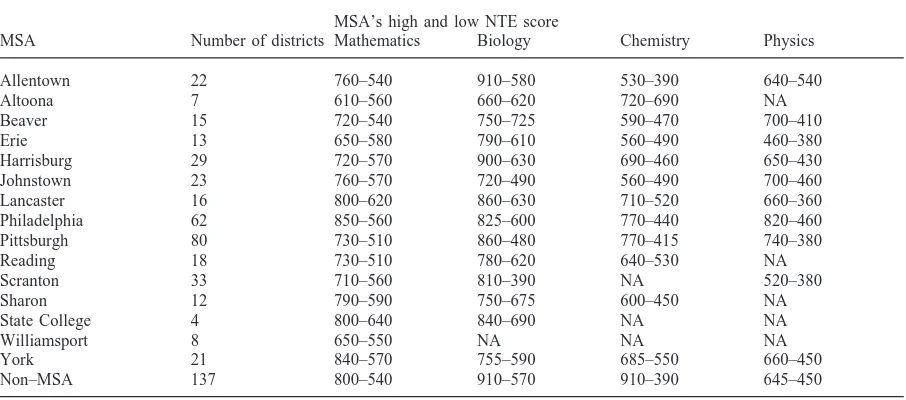
With regard to the actual selectivity of district hiring practices, Table 9 displays by MSA the highest and low-est median NTE specialty tlow-est of school districts in the MSA. For example, in the Allentown MSA, the school district with the highest median NTE mathematics score had hired teachers whose median NTE mathematics score was 760, while another district in the same MSA with the lowest median NTE mathematics score had hired teachers whose median mathematics score was 540, or a difference of 220 points or 40%.
As noted earlier, Pennsylvania did not implement minimum Chemistry and Physics test scores until this year. It is evident by examining the lower range of Chemistry and Physics that in some parts of the state,
Table 9
Employed classroom teacher content knowledge: Highest and lowest district median NTE scores by Pennsylvania metropolitan areaa MSA’s high and low NTE score
MSA Number of districts Mathematics Biology Chemistry Physics
Allentown 22 760–540 910–580 530–390 640–540
Altoona 7 610–560 660–620 720–690 NA
Beaver 15 720–540 750–725 590–470 700–410
Erie 13 650–580 790–610 560–490 460–380
Harrisburg 29 720–570 900–630 690–460 650–430
Johnstown 23 760–570 720–490 560–490 700–460
Lancaster 16 800–620 860–630 710–520 660–360
Philadelphia 62 850–560 825–600 770–440 820–460
Pittsburgh 80 730–510 860–480 770–415 740–380
Reading 18 730–510 780–620 640–530 NA
Scranton 33 710–560 810–390 NA 520–380
Sharon 12 790–590 750–675 600–450 NA
State College 4 800–640 840–690 NA NA
Williamsport 8 650–550 NA NA NA
York 21 840–570 755–590 685–550 660–450
Non–MSA 137 800–540 910–570 910–390 645–450
a Source: Authors’ analysis of Pennsylvania Professional Personnel files and NTE test scores. the lower bound on content knowledge of employed
chemistry and physics teachers was extremely low. In Allentown, the district with the lowest NTE Chemistry score had a median NTE Chemistry score of 390 which translates into having correctly answered only 19.9% of the questions of average difficulty. The lower bound on physics test scores in Erie was 380, which translates into correctly answering only 17.6% questions of average dif-ficulty. In all likelihood these science teachers are now tenured. Such low content knowledge scores not only raise questions about the content knowledge of the teach-ers, but also the ultimate value of professional develop-ment investdevelop-ments. It also raises questions about the man-ner in which districts recruited these teachers, and perhaps why there is growing pressure to provide alter-natives to traditional certification programs.
4. Employment procedures and practices in Pennsylvania
4.1. Major features of 1997 teacher employment survey
In conjunction with the analysis of historical, adminis-trative records of the Pennsylvania Department of Edu-cation, a survey eliciting the characteristics of classroom teacher recruitment and hiring procedures and experience was devised and administered in 1997 to all 501 school districts in Pennsylvania. Three stakeholders were sur-veyed with the identical survey instrument: School Superintendents, School Board Presidents, and Teacher Union Presidents.
In 1997, school superintendents reported the following about their hiring procedures and practices:
1. only 49% of the districts have written hiring policies; 2. only 25% of the districts advertise outside of Pennsyl-vania for openings; about 83% advertise outside their district; the major forms of local advertising are: Pennsylvania School Boards Association Bulletin, word of mouth, bulletin boards in the district, edu-cation schools placement offices and the local news-paper;
3. about 40% of the current teachers in the district obtained their high school diploma or attended high school in the district where they work;
4. about 1/3 of the districts fill full-time openings from substitutes or part-time teachers whom they already know; 14% of full time positions filled are from internal transfers within the district;
5. 26% of the districts reported requesting waivers from the Department of Education and 65% (of those requesting) obtained a waiver; 27% stated that a waiver was requested because applicants were not fully qualified;
6. districts generally experienced better than 5 appli-cations to each vacancy, and on average 50 elemen-tary applications for each opening;
7. only 20% of the districts reported that salary was a limiting factor in their obtaining their most desired teacher recruits;
8. 90% of the districts reported that some certification areas were easy to recruit in (elementary was men-tioned by 74% of the districts);
areas were difficult to recruit (14% mentioned phys-ics, 17% mentioned foreign language);
10.80% of the districts require more than the basic, state-mandated application form put in place in the Fall, 1996; written recommendations, transcripts and a copy of the certification were requested 65–70% of the time, if anything beyond the state form was requested;
11.in about 1/3 of the districts, a non-interviewer plays a role in the hiring process;
12.the most influential factors used to narrow the paper applicant pool for subsequent interviewing are: major in area of teaching, overall grade point average and grade point average in major, past performance in teaching, and reference or recommendations; 13.independent evidence on content knowledge and
cal-iber of certificating institution were about as important as indications of community involvement, willingness to assist in extracurricular activities, and non-teaching work experience;
14.44% of the districts use more than one interview team to interview applicants;
15.first and second interviews average about 40–45 minutes;
16.94% of the districts report the building principal is present in the first interview, 34% report other teach-ers, and 11% report school board member(s) were present;
17.27% of the districts report using a sample classroom presentation as part of the initial evaluation process while 36% require a sample classroom presentation if a second interview is required;
18.the school superintendent and building principal determine in 2/3 of the districts who moves from the interview list to the narrowed applicant pool; 21% of the districts report the school board members partici-pate in this narrowing process; only 12% report other teachers are involved in the narrowing process and 17% report that the department head participates in the narrowing process.
19.in the case of late hires, 1/3 of the positions offered were for full time, contract positions; current substi-tutes are first offered such positions in 28% of the cases; 83% of the districts do not use a separate per-sonnel process for late hires;
These initial results suggest, consistent with Ballou (1996) and Ballou & Podgursky (1997), that insufficient emphasis is placed on content knowledge other than what is reflected in grade point averages (but not college of preparation). Performance on test scores is weighted, on average, as heavily as willingness to engage in extra-curricular activities.
It also is clear that most districts do not actively seek new teacher applications through vigorous advertising and recruiting. The result is that a high proportion of
hired teachers are simply those the district knows best, their own graduates. This finding is also consistent with a nepotism model of the hiring process for which there is anecdotal evidence; some added to our survey responses by frustrated school administrators.
4.2. Student achievement and aspects of the employment process
A question naturally arises about whether the structure and nature of the classroom teacher employment process is associated with different levels of student achieve-ment. On the one hand, common sense suggests that the more careful districts are in selecting teachers, and the more attention paid to the academic background and achievement of teachers in the selection and employment process, the more likely it is that the district’s own stu-dents will perform better on competency and achieve-ment tests. What we find is consistent with common sense: districts which are more professional in their hir-ing process are also districts in which students demon-strate greater interest in further education, and achieve higher test scores.
Two kinds of statistical evidence are provided below: bivariate correlations and an exploratory structural model.
4.2.1. Correlations
We present below some correlation analysis which substantiates this common sense conjecture. Two kinds of output measures are examined below: district level, weighted reading and math achievement scores on the 1995/6 Pennsylvania System of Student Assessment (PSSA), and the fraction of high school seniors with post-secondary plans (PostSec). Generally, districts which have more professional personnel procedures and stress academics tend also to have students who go on to post-secondary education, and score higher on various achievement tests.