Abstract—The construction of prototype G2A is presented here, i.e. a
combination of Modified GSTAR (Generalized Space Time Autoregressive) and GIS (Geographical Information System) designed for agriculture data analysis. The studied cases are obtained from a regency of Boyolali, a regency in Central Java. Particularly, Teras, Sawit and Banyudono are the 3 studied sub districts in this paper. The Modified GSTAR is used to design objective functions illustrating paddy harvested on each sub district. The solver and the function in MATLAB are used to have optimal solutions and compared with Ant Colony algorithm (ACO) individually programmed. The convergence of ACO is studied by varying the physical parameters in the algorithm. Based on the research, this variation does not give generalization of convergence. However 3 algorithms used here have nearly the same results of optimization, i.e. paddy harvested from each sub district.
Keywords—Generalized Space Time Autoregressive (GSTAR), Geographical Information System (GIS), Ant Colony Algorithm (ACO.)
I. INTRODUCTION
HE analysis of optimal paddy fields has been studied by considering the amount of rainfalls and the area of critical region in regency of Boyolali, Central Java Indonesia. There were 3 sub districts (Selo, Ampel and Cepogo) as studied sub districts models of objective functions derived by Modified GSTAR [1]. The modification arises due to the present of the auto regression variables at the same time t (GSTAR standard uses auto regression variable at the previous time).
Since the absence of critical regions may create singularity in the matrices for computing parameters in the Modified GSTAR, the critical region is then omitted to the next research. One reasonable variable to replace is the harvested area. All the mentioned works above have been done with MATLAB 6.5, MINITAB for testing stationary properties as necessary conditions in classical GSTAR.
Unfortunately, MATLAB and MINITAB are not known for official staffs in villages of developing countries such as Indonesia. Additionally, the computational programs will be used for administration staff in a small district of a village for studying the Modified GSTAR and making decision for future planning, The programs are then defined by excel since excel is considerable easy to apply. The computations are based on the triple of nearest sub districts. Since the computation is done related to a location, Geographical Information System is applied here. Combining of the two models (GIS and Modified GSTAR) are then called as G2A. The software is called G2A and its construction is discussed here .
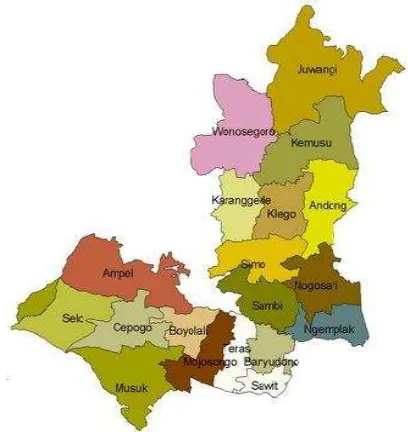
Fig. 1 Map of Boyolali Regency (created by personal software)
II.PROTOTYPE OF G2A A.Geographical Information System
Map of Boyolali is necessary to define triple nearest sub districts in the model of Modified GSTAR. In other words, there are necessary 3 regions to run the model Modified GSTAR. In the first step, the triples are designed manually by considering the given map as shown in Fig. 1.
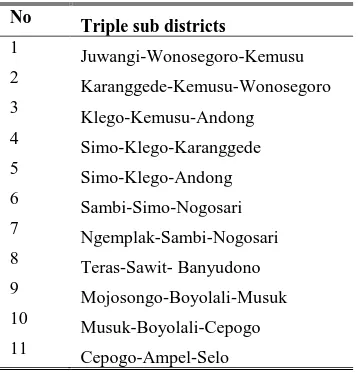
The triples of sub districts are set up by choosing 3 sub districts that are close each other. Note that the method of GSTAR requires at least 3 locations to design the linear system for regression. Up to know, there exists no algorithm for more than 3 locations for a GSTAR model. According to the map in Fig.1, we have triples locations as listed in Table I. The triples are not unique, one may design differently as long as the 3 locations are connected geographically.
These triple sub districts will be considered to be triple sub districts for deriving GSTAR models. The models are then optimized due to productivity of paddy fields of each sub-district. The models will be tested by considering p-value of each coefficient regression. Before the optimization is done,
Prototype G2A
as a Low Technology for Adminstrators
of Agriculture in villages
Hanna Arini Parhusip
1, Ramos Somnya
2the data are also checked the stationary conditions as required conditions for the GSTAR models.
TABLE I. TRIPLE SUB DISTRICTS FOR G2A
No
Triple sub districts
1
Juwangi-Wonosegoro-Kemusu 2 Karanggede-Kemusu-Wonosegoro
3
Klego-Kemusu-Andong 4
Simo-Klego-Karanggede 5 Simo-Klego-Andong
6
Sambi-Simo-Nogosari 7 Ngemplak-Sambi-Nogosari
8
Teras-Sawit- Banyudono 9 Mojosongo-Boyolali-Musuk
10
Musuk-Boyolali-Cepogo 11 Cepogo-Ampel-Selo
B.Modified GSTAR for constructing objective functions with Excel
Modified GSTAR here means that GSTAR standard is modified with some non autoregressive variables. This idea was tested for modeling of paddy harvested in some sub districts in Boyolali depending on paddy harvested from the previous time on the same place and the area of neighboring critical regions and the amount of rainfalls at the same time when paddy were harvested [1]. Corn produced by all sub districts in Boyolali regency were also studied based the uniform weight coefficients as proposed in the GSTAR standard [2]. Therefore the last model here will be employed into detail for introducing prototype G2A.
The symbols are introduced here to design the model, i.e.
: ) (t
Zk the amount of paddy harvested from k-th location, k=1,2,3 at time t ;
1): (t
Zk the amount of paddy harvested from k-th location, k=1,2,3 at time t-1;
: ) (t
Yk the harvested area from k-th location, k=1,2,3 at time t;
: ) (t
Rk the amount of rainfalls from k-th location, k=1,2,3 at time t;
Each k-th sub-district for k=1,2,3, the modified GSTAR reads as
() ()
() ) 1 ( )( 10 1 11 111 12 1 1
1 t Z t wY t w R t e t
Z ; (1.a)
() ()
()) 1 ( )
( 20 2 21 21 2 23 2 2
2 t Z t w Y t w R t e t
Z ; (1.b)
Z3(t)30Z3(t1)31
w31Y3(t)w32R3(t)
e3(t). (1.c) Note that wij0.5. This weight is chosen for standard weighted coefficients since the stationary conditions (stationary in variance and the mean) are satisfied by the model (1.a)-(1.c) for all data without any stationary processsuch as differencing and Box-Cox transformation as in GSTAR standard [3,4]. The stationary conditions have been justified for all data used here in separate work for simplifying the presentation of this paper. Hence the only coefficients must be estimated are symbolized here, i.e.
T31 21 11 30 20
10
. (2)III. PROCEDURES IN G2A A.Data Preparation
Each variable contains different size of data, i.e. the amount of paddy harvested each year in 2008-2013, the harvested area of each year in 2008-2013, and the amount of rainfalls recorded each month in 2008-2013. Additionally, the number of data is not enough to present the analysis. Therefore one needs to generate new data randomly that behave the same profile with original data. Here, we choose the number of data is 100 for each variable and each location. One way to have new data is generating random data containing the minimum and the maximum of original data.
Furthermore, dimension of data must be removed by relevant transformation. In this paper, all data have been transformed. Some transformations have been studied for all data, such as normalization data, dividing data by each maximum, and logarithm of each variable and doing some stationary procedures. After these kinds of observations, the most reasonable result is using transformation by dividing the variable by its average which is employed here, .i.e. the approximation and the data are close enough (small error functions).
B.Excel for Modified GSTAR
The acceptable software for agricultures administrators in villages is Excel, unlike the first research, MATLAB and MINITAB were employed [3]. The program in G2A uses Data Analysis Tool and Regression menu. Note that the constant is set to be zero due to the model (1.a)-(1.c). The models given in (1.a)-(1.c) are the objective function for each sub district. These models must be optimized subject to the derived constraints. The constraints are taken by the lower bound and upper bound of each data for each sub district.
After the model is designed, the coefficients must be tested. The coefficients are statistically significant (p-value < 0.05) and hence the models can be used as objective functions for further process of optimization. Equation (1.a)-(1.c) have been proven mostly lead reasonable coefficients, i.e. p-value is less than 0.05 for almost all studied data. Additionally, all studied data have been checked to be stationary in means and variance (checked by MINITAB). Other modifications of GSTAR have also good results [1,2]. We choose the model given by (1.a)-(1.c) since its simplicity (only containing 3 variables, including 1 autoregressive variable).
results are read by GIS to present the final result into the corresponding locations. Additionally, all the works are written in Indonesian since it’s used for local agriculture administrators in villages mainly.
Step. 1 Data have been written in Excel containing 6 years of production fields and 6 harvested area and 12 (months) x 6 years of rainfalls for each location. The data are shown in Fig 2.
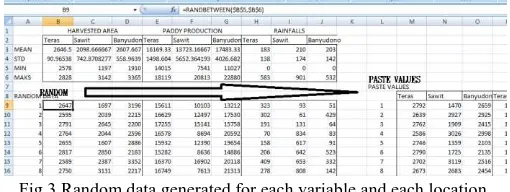
Fig. 2 Data collected for each triple in one sheet 1st sheet Step. 2 In the second sheet, the average, the maximum and minimum of each variable for each location are computed. Based on these data, one generates the random data. Data are generated randomly for each variable and each location with the same number of data (n=100). The random values are taken between the maximum and the minimum for each variable in Excel. Put in a different sheet (RANDOM’s sheet to be the second sheet) which is illustrated in Fig. 3. Note that the random values always unfixed, hence one needs to copy to get the fixed values.
Fig.3 Random data generated for each variable and each location.
Step. 3 Data are transformed into non dimensional by dividing each variable with each average. This is done by referring the sheet containing averages , minimum and maximum values of all variables for each triple locations and put into 3-rd sheet. Step. 4 Design the known matrix and vector based on (1.a)-(1.c) written in 4-th sheet for computing the coefficients of GSTAR On the same sheet, one may compute the coefficients presented by (2) using menu Data Analysis in Excel and Regression, non-activate the zero coefficient due to the model (1.a)-(1.c) (there exists no constants of coefficients). The illustration is shown in Fig. 4.
Fig. 4 Computation of coefficients GSTAR using Data Analysis menu in Excel.
Step. 5 Finally, the coefficients are recorded in the new sheet (5-th) to design the objectives functions for optimization, i.e. maximize the paddy production. Each location is computed individually, by using Solver menu from Excel. Thus this menu must also be installed. Additionally, user must also know how to use Solver previously.
Step. 6 The results of optimization are transformed into dimensional and compared with the original data.
Step. 7 The table in the last step mentioned on step 6 is recalled in GIS software to display the result of optimization related to each location. The result will be compared to optimization done by fmincon.m in MATLAB and solver in Excel separately for doing the analysis.
C.Advancing Optimization trust region and Ant Colony Algorithm (ACO) algorithms
For doing higher analysis scientifically, the analysis will be based on some other algorithms used for comparison. The standard available algorithms are trust region provided by fmincon.m function in MATLAB and Ant Colony Algorithms (ACO) provided by individual programming done in MATLAB. The function fmincon.m is used for minimization problem, hence one has to multiply by negative sign for the optimized objective function. Though the objective functions are simple since only linear, the development of research in dealing with different algorithms is also interesting for future work. The two algorithms (trust region and ACO) are not presented into detail since the interest of this paper is the construction of prototype G2A and the use for agriculture data. One may refer to [5] to get general idea of ACO algorithm and simple applications of ACO in optimization with a logistic function as the objective function and for searching best period of planting paddy [6]. Trust region is a standard algorithm in MATLAB so that one need not write the two algorithms above here. Some applications for undergraduate researches are presented based on local data [7] using this algorithm. In nonlinear cases, one needs to rely on least square method for searching the best parameters [9,10]. In regression, ACO has ever been implemented [11] to find best grid , and for logistic function to find the best quality wine assessment [12].
for the proportion between the maximum value of the objective function and the minimum value
on each iteration. In this paper, we choose
0.5 with
=2 initially based on literature [9] and vary the value of these parameters for searching the convergence of ACO due to the given data.IV. RESULT AND DISCUSSION
A.Introducing Prototype G2A to agriculture administrators in village of Asinan
The prototype has been introduced to the smallest agriculture office in a village called Asinan, in Central Java province of Indonesia. Though excel is already known, this software is not used for doing data analysis. The software is only used for tabling information. Thus the basic knowledge in statistical analysis must be delivered firstly before the prototype G2A is trained to the participants. Two of photographs of this activity are shown in Fig. 5-6. Undergraduate students were mentoring to use the software G2A, i.e. learning the designed program.
Fig. 5 Photo of collaborative learning of Prototype G2A with agriculture staffs in the Village of Asinan, 2-nd –March 2015, excel
training.
Fig. 6 Photo of collaborative learning of Prototype G2A with agriculture staffs in the Village of Asinan, 2-nd –March 2015,
continue excel training for G2A preparation.
B.Optimization procedures in G2A
The model of G2A is defined by Modified GSTAR meaning the model is a linear model for each location subject to the constraints. There are 3 sub districts as studied cases, i.e. Teras, Sawit and Banyudono, These locations are chosen to be the studied case since this triple gives the best coefficient (less error function with least not significant coefficients in the objective functions.
The statistical test and the estimated parameters are shown in Table II. As shown in Table II, the value of t* is less than t-table=1.9 for coefficient value of
1 1 indicating this parameter is not significant under α = 0.05. Since only one variable is not significant, we try to continue to use the function. After the coefficients are estimated, the optimization process can be treated.TABLEII.PARAMETERVALUESOBTAINEDBYG2AFORDISTRICT TERAS,SAWIT DAN BANYUDONO , T-TABLE=1.9;THEESTIMATED
PARAMETERSAREINTHISORDER:
T31 21 11 30 20
10
Estimated
Par t* p-value
Conclusion (α = 0,05)
0,9119957 12,18621 7,04E-28 Sig
0,2817659 6,924811 2,8E-11 Sig
0,6944451
11,3538
5,62E-25 SIg
0,084256
0,84610
0,398189 Not-sig
0,6654357
10,3263
1,67E-21 Sig
0,2794936
4,58797
6,66E-06 Sig
After employing the Modified GSTAR, the objective functions and the constraints are shown by Table III. By following the procedures for working with Solver in excel, the problems in Table III are solved, i.e. find the maximum of each location. Note that the computation is done in dimensionless case, hence one needs to scale back again into dimensional by using the first transformation, i.e. multiply the optimal solution by the average of each original data of paddy harvested from each location. The optimization result for 3 locations above are shown in Table IV (dimensionless) and Table V (dimensional case) using solver in Excel, fmincon.m from MATLAB and ACO (individual programming).
Other optimization of triple locations as listed in Table I are also possible to be computed. Since our interest is the output of G2A, the outputs of ACO are omitted in this paper as shown in Table VI, except other triples.
Not all coefficients of GSTAR are significant (p-value < 0.05) as shown in Table VI. Only 2 triples with 1 non significant coefficient, i.e. Teras-Sawit-Banyudono and Musuk-Boyolali and Mojosongo. Therefore the presentation here is focus on one of these triples, and we choose Teras-Sawit and Banyudono.
TABLEIII. OBJECTIVEFUNCTIONSDEFINEDBYG2A DONEBY EXCELANDTHERELATEDCONSTRAINTS
Teras : Z1 =0,9120X1+0,04213Y1+0,04213R1 0,8604≤ X1≤1,1005
0,9554 ≤ Y1≤1,0473 0,0302≤ R1≤1,9268
Sawit : Z2 = 0,2818X2+0,3327Y2+0,3327R2 0,52378≤ X2≤1,4358
0,0023≤ R2≤2,0415
Banyudono Z3 =0,6944X3+0,1397Y3+0,1397R3 0,5237≤ X3≤1,4358
0,7210≤ Y3≤1,2510 0,0082≤ R3≤2,1833
TABLEIV.RESULT ON OPTIMIZATION BY SOLVER, FMINCON AND ACO (DIMENSIONLESS)
Location Dimensionless
SOLVER FMINCON ACO Teras 1.1458 1.3634 1.1659 Sawit 1.4874 1.4003 1.5037 Banyudono 1.529 1.3679 1.5192
TABLEV.RESULT ON OPTIMIZATION BY SOLVER, FMINCON AND ACO (DIMENSIONAL)
Location Dimensional (ton) SOLVER FMINCON ACO
Teras 18790 18255 18068
Sawit 21438 21371 20942
Banyudono 25594 25823 25391
C. Analysis and Performance result on Optimization There are 3 algorithms used for running the optimization problems i.e. Solver in Excel, trust region presented by function fmincon.m in MATLAB and ACO as individual programming with MATLAB. The results are shown in Table IV-V for only 3 sub districts, i.e. Teras, Sawit, Banyudono. Based on the results in Table V, the research here suggests that about 15 tons may be harvested additionally for each year on each location.
Table VI describes the optimal paddy harvested from each location by each algorithm for 6 years due to the amount of rainfalls and the area of each sub districts.
Finally the result of optimization is presented according to its location. Using the GIS in prototype G2A, one may call GSTAR in excel and connect the result with each location as shown in Fig.7 This makes a user to read the computation easily without knowing the mathematical background. Note that the computer must be connected with an internet. This is also sometimes not always possible in a village. Thus, the program will be designed by recording the required location such that one need not use an internet to visualize the optimization result relating its location.
The study is improved for academic purpose by employing ACO for further analysis though this part is not included directly in the prototype G2A .
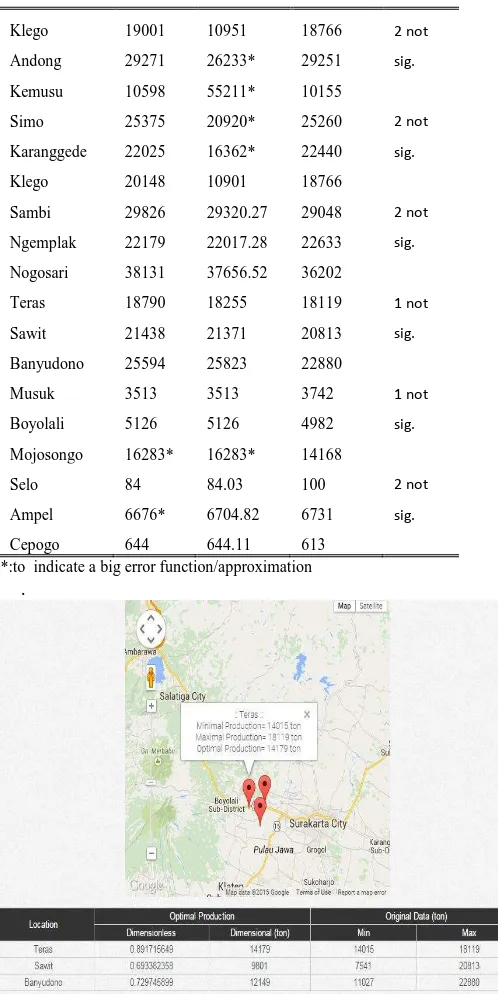
TABLEVI.RESULT ON OPTIMIZATION BY SOLVER, FMINCON (DIMENSIONAL)
Optimal Paddy Sig.
Dimensional (ton) Coeff.
Location Solver fmincon
Max
data
Kemusu 10452 10382 10155 2 not
Wonosegoro 22228 23657 22609 sig.
Juwangi 7387 7610.2* 7415
Klego 19001 10951 18766 2 not
Andong 29271 26233* 29251 sig.
Kemusu 10598 55211* 10155
Simo 25375 20920* 25260 2 not
Karanggede 22025 16362* 22440 sig.
Klego 20148 10901 18766
Sambi 29826 29320.27 29048 2 not
Ngemplak 22179 22017.28 22633 sig.
Nogosari 38131 37656.52 36202
Teras 18790 18255 18119 1 not
Sawit 21438 21371 20813 sig.
Banyudono 25594 25823 22880
Musuk 3513 3513 3742 1 not
Boyolali 5126 5126 4982 sig.
Mojosongo 16283* 16283* 14168
Selo 84 84.03 100 2 not
Ampel 6676* 6704.82 6731 sig.
Cepogo 644 644.11 613
*:to indicate a big error function/approximation .
Fig. 7 The final output of G2A for Teras, Sawit and Banyudono obtained by Google map. By clicking each bullet one may have the information given by optimization (optimal paddy harvested from the
solver algorithm) (given in Table V).
C.ACO result analysis
There are two parameters in ACO, i.e. parameters due to rate of evaporation of pheromone (
) and due to proportion between the best value of objective function and the worst value of objective function of each iteration (
). Due to literature [8] ,the parameter
in the algorithm works well forparameters above are varied to study the behavior of solutions by measuring the values of r.
Case 1:
0.5.The rate of evaporation of pheromone is assumed to be
0.5 with
=2. The study is shown by measuring the value of r for 3 sub districts simultaneously. The smallest values of r for Teras, Sawit and Banyudono are 0. 3126% , 0.4193% and 0.2212% respectively. The biggest values of r are 8.6293%, 29.6215% 12.7175% for Teras, Sawit and Banyudono respectively. By fixing the value of
, we can not have any conclusion for convergence of ACO.Case 2: The value of
0.1 varies up to
0.9The study is continued by varying
0.1-0.9 to observe the behavior of percentage differences between data and approximation given by ACO. The observation is depicted in the Figure 8 for district of Teras. The result shows that though the value of
varies, the values of r vary from 0.3126% up to 8.6293%. The highest one is given for
0
.
5
.Similarly, the observations are done for both locations,i.e. Sawit and Banyudono. Figure 9 and Figure 10 show these observation.Fig.8 Relation between value of
(horizontal :9 . 0 1 .
0 ) and r (vertical) for sub district of Teras. On
=0.5, r=8.6293% ; as the biggest; On
=0.4 , r=0.3126% as the smallest.Fig. 9 Relation between value of
(horizontal :9 . 0 1 .
0 ) and r (vertical) for sub district of Sawit with
=0.3 ; the smallest r=0.6673%; for
=0.7 ; the biggest r=29.6215% .Fig. 10 Relation between value of
(horizontal :9
.
0
1
.
0
) and r (vertical) for sub district of Banyudono ,with
=0.2 ; r=12.7175% as the biggest;
=0.8 ;r=0.2212% asthe smallest.
Based on the observation above, we cannot conclude in which value of
leads to convergent solution, i.e. varying
implies reducing r and vice versa. The computation is done by Solver and fmincon.m of MATLAB have nearly the same results. The ACO has different result compared to solver and fmincon.mTheoretically, the Ant Colony Algorithm has no computation on gradient for searching the critical solution.
Case 3 : Vary
: 0.55Fig. 11 Relation between value of
(horizontal),0
.
5
5
and r (vertical) with
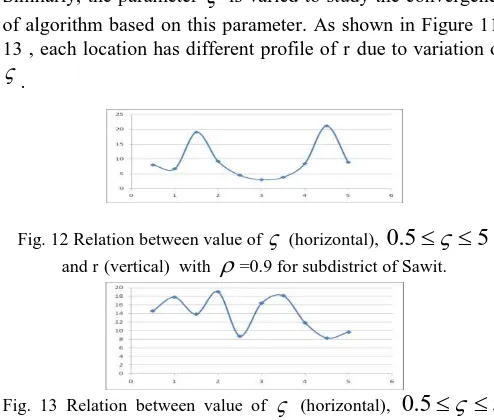
=0.4 for sub district of Teras.Similarly, the parameter
is varied to study the convergence of algorithm based on this parameter. As shown in Figure 11-13 , each location has different profile of r due to variation of
.Fig. 12 Relation between value of
(horizontal),0
.
5
5
and r (vertical) with
=0.9 for subdistrict of Sawit.Fig. 13 Relation between value of
(horizontal),0
.
5
5
and r (vertical) with
=0.9. for subdistrict of Banyudono . Thus the variation of the parameters
and
have not contributed the convergence of r. However the use of this algorithm is meaningful since the algorithm works quickly and may reach nearly the same as other algorithms, i.e. simplex (provided by solver in Excel) and trust region (fmincon.m provided by MATLAB). This can be achieved since the coefficients are significant enough though there is 1 coefficient not significant statistically.V.CONCLUSION
This paper discusses of designing the prototype G2A for low technology used in agriculture staffs in villages. This prototype contains 2 parts : excel for Modified GSTAR and GIS for presenting optimization results done by the excel.
Banyudono) is chosen to study the optimization due to the production of paddy fields.
The prototype G2A works well for deriving the objective functions for each location and presenting the result related to each location on the map.
The analysis of optimization is done by comparing the result with fmincon.m and varying parameters in Ant Colony Algorithm . The result of fmincon.m agrees with G2A. Though the ACO gives the similar result, its convergent has not been observed well.
ACKNOWLEDGMENT
The research here is funded by Research Center of SWCU under the scheme UNGGULAN PERGURUAN TINGGI SK No.31/Penel/Rek/5/I/2015. The authors are also grateful for the comments of peer reviewers such that this paper can be improved.
REFERENCES
[1] H.A Parhusip, S.W.M. Edi, “Optimal Production of Paddy Fields Using Modified GSTAR Models”, International Journal of Agricultural Science and Technology (IJAST) , Vol. 3, Issue 1, February 2015,pp.1-9.
[2] P.D, Apriyanti, H.A. Parhusip, L. Linawati, ”Model GSTAR Termodifikasi untuk Produktivitas Jagung di Boyolali”, Prosiding Seminar Nasional UNNES, 8 Nov 2014,pp. 314-325.
[3] H.A. Parhusip, W.M. Edi, “Analisa Data Iklim Boyolali dengan Regresi Klasik dan Metode GSTAR”, Prosiding Seminar Nasional Matematika dan Pendidikan Matematika, 24 Mei 2014, hal. 319-331, Universitas PGRI Ronggolawe,Tuban (in Indonesian).
[4] H.A. Parhusip, W.M Edi, S.Y.J. Prasetyo, Analisa Data Pemodelan Untuk Ilmu Sosial dan Sains, Tisara Grafika Salatiga,2014, 398 hlm, 25 cm (in Indonesian).
[5] H.A. Parhusip, Y.Martono,”Optimization of Colour Reduction for Producing Stevioside Syrup Using Ant Colony Algorithm of Logistic Function”, proceeding of The Fifth International Symposium on Computational Science, Vol.1, pp 91-101,15-16 May,2012. GMU. [6] V.P. Dewi, H.A. Parhusip, L. Linawati, “Optimasi Hasil
Panen Padi menggunakan Singular Value Decomposition (SVD) dan Ant Colony Algorithm (ACO)”, Prosiding Seminar Nasional Matematika UNS,2013 (in Indonesian).
[7] H.A. Parhusip, Optimasi Taklinea r, Tisara Grafika Salatiga, 2014, 221 hlm. (in Indonesian).
[8] S.S. Rao, Engineering Optimization, Theory and Practice, John Wiley & Sons, Inc., Hoboken, New Jersey, 2009, pp.714-722.
[9] H.A. Parhusip, Hartini,”Biharmonic Protein Function In MOCORIN and Its Optimization” , International Journal of Current Research, Vol. 6, Issue, 07, pp.9694-9700, 2014.
[10] V.P. Dewi, H.A. Parhusip, L. Linawati, “Analisa Hasil Panen Padi menggunakan Pemodelan Kuadratik”,
Prosiding Seminar Nasional Matematika VII UNNES, 2013.
[11] H. Guosheng, H. Liang S, Song, L. Pengchao, C. Xilong, Hongwei, “Support vector regression and ant colony optimization for grid resources prediction” , Lecture Notes in Computer Science Volume 6064, pp 1-8, 2010.
[12] V.E. Neagoe, C.E. Neghina, D.M , Neghina, “Ant Colony Optimization for Logistic Regression and Its Application to Wine Quality Assessment “,Journal of Mathematical Models for Engineering Science,pp.195-200, 2010.