Optimization of Catalytic degradation ofPlastic to Aromatics Over HY Zeolite
Didi Dwi Anggoro
Chemical Engineering Department, Diponegoro University
Jl. Prof Sudharto SH, Tembalang, Semarang 50239, Indonesia
Telp/Fax: 62-24-7460058; Email: [email protected]
Abstract
Feedstock recycling methods to convert plastic waste into liquid hydrocarbons
products are becoming an important issue since dumping plastic waste into landfill and
incineration are not appropriate methods due to legislative and environmental
problems. Catalytic degradation of plastics into high quality liquid hydrocarbons is one
of the more accepted and promising methods.
In this study HY zeolite is used as catalysts and polyethylene as feedstock. The
polyethylene melt heated at degradation reaction under a nitrogen atmosphere in the
melter was pressed out by pressurized nitrogen (0.11–0.15MPa) into the reactor loaded
with 1 - 3 gram of catalyst through a capillary. Nitrogen was flowed as a carrier gas at a
rate of 10 ml/min. The product distribution, the yield of liquid products and liquid
composition are further investigated. The effects of temperature and weight of zeolite Y
on product distribution and composition of liquid products are investigated. The
optimum conditions and model are also estimated by Statistica 6.0 software.
The Pareto chart indicated that the variable with the largest effect was
temperature (X1). From the response surface methodology (RSM) results the optimal
liquid yield of 13.3%, which 49.7% aromatics content, at the optimized reaction
Introduction
There has recently been a growing interest in plastics recycling because of
serious environmental problems caused by waste plastics as well as their potential for
use as resources. Plastics can be recycled by three different methods: mechanical
recycling, chemical recycling (otherwise termed feedstock recycling or tertiary
recycling) and energy recovery. Catalytic degradation of plastics into fuel oil is one of
the more accepted and promising methods.
Various kinds of techniques to convert plastic wastes into either solid or liquid
fuels have been proposed. In the middle of the 1970s, thermal degradation of plastic
wastes into fuel oils was studied extensively, but the oils obtained showed a wide
distribution of carbon atom numbers and contained a significant fraction of olefins [2].
Since olefins are easily polymerized into unusable compounds during storage and
transportation, the oils obtained by a thermal degradation were not fit for fuel oils [5].
The catalytic degradation of plastic wastes was studied using solid acids and
bases as catalysts [5–7]. It was found that the oils obtained by catalytic degradation
over those solid acids contained lower amounts of olefins and were rich in aromatics
compared to the oils obtained by a thermal degradation.
Plastic wastes treated by catalytic degradation processes are mainly limited to
waste polyolefins and polystyrene (PS). Waste polyvinyl chloride (PVC) has been
excluded because of the emission of hazardous gases [9]. Now, the catalytic conversion
of polyolefins into fuels is one of the most significant options of the plastic recycling
technologies. However, there is not much research work being done on the
In this study the thermal and catalytic degradations of polyethylene (PE) are
carried out in a quartz reactor by utilizing a batch operation. The product distribution,
the yield of liquid products and liquid composition are further investigated. The effects
of temperature and weight of zeolite Y on product distribution and composition of
liquid products are investigated. The optimum conditions and mathematical model are
also estimated by Statistica 6.0 software.
Experimental
Commercially available polyethylene sample with a low density of 0.915 g/cm3
was obtained from Aldrich Chemical Co. and used without further treatment. They
were pressed into disks, crushed and sieved to give particle sizes ranging from 16 to 32
mesh. Zeolite HY obtained from Zeolyst Co. were used as catalysts. The catalysts were
then calcined in air at 550oC for 3 h.
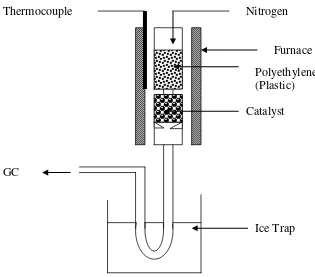
Figure 1 shows the fixed-bed tubular flow reactor system used in the present
study. Briefly, the polyethylene melt heated at degradation reaction under a nitrogen
atmosphere in the melter was pressed out by pressurized nitrogen (0.11–0.15 MPa) into the reactor loaded with 1 - 3 gram of catalyst through a capillary. Nitrogen was flowed
as a carrier gas at a rate of 10 ml/min. The degradation reaction was carried out at a
temperature of 300 – 500oC
The amounts of the liquid and the wax produced were measured by weighing.
The coke which deposited on the catalyst surface was determined from the increase in
catalyst weight before and after the reaction. The liquid samples collected were
analyzed on a Perkin Elmer Gas Chromatograph equipped with a flame ionization
The low, middle and high levels of all the independent variables were
temperature reaction , X1; and weight of catalyst, X2. Accordingly, 300oC, 400oC and
500oC were chosen for variable X1 and 1.0 g, 2.0g and 3.0 g for X2 (Table 1).
Allowances for extreme measures are designated as - and + in the central composite
design.
According to central composite design, the total number of experiment
combinations is 2k + 2k + no, where k is the number of independent variables and no is
the number of experiments repeated at the center point [1,3,4,8]. In this case, no = 2.
The actual experimental design for optimization is shown in Table 2. It was found that
a total of 10 runs were needed to optimize the yield of liquid. The result for the design
of experiment was obtained by using the Statistica version 6.0.
Results and Discussion
Optimization of Yield of Liquid by Regression Analysis
The result for yield of liquid according to the experimental design is given in
Table 2. The application of response surface methodology yielded the following
regression equation, which is an empirical relationship between yield of liquid and the
test variable in coded unit as given in equation (1).
Yp = - 56.2855 + 0.2628*X1 + 10.9571*X2– 0.0003*X12– 2.4375*X22
- 2.7339*10-15 *X1*X2 ……….. (1)
The fitting of the model can be checked by several criteria. The Analysis of
Variance (ANOVA) tabulated in Table 3 pertains to the response of the liquid yield.
did not fit the model. Each of the observed values, Yo is compared with the predicted
value, Yp calculated from the model, as tabulated in Table 2.
Pareto Chart (Figure 2) indicated that the most significant parameters are clearly
the temperature, (X1) than weight of catalyst, (X2). The interaction between the
temperature and weight of catalyst, (X1X2) did not seem to have affected the liquid
yield.
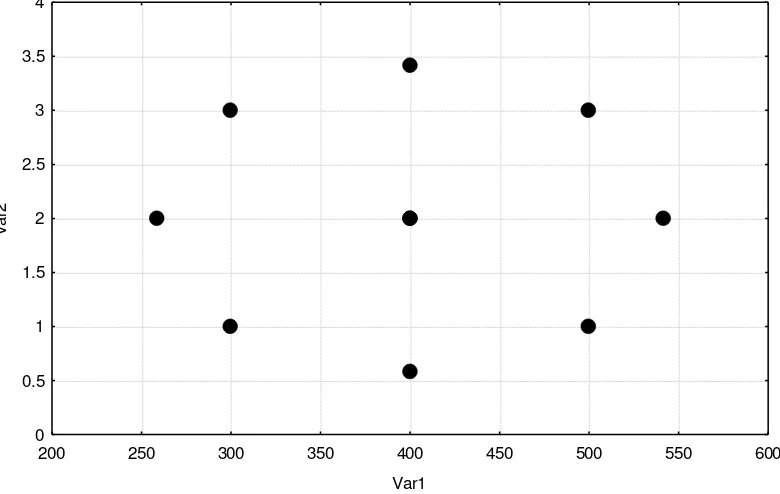
Optimization of Yield of Liquid by Analyzing the Response Surface Contour Plots
The yield of liquid can also be predicted from the respective contour plots. Each
contour curve represents an infinite number of two test variables and others are
maintained at their respective zero level. The maximum predicted liquid yield is
indicated by the surface confined in the smallest ellipse in the contour diagram [1,4,8].
It is evident from the plot that liquid yield reached its maximum at a
combination of coded level 412oC of temperature and 2.25 gram of catalyst weight. The
model predicted a maximum liquid yield of 13.38% within this range (Figures 3 and 4).
The results from Response Surface Method (RSM) using Statistica software
indicated that the optimum point for liquid yield is 13.38 when reaction temperature =
412oC and weight of catalyst = 2.25 gram. The catalytic reaction test at the optimized
reaction condition is 13.0 for liquid yield.
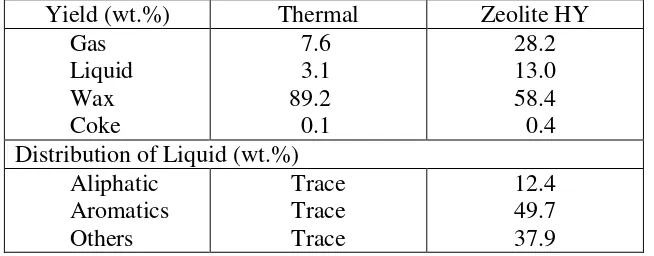
The composition of liquid product over HY catalyst at the optimized reaction
condition (412oC and 2.25 gram HY catalyst) is shown in Table 4. The liquid
composition has a low aliphatic and high aromatics content, at 12.4% and 49.7%,
Conclusions
The liquid yield from degradation of plastic was optimized over HY zeolite
catalyst using Statistica version 6.0 software. The two independent variables involved
in the optimization are temperature and weight of catalyst. The Pareto chart indicated
that the variable with the largest effect was temperature (X1). This is followed by
weight of catalyst (X2). The interactions between two of the independent variables can
be neglected. From the RSM results the optimal liquid yield of 13.3%, which 49.7%
aromatics content, at 412oC and 2.25 gram catalyst was obtained. The adequacy of this
model is confirmed by means of variance analysis and additional experiment.
References
1. Amin,N.A.S and Didi D. Anggoro, 2004, FUEL, 83, 487.
2. Audidisio, G., Silvani, A., Beltrame, P., 1993, J. Anal. Appl. Pyrol., 7, 83.
3. Box, G.E.P., Hunter, W.G., and J.S. Hunter, 1978, ” Statistics for Experiment, An Introduction to Design , data Analysis and Model Building”, John Wiley &
Sons Inc., New York.
4. Cornell, J.A., 1990, “How to Apply Response Surface Methodology”, American Society for Quality Control, USA.
5. Ide, S., Ogawa, T., Koroki, T., Ikemura, T., 1984, J. Appl. Poly. Sci., 29, 2561.
6. Ishihara, Y., Nanbu, H., Ikemura, T., Tasue, T., 1990, Fuel, 69, 978.
7. Muller, J., Dongmann, G., 1998, J. Anal. Appl. Pyrol. 45, 59.
8. Myers, R.H., 1976, “Response Surface Methodology”, Edwards Brothers, USA. 9. Ohkita, H., Nishiyama, R., Tochihara, Y., Mizushima, T., Kakuta, N., Ueno, A.,
Table 1. Experimental Range and Levels of Independent Variables
X, Variables Variable Level Step Change
Value X
- 0
X1, Temperature 300 400 500 100
X2, Wt. Catalyst 1.0 2.0 3.0 1.0
Table 2. Fractional factorial central composite design two variable with the observed responses (Yo) and predicted values (Yp)
Run X1 X2 Yo Yp (Yo-Yp)
1 300 1.0 3.0 2.4 0.6
2 300 3.0 5.0 4.8 0.2
3 500 1.0 4.0 3.9 0.1
4 500 3.0 6.0 6.4 -0.4
5 400 2.0 10.0 10.0 0.0
6 259 2.0 2.0 2.5 -0.5
7 541 2.0 5.0 4.7 0.3
8 400 0.6 3.0 3.4 -0.4
9 400 3.4 7.0 6.8 0.2
10 400 2.0 10.0 10.0 0.0
Table 3. ANOVA for the yield of liquid
Source Sum of square
Degree of freedom
Mean square
F- value R2
S.S. Regression 69.71 5 13.942 50.2414414 0.98432646
S.S. Error 1.11 4 0.2775
[image:7.595.150.477.569.697.2]S.S. Total 70.82 9
Table 4. The yield of products and composition of liquid from catalytic degradation of plastics over HY catalyst at 412oC and 2.25 gram of HY catalyst
Yield (wt.%) Thermal Zeolite HY Gas Liquid Wax Coke 7.6 3.1 89.2 0.1 28.2 13.0 58.4 0.4 Distribution of Liquid (wt.%)
Figure 1. The fixed-bed tubular flow reactor system.
0,
4,214874
6,520065
-9,95249
-13,0148
p=,05
Ef f ect Estimate (Absolute Value) 1Lby 2L
(1)Var1(L) (2)Var2(L) Var2(Q) Var1(Q)
Figure 2. Pareto chart of standardized effects of liquid yield Nitrogen Thermocouple
Furnace
Polyethylene (Plastic)
Catalyst
Figure 3. Three-D graphic surface optimization of liquid yield versus temperature (Var 1) and weight of catalyst (Var 2)
200 250 300 350 400 450 500 550 600
Var1 0
0.5 1 1.5 2 2.5 3 3.5 4
V
a
r2