Full Terms & Conditions of access and use can be found at
http://www.tandfonline.com/action/journalInformation?journalCode=vjeb20
Download by: [Universitas Maritim Raja Ali Haji], [UNIVERSITAS MARITIM RAJA ALI HAJI
TANJUNGPINANG, KEPULAUAN RIAU] Date: 13 January 2016, At: 17:28
Journal of Education for Business
ISSN: 0883-2323 (Print) 1940-3356 (Online) Journal homepage: http://www.tandfonline.com/loi/vjeb20
Student Personality Type Versus Grading
Procedures in Intermediate Accounting Courses
Robyn Lawrence & Larry W. Taylor
To cite this article: Robyn Lawrence & Larry W. Taylor (2000) Student Personality Type Versus Grading Procedures in Intermediate Accounting Courses, Journal of Education for Business, 76:1, 28-35, DOI: 10.1080/08832320009599047
To link to this article: http://dx.doi.org/10.1080/08832320009599047
Published online: 31 Mar 2010.
Submit your article to this journal
Article views: 36
View related articles
Student Personality Type Versus
Grading Procedures in Intermediate
Accounting Courses
ROBYN LAWRENCE
zyxwvutsrqponmlkjihgfedcbaZYXWVUTSRQPONMLKJIHGFEDCBA
University
of
Scranton Scranton,Pennsylvania
uring the past 10 years, accounting
D
professionals and educators have expended considerable time and resources to evaluate the educational experience and desired skills of accounting students. Especially with the current trend of diminished enrollment in accounting programs, it is particular- ly important that college accountingcourses
zyxwvutsrqponmlkjihgfedcbaZYXWVUTSRQPONMLKJIHGFEDCBA
not dissuade those studentsmost likely to enhance, and succeed in, the accounting profession. For example, given that students possess varying inherent talents, the structure of the accounting courses and the methods for evaluating accounting students should not discourage otherwise able students. Of primary importance is the possible impact of students’ temperaments and personality types on their performance in grade-influencing activities. In this article, we investigate this issue for intermediate accounting courses designed for accounting majors.
Jung (1971) proposed that people tend to have specific preferences for perceiving the world and judging pref- erences for processing the information. He suggested three pairs of opposing attitudes: (a) an attitude toward life (extroversion [El versus introversion [I]); (b) perception (sensing [ S ] versus intuition [N]); and (c) judgment (think- ing [TI versus feeling [F]). Isabel Brig- gs Myers subsequently added a fourth
28 Journal of Education for
zyxwvutsrqponmlkjihgfedcbaZYXWVUTSRQPONMLKJIHGFEDCBA
BusinessABSTRACT. Though teams com-
posed of various personality types are expected to perform quite well as problem solvers, the extant literature
has demonstrated a fairly narrow range of personality types in business
courses and the accounting profession. To determine whether various grade- influencing activities in accounting courses favor certain personality types, the personality preferences and
temperaments of
zyxwvutsrqponmlkjihgfedcbaZYXWVUTSRQPONMLKJIHGFEDCBA
82 intermediateaccounting students were determined. Relationships were then found between personality variables and the
number of class absences, class partic- ipation, and the performance on
homework and problems on the final
examination.
LARRY W. TAYLOR
Lehigh University Bethlehem, Pennsylvaniadimension, orientation toward life (judging [J] versus perceiving [PI). Thus, individuals can be classified according to 16 unique personality types based on the four dimensions, from which the familiar Myers Briggs Type Indicator (MBTI) was developed (Myers, 1962). Subsequently, David Keirsey developed the Keirsey Tem- perament Sorter (KTS) to classify indi- viduals according to the 16 MBTI types. Based on a 25-year clinical study of differences in temperament and charac- ter, Keirsey and Bates (1984) and Keirsey (1998) developed more fully the descriptions of each MBTI classifi- cation. Additionally, they promoted four “temperament” types:
1. sensation-perceiving (SP: ISTP,
2. sensation-judging (SJ: ISFJ, ESFJ,
3. intuition-thinking (NT: I m p ,
zyxwvutsrqponmlkjihgfedcbaZYXWVUTSRQPONMLKJIHGFEDCBA
4.
intuition-feeling (NF: I M J , E M J , ESTE ISFP, and ESFP)ISTL and ESTJ)
E m P , I m J , and E N J )
INFP.
and E m P ) .This classification is incorporated into the empirical analysis that follows. Several studies have used the MBTI to examine the relationship between per- sonality traits and success in college courses and in the accounting profes- sion. Carland and Carland (1987) found that the two most common personality types for both business students and nonbusiness students were SFJ and NFJ. Oswick and Barber (1998) found that though students in the introductory accounting course at a British university “showed a clear inclination towards Thinking (70.9%) and Extroversion (60.8%)” (p. 252), there was little evi- dence to support the hypothesis that per- sonality type was linked to overall course performance. However, at U.S.
universities, Nourayi and Cherry (1 993) found that sensing ( S ) students did bet-
ter than intuitive (N) students in the sec- ond intermediate accounting, tax accounting, and auditing courses. Laribee (1994) found evidence that stu- dents preferring E, N, F, and P may be
filtered out of the accounting major between the sophomore year and gradu- ation. In the profession at large, Shack- leton (1980) found that introversion (I) was more highly represented among accountants and financial managers (58%) as compared with the general population (25%, as reported by Keirsey and Bates, 1984). Several studies have found that ISTJ, ESTJ, and INTJ are the most prevalent personality types among professional accountants, with estimat- ed percentage representations ranging (respectively) from 20%-26%, 13%-15%, and 12%-13% (Jacoby,
1981; Kreiser, McKeon,
zyxwvutsrqponmlkjihgfedcbaZYXWVUTSRQPONMLKJIHGFEDCBA
& Post, 1990;Schloemer & Schloemer, 1997; Shack- leton, 1980). By comparison, the ISTJ, ESTJ, and INTJ types, respectively, are 6%, 13%, and 1% of the general popula- tion (Keirsey & Bates, 1984). Finally, Jacoby (1981) found that the ISTJ type is the most likely to succeed in the audit practice of national public accounting firms, although Schloemer and Schloe- mer (1997) determined that post-1989 partners of CPA firms displayed the extroversion (E) preference more often (83%) than did the older partners (20%). This research does not provide
insight into
zyxwvutsrqponmlkjihgfedcbaZYXWVUTSRQPONMLKJIHGFEDCBA
why certain personalitytypes are more represented in upper division accounting courses and in the public accounting profession in the United States. One possible contribut- ing factor may be that the methods of presenting accounting course material are more suited for particular personali- ty traits. For example, Ott, Mann, and Moores (1990) reported that (based on the scores on the first exam in an intro-
ductory accounting course) sensing
zyxwvutsrqponmlkjihgfedcbaZYXWVUTSRQPONMLKJIHGFEDCBA
(S)and thinking (T) types perform better with lectures, whereas intuitive (N) and feeling (F) types perform better with computer-assisted instruction. Wolk and Nikolai (1997) found that, though undergraduate and graduate accounting students tended toward extroversion (E)
(55% and
zyxwvutsrqponmlkjihgfedcbaZYXWVUTSRQPONMLKJIHGFEDCBA
52%, respectively), approxi-mately 60% of accounting faculty tend- ed toward introversion (I). Significant differences were also found regarding sensing (S) (79% for undergraduates versus only 56% for faculty) and think- ing (T) (65% for undergraduates versus 87% for faculty). Finally, for business students and faculty in general, Cooper
and Miller (1991) found that the level of congruence between learning style and teaching style was related to student evaluations of the course and the instructor, but not to the course grades.
Our purpose in this study was to determine whether activities that form the basis for grades in upper division accounting courses are “friendlier” to certain personality types. In other words, do some personality types receive more positive feedback and thus continue to pursue an accounting degree? It is important to determine if grading procedures in accounting cours- es are filtering students according to personality, because such filtering would have significant ramifications for the future success of the accounting pro- fession in general.
Method Subjects
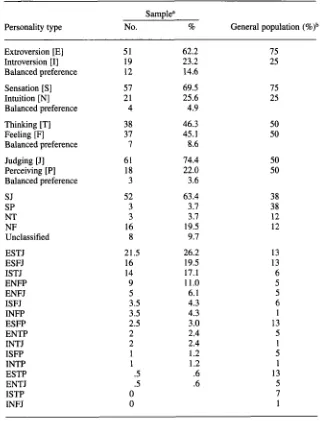
Eighty-two students in five intermedi- ate financial accounting classes (four Intermediate I courses and one Interme- diate I1 course) taught by two instructors at a private university voluntarily took the KTS on the last day of class. The composition of the sample by personali- ty types, compared with the overall gen- eral population as reported by Keirsey and Bates (1984), is given in Table 1. The sample composition closely emulat- ed the general population along three of the four personality dimensions. How- ever, there was a higher percentage of judging (J) individuals in this sample
(74.4%) than in the general population
zyxwvutsrqponmlkjihgfedcbaZYXWVUTSRQPONMLKJIHGFEDCBA
(50%), but less than in a previous study of upper division accounting courses (94%) (Nourayi & Cherry, 1993). There was also a much higher percentage of SJ and NF temperament types than in the general population.
ESTJ and ISTJ were among the top three individual personality types. Sur- prisingly, ESFJ was the second most common personality type in this sam- ple. The percentages of SFJ (23.8%) and NFJ (6.1 %) individuals in this study were well below the 32% and 20% fig- ures reported by Carland and Carland (1987) for business students in general. Sixteen students (24%) from the five classes (all of whom were enrolled in
three of the classes) did not volunteer to take the KTS. Their characteristics were compared with those of the students who completed the KTS and were from the same three classes. The nonresponse group earned a lower overall grade in the course (mean equal to 1.7 versus 2.5); performed worse on the open- ended problems on the first examination (mean equal to 68 versus 78); and were less likely to volunteer for the optional extra credit oral presentation (40% ver- sus 75%).
Procedure
To estimate the impact of the person- ality variables on the performance indi- cators, a recursive structural system was constructed. Y represented any one of the performance variables, such as the course grade, homework points, or the number of absences. Because factors such as past success, gender, and the course type may influence an individ- ual’s current achievement, a reasonable set of conditioning variables (weakly exogenous) was incorporated into this study. These variables were (a) a gender indicator that equals 1 for males and 0 for females (SEX), (b) the grade point average prior to the course (CUMGPA), and (c) an indicator for the course that equals 1 for students in the second inter- mediate accounting course (ACCII). Thus, the structural model is
Yt = al
+
a2ACCIIt+
a3SEXt+
a4CUMGPAt+
et (1)where et is a disturbance term that has zero expectation conditional upon the regressors.
Personality types that are genetically determined or experientially developed are most likely to heavily influence CUMGPA, but not necessarily the other two regressors. As such, CUMGPA was specified as a linear function of student temperament scores (Cl, C2, C3, C4, TT1, TT2, TT3, TT4) where these vari- ables were defined as follows:
C1 is the Extroversion score (versus C2 is the Sensation score (versus C3 is the Thinking score (versus Introversion)
Intuition) Feeling)
September/October 2000 29
TABLE 1. Personality Types Represented in the Sample
zyxwvutsrqponmlkjihgfedcbaZYXWVUTSRQPONMLKJIHGFEDCBA
Personality type
zyxwvutsrqponmlkjihgfedcbaZYXWVUTSRQPONMLKJIHGFEDCBA
Sample"
No.
zyxwvutsrqponmlkjihgfedcbaZYXWVUTSRQPONMLKJIHGFEDCBA
% General population (%)bExtroversion [El Introversion [I]
Balanced preference
Sensation [S] Intuition [N]
Balanced preference
Thinking [TI Feeling [F] Balanced preference
Judging [J]
Perceiving [PI
Balanced preference
SJ SP
NT
zyxwvutsrqponmlkjihgfedcbaZYXWVUTSRQPONMLKJIHGFEDCBA
NF
Unclassified
ESTJ ESFJ ISTJ ENFP ENFJ ISFJ
INFP
ESFP ENTP INTJ
ISFP
INTP ESTP ENTJ
ISTP
INFJ
51 19
I2
57 21 4 38 37 7 61
18
3 52 3 3 16 8 21.5 16 14 9 5 3.5 3.5 2.5 2 2
1
1
zyxwvutsrqponmlkjihgfedcbaZYXWVUTSRQPONMLKJIHGFEDCBA
.5.5
zyxwvutsrqponmlkjihgfedcbaZYXWVUTSRQPONMLKJIHGFEDCBA
0 0
62.2 23.2 14.6 69.5 25.6 4.9 46.3
45.1
8.6
74.4 22.0 3.6 63.4 3.7 3.7 19.5 9.7 26.2 19.5 17.1
11.0
6.1 4.3 4.3 3.0 2.4 2.4 1.2 1.2 .6
.6
75 25 75 25 50 50 50 50 38 38 12 12 13 13 6
5
5
6
1 13
5 1 5 1 13
5
7 1
aFor the frequencies of the 16 individual personality types, balanced preferences were scored as one half for each of the extremes for that dimension. T h e source of the percentages for the gen-
eral population was Keirsey and Bates (1984).
C4 is the Judging score (versus Per- ceiving)
TT1 is an indicator variable for the SJ temperament type that equals unity only if C2 > 10 and C4 > 10 (0 other-
wise)
TT2 is an indicator variable for the SP temperament type that equals unity only if C2 > 10 and C4 < 10 ( 0 other-
wise)
'IT3 is an indicator variable for the NT temperament type that equals unity only if C2 < 10 and C3 > 10 (0 other-
wise)
TT4 is an indicator variable for the NF temperament type that equals unity only if C2 < 10 and C3 < 10 (0 other-
wise)
Upon substitution into model (1) for CUMGPA, the following reduced form model was obtained:
Yt = b l
+
b2ACCIIt t b 3 S E 5+
+
bgTT1,+
bgTT2t+
blOTT3t+
b4Clt+
b5C2+
bgC3+
b7C4 b l l n 4 , + Vt (2)where vt is a disturbance with zero expectation conditional upon the regres- sors.
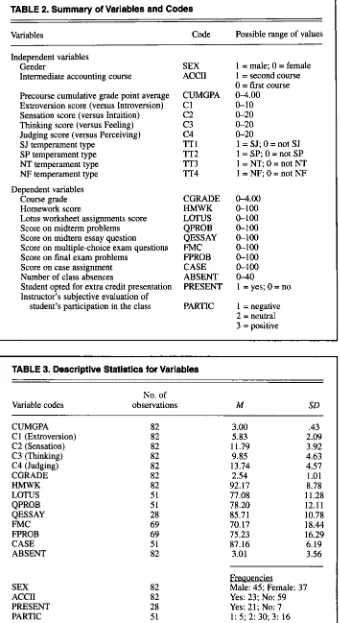
The variables used in this study, their codes, and possible ranges of values are presented in Table 2. The independent variables were the scores on the KTS for each of the four dimensions, gender, the cumulative grade point average prior to entering the intermediate accounting course, and an indicator as to whether it was the first or second intermediate financial accounting course. Because the ages of the students were very homoge- neous in this sample, an age variable was not considered. Moreover, given the lim- ited sample size, some factors that also may affect student performance in the classroom could not be included in the analysis (Turner, Holmes, & Wiggins, 1997; Wooten, 1998).
The dependent variables consisted of various types of activities that often con- tribute to an accounting course grade. These activities included attendance, homework, Lotus 123 spreadsheet assignments in three of the classes, a written case by pairs of students in three of the classes, and an optional oral pre- sentation for extra credit in two of the classes. Each of these items did not exceed 10% of the course grade. The scores (percentage correct) from differ- ent formats of examination questions also were included: multiple-choice questions and the open-ended problems from the comprehensive final examina- tions for all five classes, scores for an essay question from a midterm exam in two of the classes, and open-ended prob- lems for three of the classes. Additional- ly, the course grade earned by the stu- dents in all five of the classes and a subjective evaluation by the instructor toward the student's class participation in three of the classes were included. The number of observations, the mean and standard deviation for each cardinal variable, and the frequency and the num- ber of observations for each classifica- tion variable are presented in Table 3.
Results
Ordinary least squares (OLS) struc- tural estimates for several performance variables are presented in Table 4. The Breusch and Pagan (1979) test for het- eroskedasticity was employed to deter- mine whether it was necessary to use
the robust standard errors proposed by
zyxwvutsrqponmlkjihgfedcbaZYXWVUTSRQPONMLKJIHGFEDCBA
30 Journal
zyxwvutsrqponmlkjihgfedcbaZYXWVUTSRQPONMLKJIHGFEDCBA
of Education for Business [image:4.612.54.380.71.492.2]TABLE 2. Summary of Variables and Codes
zyxwvutsrqponmlkjihgfedcbaZYXWVUTSRQPONMLKJIHGFEDCBA
Variables Code Possible range of values
Independent variables Gender
Intermediate accounting course
Precourse cumulative grade point average Extroversion score (versus Introversion) Sensation score (versus Intuition) Thinking score (versus Feeling)
Judging score (versus Perceiving)
zyxwvutsrqponmlkjihgfedcbaZYXWVUTSRQPONMLKJIHGFEDCBA
SJ temperament type SP temperament type
NT temperament type NF temperament type Dependent variables
Course grade Homework score
Lotus worksheet assignments score Score on midterm problems Score on midtem essay question Score on multiple-choice exam questions Score on final exam problems
Score on case assignment Number of class absences
Student opted for extra credit presentation Instructor’s subjective evaluation of
student’s participation in the class
SEX ACCII
CUMGPA c 1 c 2 c 3
c4
TTI TT2 TT3 TT4
CGRADE HMWK LOTUS QPROB QESSAY FMC FPROB CASE ABSENT PRESENT
PARTIC
1 =
zyxwvutsrqponmlkjihgfedcbaZYXWVUTSRQPONMLKJIHGFEDCBA
male; 0 = female1 = second course
0 = first course
zyxwvutsrqponmlkjihgfedcbaZYXWVUTSRQPONMLKJIHGFEDCBA
04.00 0-10 0-20 0-20 0-20
1 = SJ; 0 = not SJ
1 = SP; 0 = not SP l=NT;O=notNT l=NF;O=notNF
04.00 0-100 0-100
0-100
0-100 0-100 0-100
0-100
zyxwvutsrqponmlkjihgfedcbaZYXWVUTSRQPONMLKJIHGFEDCBA
0-40
1 = yes; 0 = no 1 = negative
[image:5.612.49.389.48.671.2]2 = neutral 3 = positive
TABLE 3. Descriptive Statistics for Variables
Variable codes
No. of
observations
zyxwvutsrqponmlkjihgfedcbaZYXWVUTSRQPONMLKJIHGFEDCBA
M SDCUMGPA
C 1 (Extroversion) C2 (Sensation) C3 (Thinking)
C4 (Judging)
CGRADE
HMWK
LOTUS QPROB QESSAY FMC FPROB CASE ABSENT
82
82 82
82 82 82 82 51 51 28 69 69 51 82
3 .OO
5.83 11.79
9.85 13.74
2.54 92.17 77.08 78.20 85.71 70.17 75.23 87.16 3.01
.43 2.09 3.92 4.63 4.57 1.01 8.78 11.28 12.11 10.78 18.44 16.29 6.19 3.56
SEX ACCII PRESENT PARTIC
82 82 28 51
Freauencies
Male: 45; Female: 37
Yes: 23; No: 59 Yes: 21; No: 7 1: 5; 2: 30; 3: 16
White (1980). For three of the depen-
dent variables (CGRADE,
zyxwvutsrqponmlkjihgfedcbaZYXWVUTSRQPONMLKJIHGFEDCBA
HMWK,
andQPROB), the assumptions of homoske- dastic disturbances were invalid, but not
for the six other regressands. Because of missing observations (and a few cases where egregious outlier problems were detected), the sample size varies across
regressions. There were no essay ques- tions for students taking the second intermediate accounting course, and thus no need for the indicator variable ACCII in the QESSAY regression.
As expected, the precourse GPA was
related to most of the achievement mea- sures. Moreover, although males scored significantly lower on the homework assignments, this did not appear to affect their overall course grade. Though absences were more prevalent in the second intermediate financial accounting course, they were inversely related to the precourse GPA. Indeed, about 61% of the variation in the course grade and the number of absences could be explained by the variation of the regressors in the conditioning set. How-
ever, though the predictive capability of the structural model (1) is quite good, it does not provide insights into why some students earn higher grades. Variables related to personality characteristics were thus examined to provide insights into student performance on grade- influencing activities in intermediate accounting. Because presumably these variables would also influence the grades in prior courses, precourse GPA was omitted once the personality vari- ables were introduced into the model (see the reduced model [2]).
The reduced form estimates are pre- sented in Table 5. Because of multi- collinearity problems associated with small samples, a general-to-specific modeling strategy was adopted. Those regressors with statistically insignificant coefficients and relatively low partial R-
squares were dropped from the equa- tion. For consistency with the structural equation, however, the variables ACCII and SEX were retained regardless of
their statistical significance.
According to the results reported in Table 5, personality type is related to
student performance on homework, the final examination problems, and the number of absences. Those students scoring higher on the sensation prefer- ence tended to perform worse on the homework and better on the final exam- ination problems. Those students scor- ing higher on the judging preference performed better on the homework, and tended to incur fewer absences from
class. Those students scoring higher on
zyxwvutsrqponmlkjihgfedcbaZYXWVUTSRQPONMLKJIHGFEDCBA
September/October 2000 31
TABLE 4. OLS Structural Estimates’
zyxwvutsrqponmlkjihgfedcbaZYXWVUTSRQPONMLKJIHGFEDCBA
Dependent variable
Regressor CGRADE HMWK LOTUS QPROB
zyxwvutsrqponmlkjihgfedcbaZYXWVUTSRQPONMLKJIHGFEDCBA
QESSAYzyxwvutsrqponmlkjihgfedcbaZYXWVUTSRQPONMLKJIHGFEDCBA
FMC FPROB CASE ABSENTIntercept
zyxwvutsrqponmlkjihgfedcbaZYXWVUTSRQPONMLKJIHGFEDCBA
( t ratio)
zyxwvutsrqponmlkjihgfedcbaZYXWVUTSRQPONMLKJIHGFEDCBA
[p value]
ACCII
zyxwvutsrqponmlkjihgfedcbaZYXWVUTSRQPONMLKJIHGFEDCBA
( t ratio) [p value]
SEX ( t ratio) [p value]
CUMGPA
(t ratio)
[p value]
zyxwvutsrqponmlkjihgfedcbaZYXWVUTSRQPONMLKJIHGFEDCBA
R2
HET Sample sizeC
-3.756 (7.27) [.0001 0.104 (0.66) [SO71 -0.033
(0.26) [.797] 2.070 (13.0)
[.0001 .61
YES
98
70.80 (8.53)
[.ooOI -7.176
(3.30) [.oo11 -4.947
(2.93) [.003] 8.390 (3.42)
[
.oo
11 .65YES
96b
43.03 (3.64)
[.001] -5.400
(1.76) [.083] -2.245
(0.68) 12.45 (3.23)
[ .497]
[ .002] .61
NO
65b
8.331 (1.03) [.303] -5.923
(2.60)
[ .009] 1.427 (0.62) [.532] 23.62
(8.45) [ . o w
.59
YES
67
44.6 1
(4.15) [.0001
-
-4.543 (1.39) [.174] 14.59 (4.14)
[.ooOI
.34
NO
37
-17.63 (1.44)
[.153] 8.767 (2.69) [.009] 4.535 (1.48) [.I421 27.85
(7.00) l.0001
.4 1 NO
82
-1.803 (0.16) [.875] 7.970 (2.61)
[.011] 0.986 (0.34)
[.731] 24.90
(6.69) L.0001
.38
NO
82
74.98 (10.9)
2.170 (1.23) [.222] -0.943
(0.50) [.621] 3.949 (1.78)
[ .080] .07 NO 67
7.615 (2.98) f.0041 3.015 (4.30)
[ .000] 1.043 (1.63)
[.I061 -1.947
(2.41) [.018]
.61
NO
9 9 aThe Breusch-Pagan test for heteroskedasticity was employed to detect nonspherical disturbances. If the test rejected at the 5% significance level (HET is “Yes”), then White’s heteroskedastic-consistent covariance matrix was employed to obtain the standard errors for the r ratios that are given in the paren- theses. bEstimates of the structural models including the 2.2, and 3 outliers in HMWK, LOTUS, and ABSENT, respectively, revealed a similar pattern of significance to that reported above, except that in the LOTUS model, ACCII has a coefficient of -9.856 with a p value of .019. However, by including these outliers, the R2 for each of the models drops to between .25 and .28. T h e 16 students who did not take the KTS were included in the estimation samples to increase the efficiency of the estimators.
the thinking preference tended to miss class more often.
Students of the NT temperament type tended to perform worse on homework assignments and appeared to have incurred more absences than other tem- perament types (p value of .069). Stu- dents of the NF temperament type tend- ed to perform better on the final examination problems and possibly on the multiple-choice questions (p value of .072). There is marginally significant evidence that students of the SP tem- perament type tended to perform worse on the computer spreadsheet assign- ments (p value of .072).
Despite the differences in perfor- mance on the individual activities that were used to calculate course grades, we found that the overall course grades were only marginally related to personality type. Students with a judging preference tended to earn higher course grades (p value of .061), and students of the NT temperament tended to earn lower grades for the course (p value of ,062).
Because none of the personality vari- ables were observed for the 16 nonre- spondents, we dropped those cases
when estimating the reduced forms. However, as noted previously, those stu- dents who declined to participate earned lower grades (on average) than respon- dents. As is well known, the self-selec- tion bias introduced by a nonresponse group can possibly distort the (estimat- ed) regression response function. In order to investigate this possibility, the truncated regression model was employed (Amemiya, 1985) to account for low performers who were not included in the sample. Space consider- ations precluded us from reporting these results in tabular form. The empirical results were remarkably similar to those reported in Table 5. Indeed, all of the statistically significant variables from the OLS regression were again signifi- cant in the use of the truncated model. Moreover, we found stronger evidence for the inclusion of TT3 in the equation for absences when using the model that accounts for self-selection.
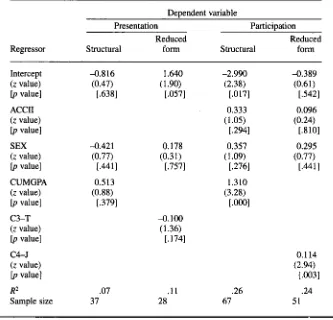
Two performance variables included in this study, Presentation and Partici- pation, were categorical in nature. The former dependent variable was binary and obtained a value of unity for those
students who made a presentation (none in the second intermediate accounting course) and zero otherwise. The probit estimates presented in Table 6 reveal that the precourse GPA and gender were only weak explanators in the structural equation. C3 was the only personality variable that was even mar- ginally significant in the reduced form (p value of .174). The negative sign on the C3 coefficient indicates a positive relationship between scores on presen- tations and scores indicating a feeling preference. Because Participation assumes values of 1, 2, or 3, the model
equations were estimated by ordered probit. According to the results report- ed in Table 6, the precourse GPA was a good predictor variable for participa- tion, and C4 was a strong predictor in the reduced form equation. The positive coefficient for C4 indicates a positive relationship between class participation and scores indicating a judging prefer- ence. Not surprisingly, the goodness- of-fit was quite low for the Presentation model, but stronger for the Participa-
2
tion model. The R measure was con- structed according to the procedures
TABLE 5. OLS Reduced Form Estimates’
zyxwvutsrqponmlkjihgfedcbaZYXWVUTSRQPONMLKJIHGFEDCBA
Dependent variableRegressor CGRADE
zyxwvutsrqponmlkjihgfedcbaZYXWVUTSRQPONMLKJIHGFEDCBA
H M W K LOTUS QPROBb QESSAYb FMC FPROB CASEb ABSENT InterceptzyxwvutsrqponmlkjihgfedcbaZYXWVUTSRQPONMLKJIHGFEDCBA
( t ratio)
zyxwvutsrqponmlkjihgfedcbaZYXWVUTSRQPONMLKJIHGFEDCBA
Lp value] ACCII
(t ratio)
[p value] SEX
(t ratio)
[p value] Cl-E c2-s
(t ratio)
[p value]
zyxwvutsrqponmlkjihgfedcbaZYXWVUTSRQPONMLKJIHGFEDCBA
(t ratio)
[p value] C4-J
(t ratio)
[p value]
(t ratio)
[p value] TT2-SP
(t ratio)
[p value] TT3-NT
(t ratio)
[p value] TT3-NF
(t ratio)
[p value]
zyxwvutsrqponmlkjihgfedcbaZYXWVUTSRQPONMLKJIHGFEDCBA
R2 HET Sample size C3-T TT1-SJ 1.904 (4.74) -0.186 (0.76) [.452] 0.147 (0.65) [.515]
[ .OOO]
-1.137 (1.89)
[ .062] . l l NO 82
95.59 (29.2)
[ .OOO] -8.443 (4.58) [.or331 -2.494 (1.48) [.143] - -0.57 1 (2.08) [.041] -
-
- 0.542 (2.33)[ .022]
- - - -
-
-
-11.03 (2.44) [.017]-
-
- .35 NO 82 81.99 (29.0) [.001] -10.25 (3.67) [.001] 0.508 (0.17)[ .865]
-
-
-
-
- - --
- - - --
-10.83 (1.84)[ .072]
- - -
-
- - .29 NO 51 71.06 (12.7)[ .OOO] -6.930 (2.15) [.037] 5.149 (1.49) [.143] - - - - -
-
- 0.509 (1.54) [.131] - - --
--
- --
- - - .16 NO 51 77.75 (9.63)[ .OOO]
-
-1.460 (0.3 1) [.756]
-
-
-
-
-
- - 0.910 (1.36) [.187] 4.594 (0.73)[ .472]
-
- - --
--
- - .09 NO 28 56.03 (7.95) [.0001 4.189 (0.89)[ .376] 4.81 1 (1.07) [.290] - - -
-
0.804 (1.31)[ 1.963
-
-
- - - --
- - --
- 11.9 (1.83) [.072] .09 NO 69 42.64 (4.17) 5.137 (1.28) [.206] 3.075 (0.81)[ .422] [ . o w
- 2.173 (3.03) [.OW
-
- - - --
-
- - - - - --
- 17.64 (2.57) [.013] .16 NO 69 9 1.25 (25.7) [.OO01 0.234 (0.13) [.895] -0.578 (0.3 1)[ .762]
-
-0.3 19
( 1.29)
[ .202]
-
-
-
- - --
-
- - - - - - - --
- .04 NO 51 2.987 (2.78) 3.461 (5.27)[ .OOO] -0.179 (0.34) [.734] 1.0051 - - - - 0.174 (2.81) -0.212 (2.93)
[ .003] [.0051
-
-
- - - - 4.062 (1.82)[ .069]
- - - .60 YES 81
“he Breusch-Pagan test for heteroskedasticity was employed to detect nonspherical disturbances. If the test rejected at the 5% significance level (HET is “Yes”), then White’s heteroskedastic-consistent covariance matrix was employed to obtain the standard errors for the t ratios that are given in the paren-
theses.
zyxwvutsrqponmlkjihgfedcbaZYXWVUTSRQPONMLKJIHGFEDCBA
bA few variables significant at the 20% or higher level were included because their omission caused R2zyxwvutsrqponmlkjihgfedcbaZYXWVUTSRQPONMLKJIHGFEDCBA
to fall precipitously. CThe estimate of the reduced form model for ABSENT that includes the one outlier revealed a similar pattern of significance to the reported above, except that C3 had a coef-ficient of .16 with a p value of .013. However, by including the outlier, R2 drops from .60 to .31.
outlined by Taylor (1997) for models with latent structures.
Discussion
Most of the subjects in this study showed a preference for introversion, intuition, and judging. The intuition preference indicates a preference for creativity, imagination, and improving
the status quo. The judging preference indicates a desire for a more orderly and controlled life. We found, however, that these two preferences did not appear together in the majority of the sample, as the students were overwhelmingly of the SJ temperament. Keirsey (1998) characterized SJ individuals as guardians who made “model students” and were well suited to auditing.
Conditional on the personality vari- ables, gender was not found to be a sig- nificant factor. In contrast, precourse GPA was found to be significantly relat- ed to all but two (performance on the paired student case write-up and on an optional presentation) of the grade- influencing activities examined. Inter- estingly, Turner, Holmes, and Wiggins (1997), and Nourayi and Cherry (1993)
September/October
zyxwvutsrqponmlkjihgfedcbaZYXWVUTSRQPONMLKJIHGFEDCBA
2000 33 [image:7.612.54.563.78.541.2]TABLE 6. Probit Estimates
zyxwvutsrqponmlkjihgfedcbaZYXWVUTSRQPONMLKJIHGFEDCBA
Deuendent variable
Presentation Participation
Reduced Reduced
Regressor Structural
zyxwvutsrqponmlkjihgfedcbaZYXWVUTSRQPONMLKJIHGFEDCBA
form Structural formIntercept
zyxwvutsrqponmlkjihgfedcbaZYXWVUTSRQPONMLKJIHGFEDCBA
( z value)
zyxwvutsrqponmlkjihgfedcbaZYXWVUTSRQPONMLKJIHGFEDCBA
[p value]ACCII
( z value) Ip value]
SEX
( z value) Ip value]
CUMGPA
( z value)
[p value]
( z value) Ip value]
C4-J
( z value)
Ip value]
zyxwvutsrqponmlkjihgfedcbaZYXWVUTSRQPONMLKJIHGFEDCBA
R2
Sample size
C3-T
-0.816 (0.47) [.638] 4 . 4 2 1
(0.77) [.441] 0.5 13
(0.88)
[.379] .07 37
1.640 (1.90)
[.057] 0.178 (0.31) [.757] 4.100
(1.36) [.174]
.11
28
-2.990 (2.38) [.017] 0.333 (1.05)
[ .294] 0.357
( 1.09)
[ .276] 1.310 (3.28)
[ .OOO] .26 67
-0.389 (0.61)
[ .542] 0.096 (0.24) [A101 0.295 (0.77) [.441] 0.114 (2.94)
[ .003] .24 51
concurred that intermediate accounting grades are significantly related to pre- course GPA but not gender.
The data revealed marginal evidence of a (positive) relationship between the overall course grade and the judging preference, and some evidence of a (negative) relationship between the course grade and the NT temperament type. These results are generally consis- tent with the empirical findings of Nourayi and Cherry (1993). However, unlike the current study, such previous studies have not indicated which activi- ties formed the basis for assigning course grades.
Our findings, as well as those of Nourayi and Cherry (1993), suggest the possibility of grading schemes for inter- mediate accounting courses that do not favor particular personality types. Rela- tionships appear to exist between per- sonality characteristics and student per- formance on grade-influencing activities such as homework assign- ments, examinations, absences, in-class participation, and computer assign- ments. In particular, open-ended prob-
34 Journal
zyxwvutsrqponmlkjihgfedcbaZYXWVUTSRQPONMLKJIHGFEDCBA
of Education for Businesslems and (possibly) multiple-choice questions on examinations may favor the sensation preference and the NF temperament. Whereas essay examina- tion questions and cases appear to be personality-type neutral, class participa- tion appears to favor those students with
a judging preference.
These results have important implica- tions regarding the selection of account- ing as a student’s major. The SJ tem- perament (and STJ in particular) has been the most prevalent preference combination in upper division account- ing courses and the accounting profes- sion over the past 2 decades. Not sur- prisingly, it is also the most common stereotype associated with the account- ing profession. As the profession extends into nontraditional areas (for example, consulting and forensic accounting), the strengths of the other three temperament types will most cer- tainly become more important. Course structure and course innovations should be evaluated not only according to skills developed, but also according to whether the courses are personality-
type biased. As an example, the expand- ed use of case studies appears to be a temperament-neutral activity. On the contrary, the move to a completely mul- tiple-choice CPA examination and away from personality-neutral essay ques- tions could potentially be a personality- biased filter.
Of course, an individual can con- sciously learn to use his or her less pre- ferred psychological functions, and thus a prevalence of selected personality types in accounting classes does not imply that other personality types are doomed to failure. However, Shackleton (1980, p. 123) observed that “the job is more enjoyable and less of a strain to those whose preferences and thought processes match the demands of the job.” Moreover, Edgley (1 992) empha- sized that problems are best solved by groups composed of various personality types. Given the increasing demands placed on those in the accounting pro- fession, it may be best to attract a greater variety of personality types so as to form effective problem-solving teams.
REFERENCES
Amemiya, T. (1985). Advances in econornerrics. Cambridge, MA: Harvard University Press.
Breusch,
zyxwvutsrqponmlkjihgfedcbaZYXWVUTSRQPONMLKJIHGFEDCBA
T. S . , & Pagan, A. R. (1979). A simpletest for random coefficient variation. Econo-
metrica, 47, 1287-1 294.
Carland, J. W., & Carland, J. C. (1987). An inves- tigation into the distinctions between cognitive styles of business and nonbusiness students.
Journal of Education f o r Business 63(3), 68-7 1.
Cooper, S.
zyxwvutsrqponmlkjihgfedcbaZYXWVUTSRQPONMLKJIHGFEDCBA
E., &Miller, J. A. (1991). MBTI leam- ing style-teaching style discongruencies. Edu-cational and Psychological Measurement, 51,
Edgley, G . J . (1992). ’Qpe and temperament.
Association Management, October, 83-92. Jung, C. (1971). Psychological types. Princeton,
NJ: Princeton University Press.
Jacoby, P. F. (1981). Psychological types and career success in the accounting profession.
Research in Psychological Type, 4, 24-37.
Kiersey, D. (1998). Please understand me 11. Del Mar, CA: Prometheus Nemesis Books.
Keirsey, D., & Bates, M. (1984). Please under-
stand me. Del Mar, CA: Prometheus Nemesis Books.
Kreiser, L., McKeon, J. M. Jr., & Post, A. (1990). A personality profile of CPAs in public prac- tice. The Ohio CPA Journal, Winter, 29-34. Laribee, S. F. (1994). The psychological types of
college accounting students. Journal of Psycho- logical Type, 28, 37-42.
Myers, I. B., & McCauley, M. H. (1985). Manual:
A guide to the development and use of the Myers Briggs Type Indicator. Palo Alto, CA: Consulting Psychologists Press.
Nourayi, M. M., & Cherry, A. A. (1993). Account- ing students’ performance and peronality types. 699-706.
[image:8.612.50.383.72.392.2]Journal
zyxwvutsrqponmlkjihgfedcbaZYXWVUTSRQPONMLKJIHGFEDCBA
of Education f o r Business,zyxwvutsrqponmlkjihgfedcbaZYXWVUTSRQPONMLKJIHGFEDCBA
Oswick, C.,
zyxwvutsrqponmlkjihgfedcbaZYXWVUTSRQPONMLKJIHGFEDCBA
& Barber, P. (1998). Personality type and performance in an introductory levelaccounting course: A research note. Accounting
Education, 7(3), 249-254.
Ott, R. L., Mann, M. H., & Moores, C.
zyxwvutsrqponmlkjihgfedcbaZYXWVUTSRQPONMLKJIHGFEDCBA
T. (1990). An empirical investigation into the interactiveeffects of student personality traits and method of instruction (lecture or CAI) on student per- formance in elementary accounting. Journal of
Accounting Education, Spring, 17-35.
Shackleton, V. (1980). The accountant stereotype: 69(2),111-115.
Myth or reality. Accountancy, November,
Schloemer, P. G., & Schloemer, M.
zyxwvutsrqponmlkjihgfedcbaZYXWVUTSRQPONMLKJIHGFEDCBA
S . (1997). The personality types and preferences of CPAzyxwvutsrqponmlkjihgfedcbaZYXWVUTSRQPONMLKJIHGFEDCBA
firmprofessionals: An analysis of changes in the profession. Accounting Horizons, December, 24-39.
Taylor, L. W. (1997). An R2 criterion based on optimal predictors. Econometric Reviews, 1,
109-118.
Turner, J. L., Holmes, S. A., & Wiggins, C. E.
(1997). Factors associated with grades in Inter- mediate Accounting. Journal of Accounting 122-123.
Education. 15(2), 269-288.
White, H. (1980). A heteroskedastic-consistent
covariance matrix estimator and a direct test for heteroskedasticity. Econornetrica, 48, 817-838. Wolk, C., & Nikolai, L. A. (1997). Personality types of accounting students and faculty: Com- parisons and implications. Journal of Account-
ing Education I5(1), 1-17.
Wooten, T. C. (1998). Factoring influencing stu- dent learning in Introductory Accounting class- es: A comparison of traditional and nontradi- tional students. Issues in Accounting Education 13(2), 357-373.
![TABLE (4.17) [.ow 9 1.25 (25.7) [.OO01 0.234 2.987 (12.7) Dependent variable 77.75 56.03 (7.95) 42.64 (2.78) 4.189 [.0001 - (9.63) [ .OOO] -6.930 71.06 [ .OOO] -10.25 (29.0) 81.99 (29.2) [.001] -8.443 95.59 [ .OOO] [ .OOO] -0.186 (4.74) 1.904 ACCII Lp valu](https://thumb-ap.123doks.com/thumbv2/123dok/1205509.777142/7.612.54.563.78.541/table-dependent-variable-ooo-ooo-ooo-ooo-accii.webp)