T
HE
M
ACRO
D
YNAMICS AND
M
ICRO
E
XPERIENCE OF
I
NEQUALITY
JULIEFROUD, SUKHDEVJOHAL ANDKARELWILLIAMS*
T
his paper draws on Rowntree and Keynes to analyse inequality in present day capitalism, by focusing on two current drivers. The first is the link between house-hold income and the value of goods and services that a househouse-hold can afford to consume, which in turn feeds back into the kinds of jobs created; this is labelled the cheap goods/cheap jobs nexus. The second is the growth of funded savings from some households, which are directed on to stock markets from where these flows may have destabilising effects on corporate decisions and asset prices. In both cases, these drivers of inequality bring new elements of precariousness for individuals and their households, as well as the potential for instability at the macro level. The paper argues that, from a policy perspective, it is important to focus on the role of the household in mediating the consumption and sav-ing choices of individuals and as the unit that bears the risks that arise from labour and capital markets. The paper does not arrive at policy prescriptions, but instead aims to identify the importance of particular flows, links and institutions in late capitalism, as well as the many paradoxes around unequal societies, which need to be recognised before policy can be developed.The village of Hollywood was planned according to the notion People in these parts have of heaven. In these parts
They have come to the conclusion that God, Requiring a heaven and hell, didn’t need to Plan two establishments but
Just the one: heaven. It
Serves the unprosperous, unsuccessful as hell.
(Brecht, Hollywood Elegies)
The Houses in Hell, too, are not all ugly. But the fear of being thrown onto the street Wears down the inhabitants of the villas no less than The inhabitants of the shanty towns
(Brecht, On Thinking About Hell)
Our problem is to understand how inequalities are accelerated in present day capitalism and what the consequences of such acceleration might be. This investi-gation builds on the work of Edwardian radicals like Keynes and Rowntree as well as Fabian socialists like R. H. Tawney and Richard Titmuss who highlighted drivers such as the intergenerational transfer of wealth or the inheritance of social advantage which operated then (and now) to accelerate inequality. But the pres-ent day, neo-liberal form of capitalism provides a differpres-ent context in Britain and America so we must now understand new drivers and consequences of inequal-ity. This paper highlights two new drivers, the cheap jobs/cheap goods nexus and funded retirement, which both accelerate present day inequality. Their conse-quences are equally novel because these drivers move economy and society along a trajectory where inequalities reinforce inequalities at the cost of macro economic instability and increasing political difficulty about finding points of intervention and votes for resistance. This argument about drivers and conse-quences requires us to develop new forms of analysis, which relate micro experi-ence and macro dynamics. At individual and household level, wages from the labour market remain the primary direct cause of inequality but these effects are now complicated by a household effect, when several wage earners pool incomes, and by funded saving which defers inequality into old age. The result is not simply a regrettable social condition but an economic threat because cheap jobs and funded savings are the conditions of down-spiral and instability along our current economic and social trajectory. It is also a source of political confusion because, as Brecht realised, the experience of inequality is contradictory and con-fusing for those in the villas and the shanty towns.
illustrations from the UK, especially on household income by quintile, and leave the reader to consider whether and how other advanced capitalist countries are the same or different. The question of policy is taken up by other contributors to this special issue and our argument would be that policy should start by recognising that our households are not up to mediating the consequences of inequality.
1. FRAMEWORK: (AFTER) ROWNTREE ANDKEYNES
The classic problem of poverty was dropped in embarrassment 30 years ago as Townsend (1970) tried to redefine poverty for an increasingly affluent society in terms of social participation indicators such as childrens’ parties. Since then dif-ferent discourses of, and on, social exclusion have occupied the field. The time has come for reappraisal and debate about how we can now reuse, update and modify the work of figures like Rowntree who were treated with condescension by the last generation.
B. S. Rowntree’s (1901) first survey of household poverty in York may be antique but it is not obsolete because it focused very clearly on consumption resources and choices in a household context; and did so in ways that can be updated and extended in the early twenty-first century. Rowntree was always concerned with households, not individuals. His survey actually used the term familybut under-stood this as a household consumption unit (usually) under one roof, which could (to some extent) combine incomes, pool resources and save expenditure. With the rise in female workforce participation, this household perspective is more relevant today, while his concepts of primary and secondary poverty can be updated so that they are still resonant. Through the concept of primary poverty, Rowntree focused on those who did not have enough money to meet basic needs. Needs in 1901 were for housing and a basic diet, but in 2001 (with life expectancy of more than 70 years) these needs include the ability to forego consumption and save for an unwaged old age. Through the concept of secondary poverty Rowntree focused on the larger number whose resources were diverted from basic needs by other expenditure ‘either useful or wasteful’. In 1901 the diversion was onto drink, in 2001 the diversion could be onto petrol for the car journey to work if there is no public transport alternative.
redistributive effects of tax and benefits), 47% was claimed by Q5, while Q1 secured only 10%. Rowntree’s analysis was also limited because he was writing as a social analyst of consumption, before Keynes in the General Theory(1937) moved economics towards consideration of the roundabout economic conse-quences of consumption, savings and investment decisions. After Keynes, we need to consider the roundabout consequences of expenditure by richer and poor households and consider their decision to save as well as to consume.
These roundabout consequences of household decisions need to be analysed in a new way which cannot be read from what Keynes wrote or what the Keynesians subsequently said. Keynes himself always assumed (men’s) jobs at standard wages and conditions. Practically, in The Economic Consequences of Mr Churchillin the 1920s, or theoretically, in The General Theoryof the 1930s, his problem was the same: what would happen if one group of workers (like the miners) was singled out for wage cuts in a deflationary environment? By the 1940s and How to Pay for the War, the focus was the mechanical relation between aggre-gate demand and the number of jobs at standard wages and conditions; beyond full employment, the issue was about the diversion of demand into price infla-tion. These assumptions were carried over into the prescriptions and practice of Keynesianism, which used demand management to hold the economy near full employment and assumed that reflation could be used to curb unemployment. The practice of Keynesianism was then undermined by its perceived failure in the 1970s under changing conditions as the rise of international trade under-mined Keynesianism in any one country. More immediately important from our point of view, the assumption about standard jobs was weakened by the rise of part-time, lower paid (women’s) jobs plus the neo-liberal fix for unemployment in the UK, which was to price people back into work by encouraging the creation of low quality jobs with poor wages, conditions and little security.
From this broader point of view, 100 years after Povertyand more than 50 years after the General Theory, our interest in household resources and choices finds a broader object than Rowntree’s and a different object from Keynes’. Rowntree was interested in counting poor households after estimating what was basically necessary through costing a physical efficiency diet. We are interested in under-standing the interaction of all households with labour and capital markets so that we understand the dynamics of inequality and the experience of ordinary house-holds. We will do this by analysing two drivers of inequality, the cheap goods/cheap jobs nexus and retirement via funded pensions, where in each case we will consider macro dynamics and micro experience. After examining the drivers, we will synthesise the argument by presenting a kind of circular flow dia-gram whose differences from Keynesianism are as important as its similarities.
2. THE CHEAP JOBS/CHEAP GOODS NEXUS
and housing benefit) in a society where many are unwilling or unable to pay the necessary taxation, so that the logical next step for neo-liberals would be to dismantle social protection. This would help the Treasury but solve nothing because the removal of income support would aggravate the fundamental dynamic problem about economic trajectory when a deteriorating composition of employ-ment shapes the composition of demand and accelerates inequality.
This trajectory could be described as the opposite of flexible specialisation which, in the original Piore and Sabel (1984) statement, was largely about a virtuous circle in manufacturing districts. Demand was assumed to be unprob-lematic and re-skilled workers could find ever more opportunity building dif-ferentiated, up-market products. The only threat to the virtuous circle was pathological competition and sweating, which could be curbed by employer and worker associations on the supply side preventing a race to the bottom. Present day capitalism, however, is increasingly about the demand for services, with workers of varying skills and competences facing the general problem that sumption demand must be met at the level at which it is effective. Most con-sumers require a basic bundle of goods and services including housing, food, transport and leisure and their expenditure on such objects depends most obviously on income.
The complication is that consumption demand comes from households not individuals. The household plays a mediating role in shaping the composition of demand by pooling income and resources (from wages, benefits, investments and other sources) and jointly consuming some goods and services (like housing, fuel and food). Larger households may not only have access to more resources, but they also benefit from some economies of consumption through pooling (Ringen 1997). The individual’s consumption opportunities can therefore depend as much on the other members of the household as on his/her income. This mediation effect has been increasingly important in a society like the UK which has moved towards universalised labour force participation for women over 16, so women have became additional (albeit often lower paid) wage earners. Female partici-pation rates (expressed as the percentage of those of working age in employment) rose from 52% in 1971 to 69% by 2000, while male participation rates fell from 93% to 80% over the same period (Labour Force Survey, various years).
One of the important trends in the 1980s and 1990s in the UK has been an increasing inequality in the distribution of work between poor and work-rich households. The proportion of the working age population living in a job-less household doubled to 15% from the 1970s to the 1990s while, at the same time, there has been an increase in the number of households in which all mem-bers are in work (Gregg & Wadsworth 1996). As Taylor (2000) observes, this trend tends to be self-perpetuating in terms of patterns of household wealth ‘in that work-rich households almost exclusively live in their own homes and there-fore benefit from an appreciating asset. Work-poor households are increasingly marginalised into social housing, from which it is difficult to escape’ (p.93). The most significant category of work-poor households is perhaps those headed by lone parents. Single parents are less likely to be in work than other kinds of single adults heading households; furthermore, they are less likely to remain in
Table 1 UK household composition by income group, 1995–96
Q1 Q2 Q3 Q4 Q5 All
Number of people in the
household: 1.4 2.2 2.6 2.9 3.2 2.4
adults 1.2 1.6 1.9 2.1 2.3 1.8
children 0.2 0.6 0.7 0.8 0.9 0.6
Number of economically
active people per household 0.3 0.6 1.1 1.6 2.1 1.1 Household disposable
income (£) 4814 8584 13 259 19 285 34 888 16 166 of which cash benefits (£) 4200 5020 3410 2090 1530 3250 Disposable income per
economically active person
(before cash benefits) (£) 2047 5940 8953 10 747 15 885 11 742
Occupational grouping of head of household (% of quintile)
Employees: 19.0 29.3 56.4 74.4 79.3 51.6
professionals, employers
and managers 1.5 2.5 7.8 22.3 45.1 15.8
other non-manual 4.0 9.9 15.6 17.7 16.8 12.7
skilled manual 3.9 6.4 17.3 23.1 11.9 12.5
other manual 8.1 10.0 14.9 9.9 4.9 9.5
Self employed 2.7 6.5 12.3 11.6 12.7 9.2
Retired 50.6 45.9 19.5 7.8 5.2 25.8
Unoccupied 27.9 18.4 11.9 6.7 2.7 13.5
Source: Office for National Statistics (1995/96; 1998).
Notes: Q1 is the poorest quintile (measured using household income); Q5 is the richest. ‘Head of
work (if currently employed) or to enter work (if currently unemployed) (Taylor 2000: 94).
Much of the increasing inequality in the second half of the 1990s has been caused by rising incomes from work for those at the higher end of the scale. But it is important to note that Q4 and Q5 in the UK are the privileged many, not the super-rich. The number of the rich has increased so that in its ‘Survey of the New Rich’, The Economistexplains how ‘the world now has 7.2 million people with investable assets of at least $1m, up from 5.2 million in 1997’ (16 June 2001: 3). ‘High net worth individuals’ interest the likes of Merrill Lynch-Cap Gemini in their ‘World Wealth Report’ and provide new opportunities for companies like Volkswagen to sell luxury motor cars. But these individuals do not account for the 40% of households in Q4 or Q5. The analysis in Table 1 brings out the point that Q4 and Q5 include many people like us, when the median income in Q4 is relatively low at £19 285. If, as the previous section suggested, Q4 and Q5 are just as much part of the problem of inequality as Q1 and Q2, it is important to be clear that the majority of Q5 and all those in Q4 are not rich.
After making these points about the distribution of household income and employment, the argument now turns back to the link between cheap jobs and cheap goods/services. The difficulty is that the existence of this link cannot be demonstrated from the available official statistics though the linkage can be corroborated through analysis of household expenditure patterns. These patterns are considered below, before the argument goes on to consider some complex-ities about the relation between demand and employment, which again reinforce the importance of the household as a mediating institution.
The low absolute spending power of the bottom three quintiles implies that cheap goods and services must be favoured by these groups as they meet their basic needs, while Q4 and Q5 can consume a wider and more expensive range of products. Tables 2 and 3 present data on similarities and differences in con-sumption patterns in various household quintiles. Table 2 presents a breakdown of expenditure for Q1 to Q5 by category. In terms of broad categories, the pro-portions of household income spent on different objects are similar across the quintiles from top to bottom: housing, for example, takes 14 to 16%; household goods 7 to 8%; personal goods and services 3.5%. The major income-related difference is that poorer households spend a greater proportion of income on fuel, power and food while richer households spend more on mobility, leisure and lifestyle, and savings and investments.
This raises one of the interesting and controversial issues about household expenditure. To what extent do the comfortable households in Q4 and Q5 directly consume labour services provided by other households as substitutes for their own domestic labour? This ‘outsourcing’ of domestic activity can take place out-side the home through purchase of restaurant meals or laundry services, or inout-side the home with purchase of domestic cleaning, childcare or gardening.
Household expenditure patterns should disclose the extent and growth of domestic outsourcing. But much of this activity takes place within the informal economy and the evidence from some advanced economies does not confirm the popular image of a large and rapidly growing domestic service sector. Using
Table 2 UK share of household expenditure (%) by quintile, 1995–96
Expenditure category Q1 Q2 Q3 Q4 Q5
Necessities: 51.6 46.1 42.8 39.1 35.6
Housing (net of benefits) 14.3 15.3 15.9 14.5 14.2
Fuel and power 9.1 6.0 4.2 3.4 2.6
Food and non-alcoholic drinks 23.9 20.2 17.3 15.6 13.4
Clothing and footware 4.4 4.5 5.3 5.5 5.4
Personal Preference/Lifestyle: 6.7 6.2 6.1 5.1 4.5
Alcoholic drink 2.8 3.2 3.8 3.5 3.6
Tobacco 3.9 2.9 2.3 1.6 0.9
Lifestyle: 17.7 16.3 14.9 14.8 15.1
Household goods 8.3 8.1 7.1 7.3 6.6
Household services 5.6 4.9 4.5 4.0 4.9
Personal goods and services 3.8 3.3 3.4 3.5 3.7
Mobility/Lifestyle: 8.4 12.3 13.5 14.3 13.4
Motoring 6.3 10.2 11.8 12.7 11.3
Fares and other travel costs 2.1 2.1 1.7 1.6 2.0
Leisure/Lifestyle: 11.9 13.7 13.9 14.4 16.1
Leisure goods 3.9 4.2 4.4 4.2 4.2
Leisure services 7.4 8.9 8.9 9.4 11.2
Other 0.6 0.6 0.7 0.8 0.8
Savings and Investments: 3.5 5.4 8.8 12.2 15.3
Insurance 1.9 2.6 4.7 6.3 7.9
Mortgage capital etc 1.4 2.7 2.5 4.4 5.3
Savings 0.2 0.2 1.4 1.2 1.9
Loan repayments 0.0 0.0 0.2 0.3 0.2
Total 100.0 100.0 100.0 100.0 100.0
Source: Family Spending, ONS (1996); Economic Trends, ONS (1996).
Notes: Households are divided into quintile groups according to their income, where Q5 and Q1 are the
Australian expenditure data for 1993–4, Bittman et al.(1999: 255–60) find that take-aways for the poor or eating-out for the comfortably off are nearly universal, and that childcare, in the form of fees for pre-school care, is popular. But, only 13% of Australian households in the top income decile apparently purchase house cleaning. Bittman et al.(1999: 249) conclude that discussion of domestic out-sourcing ‘has run ahead of the facts’ and we might add that the relevant facts are not easily ascertained.
Whatever the level and trend of domestic outsourcing, the composition of demand for household services is shaped by the distribution of income and the
Table 3 UK levels of average annual household expenditure (£) by quintile, 1995–96
Expenditure category Q1 Q2 Q3 Q4 Q5
Necessities: 2493 3958 5670 7543 12 408
Housing (net of benefits) 689 1317 2108 2792 4968
Fuel and power 439 517 563 664 905
Food and non-alcoholic drinks 1152 1738 2290 3017 4658 Clothing and footwear 213 386 709 1069 1876
Personal Preference/Lifestyle: 321 530 803 982 1553
Alcoholic drink 132 277 500 668 1243
Tobacco 189 253 303 316 310
Lifestyle: 850 1398 1979 2858 5276
Household goods 398 694 942 1416 2306
Household services 270 418 591 775 1697
Personal goods and services 183 285 446 667 1274
Mobility/Lifestyle: 406 1058 1785 2765 4664
Motoring 302 878 1559 2453 3,953
Fares and other travel costs 103 180 227 313 711
Leisure/Lifestyle: 574 1176 1849 2786 5634
Leisure goods 189 362 577 818 1449
Leisure services 356 764 1184 1820 3908
Other 28 50 88 148 276
Savings and investments: 170 465 1171 2351 5353
Insurance 90 219 626 1218 2744
Mortgage capital etc. 69 228 338 844 1850
Savings 11 21 185 230 675
Loan repayments - 3 21 59 84
Total 4814 8584 13 259 19 285 34 888
Source: Family Spending, ONS (1996); Economic Trends, ONS (1996).
Notes: Households are divided into quintile groups according to their income, where Q5 and Q1 are the
fact that the vast majority of households in Q4 and 5 are comfortably off but not rich. Q4 and 5 households that want domestic services must stretch their income so they can also afford aspirational expenditure on holidays and leisure or on branded clothes and household goods. Such households will not pay generously for domestic services, which implies low wage rates and, given that much of this is in the informal economy, avoidance of social costs such as national insurance contributions, pensions or holiday pay. Many households behave in much the same way as corporate employers who have used part-time workers to reduce overall labour costs. Some Q4 or Q5 households will be good employers and domestic work may offer desirable flexibility for some workers. However, the growth of unregulated domestic outsourcing with the current income distribution is likely to reflect, rather than reduce, household inequality.
It is important to avoid scape-goating Q4 and Q5 or caricaturing the service economy we all sustain. Even those in Q1 and Q2 buy take-away food, so that low-wage service jobs benefit poor and rich households alike. And even in per-sonal services, some jobs in expensive restaurants or perper-sonal therapy provide good levels of wages and benefits. It is equally important to remember the com-plication that household composition mediates the effects of low pay on con-sumption patterns. A poorly paid individual can enjoy more expensive goods and services than their individual income would allow by pooling resources and shar-ing consumption with another wage earner. Thus high rates of workforce par-ticipation in the UK partly compensate for (and effectively subsidise) the proliferation of low wage jobs in the corporate and public sectors and, in doing so, complicate the linkage between cheap jobs and cheap goods. But, equally, those with one poorly paid job or no employment must tailor their consumption to fit their limited resources and the number of Q1 to Q3 households in this group is hardly trivial.
When all the qualifications have been registered, the basic point remains that, in a country like the UK, inequality accelerates inequality. The composition of household demand shapes the composition of employment when demand meets supply in the labour market so as to create jobs with poor remuneration and benefit profiles. In most advanced economies there is no shortage of individuals from Q2 and Q3 households who can and must earn what they can in a labour market defined for them by the erosion of traditional well paid jobs (for men). UK manufacturing employment is down from 7 to 4 million over the past 30 years and all of the growth in employment in the major advanced economies has been in services. As we argued in Social Settlement, Household Lottery(Froud et al. 1997), whether in firms or for households, service jobs bring lower remun-eration on average, not least because of lower social charges arising from the spread of part-time and contingent work.
of the National Health Service and state schools, without increasing taxation, is the aim of both the Labour government and the Conservative opposition in the UK). The micro experience is also one of insecurity for the prosperous and suc-cessful because job tenure is uncertain and households can re-form. Households (or individuals who form new households) can move up or down through the quintiles as a result of gaining or losing a job, the addition of a new household member or because of death, divorce or other causes of household breakdown. Thus households often move between quintiles, as a result of changes in income or household composition, although the extent of movement tends to be fairly limited. Jenkins (2000) reports on the first six years’ results from the British Household Panel Survey, whose findings provide a new, dynamic view of inequal-ity. On the official UK measure, ‘low income’ households are those with less than half the average income. By this standard, Jenkins finds that two-thirds of house-holds were never in the low income bracket at the annual interview dates in each of the six years, 1991–96. At the other end of the scale, 2% were classed as low income in every year, while 32% had low income at least once and 19% at least twice during the six years. A significant proportion of households therefore experiences low incomes intermittently, with lone parents the most likely group to be on low incomes for a sustained period of three years (Jenkins 2000: 115–22). Many households which experience poverty move up the income scale though ‘most year-to-year mobility is short range’ (Jenkins 2000: 114) with re-entry fairly common and exit more difficult the longer the time spent in poverty.
The evidence is thus such that it is difficult to discuss the role of the house-hold in pooling resources, mediating risk and sharing consumption without intro-ducing the idea of trajectory and life course. As O’Donnell and Hancock (2000) argue, ‘whereas postwar life courses tended to be few, predictable and linear, the emerging life course appears to comprise transitions that are multiple, random and recurring’ (p.14). Certainly, aggregate statistics disguise not only household differences in experience, but also their life courses. One of the defining charac-teristics of current household experience is precariousness of income and expendi-ture possibilities.
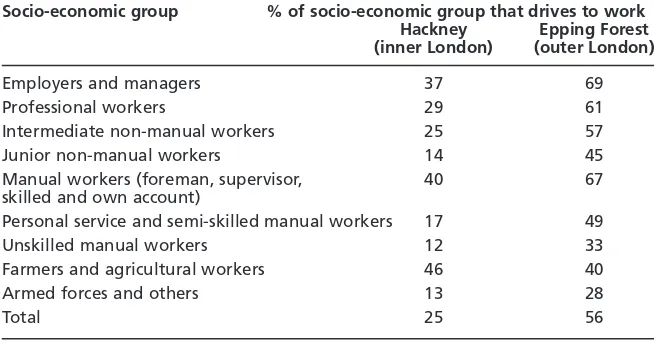
Our research in two London areas looks at the sacrifices some low income, working households make to run cars.2 This is especially a problem of outer
London, as Table 4 shows by comparing two areas. In the outer area, Epping, car ownership rates are much higher than in Hackney in inner London, which has better public transport. Table 5 confirms that households are using their cars to travel to work. In Epping, the car is more commonly used by all socio-economic groups (except farmers and agricultural workers) to travel to work than it is in Hackney. And if we take London as a whole, then the average car mileage of poorer people is almost 3000 per year, which is an understatement given that density of car use is much lower for such groups. Seventy-three per cent of all
Table 4 Car ownership of working households (% of households)
Hackney Epping Forest
(inner London) (outer London)
No car 40 5
1 car 44 36
2 cars 15 40
3 or more cars 2 18
Source:Data derived from 1991 Census County Report (Inner London and Essex).
Note:Hackney is an inner London borough; Epping is in outer London.
Table 5 Household car usage in inner and outer London
Socio-economic group % of socio-economic group that drives to work Hackney Epping Forest (inner London) (outer London)
Employers and managers 37 69
Professional workers 29 61
Intermediate non-manual workers 25 57
Junior non-manual workers 14 45
Manual workers (foreman, supervisor, 40 67 skilled and own account)
Personal service and semi-skilled manual workers 17 49
Unskilled manual workers 12 33
Farmers and agricultural workers 46 40
Armed forces and others 13 28
Total 25 56
Source:Derived from 1991 Census County Report (Inner London and Essex).
miles travelled by Q1 individuals are by car, not much less than the 85% of the richest individuals.
Poor households spend a large part of a limited income on the car because old cars may be cheap to buy, but all cars are expensive to run. As Table 2 showed, for Q1 households 6.3% of all expenditure is on motoring, so that the one-third of Q1 who actually run cars spend a stunning 20% of their small incomes on motoring. By contrast in Q5 households, 11.3% of all expenditure is on motor-ing, and 94% of Q5 households run at least one and quite often two cars per household. Q1, Q2 and even Q3 can only run a car at significant sacrifice. Our interviewees from an estate in the outer London district of Epping Forest confirmed this, when asked about what they had to forfeit to afford the costs of motoring:
‘cars are getting dearer to run. I’m cutting things out here and there to keep the car on the road’
‘I would spend the money saved on a car on the kids––they’re the next most expen-sive thing’
‘I would spend the money saved on clothes or holidays’
‘I don’t eat so much as before. I don’t have luxuries because of the driving costs . . . I would spend more money on food if I had no car’
‘I would spend the money saved on beer’.
We have come all the way from Rowntree’s poor, who could not afford a decent meal because of drink, to the motoring poor who cannot afford a decent drink because of their petrol costs. It is also worth noting that these households make their sacrifice for old cars, which do not offer reliable transport or predictable expense, so that the car is part of an insecure and precarious lifestyle because the job cannot be held without a car and vice versa.
After analysing the insecurities of working households in a cheap jobs/cheap goods society, we turn now to consider retirement, the next stage in the house-hold’s life course, where again inequality breeds inequality under systems of funded retirement which have consequences for the waged as much as the unwaged.
3. RETIREMENT VIA FUNDED PENSIONS
those who are earning paying the pensions of those who are already retired. By contrast, the dominant form of UK and USA retirement provision, via second tier arrangements, involves occupational and/or private schemes that build up individual funds for each contributor. US and UK funded pension arrangements are also increasingly characterised by defined contribution arrangements where the employer takes no responsibility for guaranteeing the value of the pension and individuals accumulate their own fund whose value at retirement will deter-mine the value of the pension.
The social coverage and economic performance of funded provision has now become an important economic and social issue in the UK, USA and other countries that have followed their path. This section discusses how households’ funded provision for retirement relates to income: when only some households have sufficient income to allow them to build up a fund, funded pensions have become an important accelerator of inequality. There are also important indirect macro effects because the pension funds of fortunate higher income households are invested in a coupon pool of securities, often in company shares, where investment expectations and decisions have economic effects on a much larger group of households. The argument of this section is that reliance on funded pensions directly accelerates household inequality and indirectly adds a variety of macro economic insecurities.
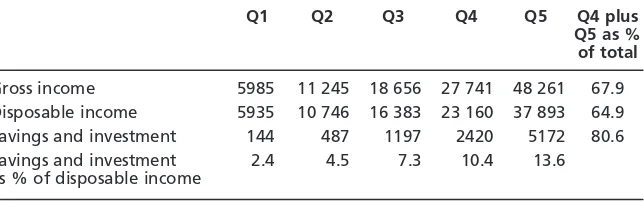
The first, most important fact about funded retirement is that, in the US and UK, only the fortunate 40% of households in Q4 and Q5 have the discretionary income to forego current consumption and make long term savings sufficient to provide individuals or households with financial security in old age. Table 6 shows that, in the UK, households in Q4 and Q5 allocate a significant portion of their expenditure to savings and investments (10.4% and 13.6% respectively). By way of contrast, Q1 to Q3 start from much lower absolute income levels and are unable to raise the percentage of income saved above 8%. Table 6 shows that Q4 and
Table 6 Distribution of UK household income and savings (£ per annum) 1996/7, by quintile
Q1 Q2 Q3 Q4 Q5 Q4 plus
Q5 as % of total
Gross income 5985 11 245 18 656 27 741 48 261 67.9 Disposable income 5935 10 746 16 383 23 160 37 893 64.9 Savings and investment 144 487 1197 2420 5172 80.6 Savings and investment 2.4 4.5 7.3 10.4 13.6 as % of disposable income
Source: Family Spending, ONS (1996–7).
Notes: Gross income is income before tax and includes wages and salaries, self-employment income,
Q5, which account for 65% of disposable income in the UK, are responsible for 80% of total household savings in the UK.
After making various assumptions, it is possible to calculate how much must be saved so as to generate a satisfactory income in old age. Disney et al. (2001) estimate that, assuming real earnings growth of 2% and a real return on savings of 5% per annum, an individual who continuously saved 10% of their income over a 40 year working life could generate an annual pension equal to just over 30% of their final earnings over 25 years of retirement (p.85). A saving rate of 15% of income would be necessary to allow for short periods of interruption to work and adding in the extra income from a basic state pension and lower estimated living costs in retirement, would together provide a more comfortable replacement rate of 50–60 % of final earnings. These calculations about savings rates are consistent with practice in many defined-benefit occupational schemes, where contributions from employer and employee generally fall between 10 and 15% and generate a fairly comfortable retirement for those with long service (Disney et al. 2001: 85–6).
Lower income households should save a higher percentage of income because a steady 10% contribution only generates a living pension if absolute household income is reasonably high. The typical income of a Q2 working household is so low (as Table 1 showed) that even 50 or 60% replacement would not provide a very generous pension. And steady contribution is difficult for those who have no surplus income after immediate basic living costs. When lower income house-holds inevitably do save a lower percentage of their modest incomes, they fail to generate a satisfactory replacement for income in old age. The acceleration of inequality then becomes part of the logic of contribution because only Q4 and
Table 7 Sources of income (£ per year) for UK retired households, 1994–95
Q1 Q2 Q3 Q4 Q5 Q4 plus
Q5 as % of total
Original income 736 1391 1980 4647 15 139 82.8
of which:
Occupational pension 385 928 1388 3340 9647 82.8 Investment income 304 328 408 1015 4311 83.7
Other 47 135 184 292 1181 80.1
Benefits:
State retirement pension 3476 3807 3788 3762 3647 Non-contributory benefits 586 1001 1443 1460 1181
Total average income per
household 4798 6199 7211 9869 19 967
Source: Family Expenditure Survey, Economic Trends, Office for National Statistics.
Note: Retired households are arranged in order of household income, with Q1 the lowest and Q5 the
Q5 households can effectively participate in self-provision of funded retirement income.
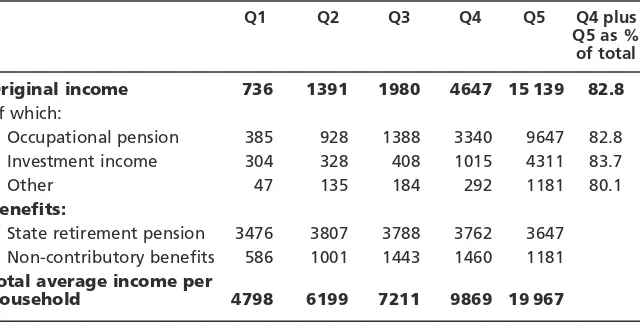
Thus current income inequalities are replicated later in the life cycle of house-holds when retired. Table 7 demonstrates this point by considering the incomes of currently retired households in the UK. The richest 20% of retired house-holds in Q5 have income levels boosted by occupational pensions and invest-ment income, so that Q5 income is five times that in Q1 retired households, whose members live on a meagre state pension which has been uprated in line with ris-ing prices not incomes. The poorest retired households in Table 7 in turn become the bottom fifth of all households. Table 1 showed that in the UK Q1 is dis-proportionately a group of those who are subsisting on state benefits. Half of Q1 and 45% of Q2 heads of households are retired (with the remainder mainly unemployed) so that most of Q1 and 60% of Q2 household income comes from state benefits.
The increasing dependence on funded pensions, with savings routed through the coupon pool, creates an immediate social problem. In the UK and US, where the state encourages dependence on (and indeed provides tax incentives for) funded provision for old age, around a half of households are excluded because their voluntary savings will never be sufficient to produce an adequate income in old age. This acceleration of inequality creates social problems about poverty in old age, as the poorest retired households need additional top-up benefits. It also creates new economic problems because funded provision for retirement directs huge flows of household savings into the coupon pool of securities with all kinds of macro and meso economic consequences.
In the UK, the annual flow of funds into long term funded savings, which includes pensions as well as life assurance policies, equals the value of all pro-ductive investment made by industrial and commercial companies at around 8.5% of GDP. In the US, this flow is proportionately larger and is equivalent to 13% of GDP, or around 160% of corporate productive investment.3 Transitional
economies are being encouraged to establish funded pensions because these will increase the flow of household savings into domestic capital markets to stimu-late development. But, in countries like the UK and US, the size of existing flows raises a rather different series of questions about the economic consequences and risks of the huge existing flows into stock markets whose value is considerably in excess of national GDP.
be changes in corporate behaviour when the professional managers of household savings seek higher returns.
In the UK and US, we already have some experience of boom and bust in share prices. Through the decade of the 1990s, in the UK and US, share prices went up by 10–20% per annum. This rise in prices was the main source of gains for investors and fund managers so that 80% of the stock market gains of the decade came from stock price appreciation, not distributed dividends. At the end of this period, stocks were trading at average price earnings (p/e) ratios of 24:1 in the UK (and 29:1 in the US), well above their normal range of 5 to 15 times. This ‘irrational exuberance’ (Shiller 2000) led to increasing unease about the possi-bility of continued future gains when the rising p/e ratio indicated a disconnect between market prices and the corporate sector’s capacity to generate earnings, especially in the tech sector where new economy hysteria had bid up share prices. A stock market crash in the US tech sector in April 2000 spread to the main markets, where an unsteady decline in prices has continued as the economy moved into a tech-led downturn in 2001 amidst profit warnings and a switch-off of tele-coms investment.
Recent experience shows that falling share prices have all kinds of macro con-sequences, which depend on the nature of the correction and local circumstances. In the event of sustained collapse in share prices, as in Japan, there will be all kinds of questions about the solvency of banks and insurance companies that hold shares on their balance sheets. If shares are held directly by households, as in the US, the wealth effects are likely to encourage household consumption on the upswing and depress it on the downswing. In the UK case, these consumption effects are less immediate because most households do not hold shares directly but all households must live with the consequences of fund under-performance as share prices fall. In the UK, equity yields have fallen from 19% (13 to 15% in real terms) through the 1980s and 1990s to a current estimated long term return on equities of no more than 8% (before tax on dividends and management charges) (Financial Times21–22 July 2001).
Falling equity returns highlight the point that saving through the stock market for long term retirement in the UK and US is increasingly a system that passes risks to the individual saver and his/her household. UK occupational pen-sion schemes in the public sector and blue chip corporations were traditionally defined benefit schemes where those with a full set of contributions were guaranteed a fixed percentage of final salary, with the employer making good any deficiency arising from fund under-performance. More recently, we have growth of private pensions, which operate on a money purchase or defined contribution basis, and many employers are closing defined benefit (final salary) schemes to new workers as they attempt to renounce the social obligations they once honoured (Cutler & Waine 2001).
destabilising flow of funds into the market. Under-performance in the main stock market encourages funds to seek out different kinds of coupons that may offer higher rewards. The problem is compounded in the UK by the Treasury policy of paying off national debt and thus reducing the amount of government bonds available. The shift into alternative investments has so far been more prevalent in the US than in the UK, where the regulatory regime has inhibited this devel-opment. In the US, the tech stock crash has not stopped a large flow of funds into venture capital at an annual rate of $100 billion and it has encouraged a renais-sance of hedge funds that manage $400 billion and are engaged in shorting a falling market (Business Week). The possibility of higher rates on return on such investments is accompanied by higher risks that may or may not be appropriate for pension funds aiming to provide security in old age.
Meanwhile, when declining share prices undermine returns, the market inten-sifies its pressure for shareholder value from increased earnings. However, the empirics suggest that these pressures from households and their fund managers meet the obstacle of activity-based limits on return on capital employed (ROCE). Even in the good years of the 1990s, most large UK and US corporations struggled to meet the 15% ROCE expectations of the capital market (Froud et al. 2000). The firms that performed best in terms of ROCE generally operate in activities like media, telecoms or pharmaceuticals where they have the advan-tages of immateriality, property rights, market power or rapid growth. Though, as telecoms shows, when demand conditions worsen, even high performing sectors experience difficulties in sustaining profitability and returns.
A corporate sector which struggles to meet the expectations of the market must increasingly rely on widespread restructuring, cheap tricks at the expense of labour and suppliers (who represent the firm’s major costs) and a good deal of oppor-tunist financial engineering to increase shareholder value in the current year. The end results are complicated but already we see what the French call ‘stock market redundancies’ in firms whose problem is not chronic losses but simply not enough profit. Lazonick and O’Sullivan’s (2000) descriptor, ‘downsize and distribute’, may not have been generally adopted in the 1990s, but staff redun-dancies have become more or less obligatory for management announcing a fall in profits or even an increase which is below market expectations. Thus funded provision for retirement acts through the labour market to increase the risks of redundancy for all households, including those households who make no provi-sion for the future through the stock market.
disinvention of retirement because Q2 individuals must literally work until they drop and rely on employers to recreate lighter and less responsible jobs for the old. A different set of problems confront those Q3 and Q4 households in the middle income groups. These households are making some provision, often at the expense of current consumption, but their future is precarious because their provision may be inadequate if the stock market performs poorly, annuity rates fall or working lives are shortened.
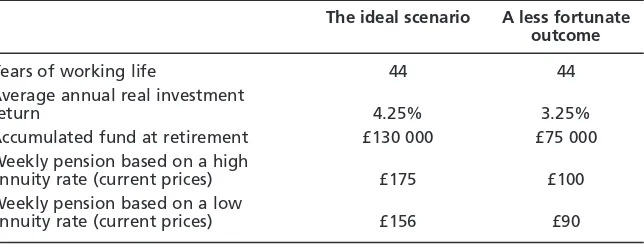
Table 8 illustrates the uncertainties inherent in private pension provision, where individuals bear all the risks associated with labour and capital market uncertainty and imponderables about the number of working years when contributions can be made, the accumulating value of the fund and the annuity rate it buys at the point of retirement. Our illustration shows that, assuming a long working life of 44 years where weekly contribution levels of £9 (in real terms) are maintained throughout, the capital market could deliver a retirement income somewhere between £90 and £175 per week. For the individual or household that controls none of the imponderables, the process of saving for retirement is rather like a lottery where every ticket wins a prize but only some prizes are worth having. The metaphor of lottery reminds us that the end result is not a systematic accel-eration of income inequality because this effect is crosscut with genaccel-erational and gender effects, so that some households and individuals do much better than others that started from the same point. The high returns on equity through the late 1980s and 1990s, followed by low returns in the 2000s (as well as falling annuity rates) also imply generational effects, where accidents of timing mean that some households’ funds have performed well while others (encouraged by advertisements about the attractive pastperformance of investments) will fail to deliver. Women also face particular problems in a society where funded invest-ment is expected to provide security because many (including divorcees and widows) are still covered indirectly by the contributions and funds of men who were continuously employed at higher wages.
On reflection, Brecht was wrong insofar as he implied constant pressure bear-ing down on everybody all the time because the lottery has many winners as well
Table 8 An illustration of the variability of private pension income from a weekly £9 contribution
The ideal scenario A less fortunate outcome
Years of working life 44 44
Average annual real investment
return 4.25% 3.25%
Accumulated fund at retirement £130 000 £75 000 Weekly pension based on a high
annuity rate (current prices) £175 £100
Weekly pension based on a low
annuity rate (current prices) £156 £90
as more losers. All those in employment as members of households in the top 40% of the income distribution have benefited hugely from the 10–20% per annum share price rises in the bull market of the 1990s, although of course, there is an increased labour market risk of stock market redundancy in mid-career. British companies have laid off many staff in the last 15 years, but some of those were long term employees who were bought out with enhanced pension contri-butions and others who remained have well paid jobs and a few have stock options. As for the losers, in a society that pushes funded investment, they will often only realise their fate as individuals when, towards the end of their employment career, they discover that their fund will only buy a small annuity, or when the private pension company writes to explain that the fund has under-performed, requir-ing additional contributions in later years to make up the deficit. Our popular politics is partly defined by these anomalies which diffuse euphoria and postpone glum realisation as many ticket holders still hope to win in what is a kind of house-hold lottery.
4. IMPLICATIONS: WHAT DOES IT ALL MEAN AND WHAT IS TO
BE DONE?
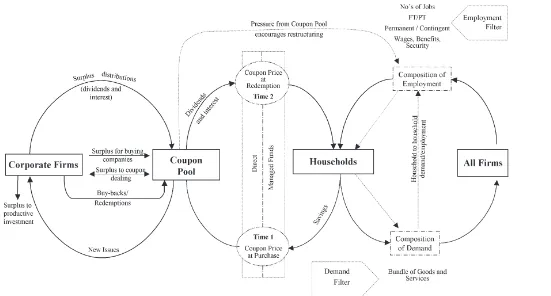
It is difficult to move directly from the preceding intellectual analysis to politics and policy prescription. The complex macro dynamics and divergent micro experiences not only create winners as well as losers, they obscure what is going on. As a first step towards politics, this section synthesises our argument so far, providing a framework for thinking about the new conditions of instability and insecurity in stock market capitalism of the UK or US type. It then suggests that the object of policy and point of intervention should be households, not families. We can start by bringing together the different macro arguments in Fig. 1. This provides a simplified view of the interactions between firms and households which we have analysed: labour market and consumption demand relations are on the right hand side, with savings and investment relations on the left hand side. This captures many important macro flows: in the UK case, for example, 84% of national income goes through the household, around 60% of final demand is consumption demand from households; and the flow from households into long term savings (via the coupon pool) is equivalent to 8% of GDP. At the same time, because it recalls Keynesian diagrams of circular flow, it is important to be clear about what the diagram is not. It is not a representation or description of any existing economy; most obviously, it ignores complications about foreign trade and the role of government in the national economy. Equally, the diagram is not a predictive model, not least because it excludes all the dynamics around tech-nical and social change.
compara-T
HE
J
OURNAL
OF
I
NDUSTRIAL
R
ELA
TIONS
March
2002
bility increases). Significantly, when the New Labour government introduced a minimum wage in the UK, it was the state whose payroll bill was most affected by the new requirements. Thirdly, technical change is not an exogenous variable which removes constraints on growth: the tech stock crash shows how new tech-nologies like the internet are now subordinated to finance in a way which increases the risk of asset price bubbles (Feng et al.2001). Technology does not rescue us but only implicates us further in the current mess.
When these points have been made, the purpose of the diagram becomes clear. It is not an inadequate representation of the macro economy but rather a stylised device for highlighting patterns of household interaction with labour and capital markets, so that we can begin to understand the dynamics of inequality, where cheap jobs and funded savings are the conditions of down spiral and insta-bility along our current economic and social trajectory. These should be regarded as destabilising conditions for the new millennium because they are sufficient to guarantee incoherence and contradiction in present day forms of capitalism. In cases like the UK, they are likely to generate boom and bust, not stable pros-perity, and will certainly generate hugely different employment and retirement experiences for individuals and households who take part in the lottery. These destabilising conditions contrast with the stabilising conditions active in the stereotyped Fordism of the long boom in the 1950s and 1960s, when the employ-ment relation plus state policies of Keynesianism and Beveridgean welfare were supposedly enough to guarantee economic stability and a social settlement with a decent floor.
The diagram focuses attention on the permanent conditions of incoherence and insecurity, and encourages an intellectual re-problematisation that recognises the messy and unresolved nature of present day capitalism. But it does not give us politics, leave alone a basis for policy intervention. These next steps depend on a break with the futile politics of building strong families on the doubtful assumption that families of some prescribed form are the necessary building blocks of civil society and economy in all forms of capitalism. Instead, we must recog-nise that our distinctive present day form of capitalism has a specific problem about weak households because many households are inevitably unable to fulfil their default role of mediating the failure and precariousness created by current conditions of incoherence and insecurity. It should also be noted that further complexity arises when household members have different, related identities as workers, consumers and investors.
The social commentary of the right (and third way social democracy) focuses on the family and tends to offer a prescriptive account. The UK Prime Minister, Tony Blair, has a website containing a series of ‘Downing Street Facts’, which includes the following claim about ‘Family Life’:
Strong families are essential to bringing up children and to creating a decent soci-ety. Families are where children learn to be responsible, to know right from wrong. But for too long families have been neglected and have not received the support they need. The Government will redress this not just with financial help but through modern public services, help in balancing work and family responsibilities and support for marriage and stable families
In Blair’s reactionary and romantic discourse, where the family is the key insti-tution that underpins social order, the aim is to (re)build stronger families which inculcate morality, and the enemies are social problem groups who reject nuclear family responsibilities and labour market duties.
This kind of ideology is futile because (for better or for worse) the family is now a theatre where changes in social mores and labour market norms are enacted. Men and women in the UK are both marrying some 5 years later on average in 1999 compared with 1971: the average age of first marriage was 22 for women and 24 for men in 1971 and is now 27 and 29 respectively (Office for National Statistics 2000). Just as some women are marrying later, others have children with-out resident partners. Couples are also divorcing more often, just as surviving widows and widowers live alone. The family is, therefore, increasingly fragile and atomistic. Most obviously, 20% of households with dependent children are now headed by single parents in the UK.
New Labour’s (ineffectual) political response to these shifts is to try and close the gap between the family that is and the family that ought to be, by various forms of state compulsion and persuasion. So in the UK, for example, we have seen the introduction of the Child Support Agency which obliges absent fathers to pay maintenance, while unemployment benefits have been redefined as a goad to participation not a right to maintenance. As for funded saving, this should be encouraged so that every individual has his or her own fund. Thus, long term saving via the coupon pool is being encouraged in lower income groups by the creation of ‘stakeholder’ pensions for those who currently do not make (adequate) provisions. More surreally, the government plans baby bonds so that all the newly born have capital.
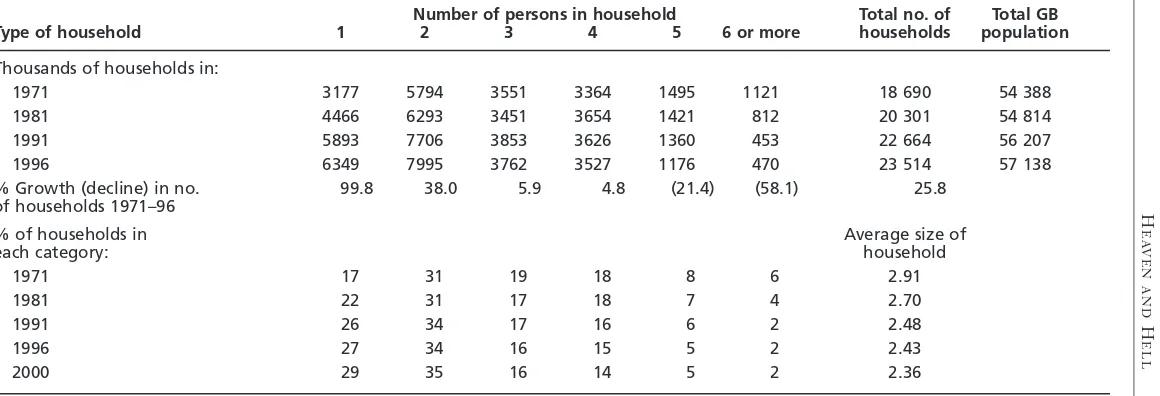
An alternative politics should start from households, not families. Householdis a neutral descriptor that recognises joint residence and is currently defined by UK official statisticians as shared living space and/or meals that lead to the pool-ing of some or all of income. This category allows us to recognise the large social changes of the past thirty years. Table 9 shows that the total number of British households rose by a quarter between 1971 and 1996, with the growth of one person households making the largest contribution to this. It is hard to take any general position on these changes in household size and composition because they have so many diverse determinants from individual choice to life expectancy. But the problem for policy is that many different household types (including some with two working parents) are increasingly not up to the task of mediating uncer-tainty and precariousness under current conditions of instability. If the problem is not manifest, that is because the consequences of downgraded social welfare and deregulated labour markets were disguised by the economic upswing and the decade long bull market of the 1990s.
H
EA
VEN
AND
H
ELL
85
Number of persons in household Total no. of Total GB
Type of household 1 2 3 4 5 6 or more households population
Thousands of households in:
1971 3177 5794 3551 3364 1495 1121 18 690 54 388
1981 4466 6293 3451 3654 1421 812 20 301 54 814
1991 5893 7706 3853 3626 1360 453 22 664 56 207
1996 6349 7995 3762 3527 1176 470 23 514 57 138
% Growth (decline) in no. 99.8 38.0 5.9 4.8 (21.4) (58.1) 25.8
of households 1971–96
% of households in Average size of
each category: household
1971 17 31 19 18 8 6 2.91
1981 22 31 17 18 7 4 2.70
1991 26 34 17 16 6 2 2.48
1996 27 34 16 15 5 2 2.43
2000 29 35 16 14 5 2 2.36
workers will also have implications for the cost of the goods and services they produce. Some individuals are also not only paid workers but unpaid carers for children and the elderly, filling a gap not met by adequate state provision. At the same time, a growing number of workers are also investors in corporations so that their individual security in the long term depends on the ability of firms to produce an adequate rate of return on capital and maintain the confidence of the capital market.
When identities are so mixed and shared, any policy intervention in house-hold relations with labour or capital markets will have different consequences for various household types and differently placed individuals. If the problem is complex and solutions are not easy, Buchanan and Pocock (2002) make an impor-tant and encouraging contribution in suggesting policies which engage with the complexities and provide a basis for starting a policy debate in the Australian con-text. More broadly, we should not despair about curbing inequality and pre-cariousness because we have a history of challenge and response on our side. In the 1880s Britain was challenged by the consequences of an unregulated labour market and a poor law designed to deter individual applications for relief and enforce family obligations (Jones 1971; Harris 1972). Such increasing social ten-sion around middle class guilt and fear provoked new forms of socio-economic analysis and innovations in social policy from Edwardian radicals like Beveridge, Rowntree and Keynes in the 1900s. One hundred years later, can we hope to put together an effective response more quickly?
NOTES
1. The research on the motoring poor in London is reported in more depth in Froud et al.(2002). Interviews on two estates, one in inner London (Hackney) and one in outer London (Epping Forest) were carried out by Adam Leaver of the University of Manchester in the summer of 2000.
2. The size of domestic pension and other funds compared with GDP has risen in most advanced capitalist countries over the last 10 years, but there is still a distinction between countries like the UK and US where household funded savings were equal to 199% and 174% of GDP respectively in 1998, and others such as Germany and Japan where such savings were equiv-alent to 71% and 76% of national GDP respectively (Davis & Steil 2001: 8). According to the OECD, the total value of financial assets for Australian institutional investors was equal to 115% of GDP in 1998, up from 49% of GDP in 1990. Around half of this is accounted for by pension funds (OECD 2000: Tables S.6–S.10).
REFERENCES
Bittman M, Matheson G, Meagher G (1999) The changing boundary between home and market: Australian trends in outsourcing domestic labour. Work, Employment and Society13, 249–73. Boyer R (2000) Is a finance-led growth regime a viable alternative to Fordism? A preliminary
analysis. Economy and Society29, 111–145.
Brenner R (2001) The world economy at the turn of the millennium toward boom or crisis? Review of International Political Economy 8, 6–44.
Buchanan J, Pocock B (2002) Responding to inequality today: Eleven theses concerning the redesign of policies and agents for reform. Australian Journal of Industrial Relations44(1), 108–135. Cutler T, Waine B (2001) Social insecurity and the retreat from social democracy: occupational
welfare in the long boom and financialization. Review of International Political Economy 8, 96–118. Davis EP, Steil B (2001) Institutional Investors.Cambridge, MA: MIT Press.
Disney R, Emmerson C, Wakefield M (2001) Pension reform and saving in Britain. Oxford Review of Economic Policy 17, 70–94.
Feng H, Froud J, Haslam C, Johal S, Williams K (2001) A new business model? The capital market and the new economy. Economy and Society 30, 467–503.
Froud J, Haslam C, Johal S, Williams J, Williams K (1997) From social settlement to household lottery. Economy and Society 26, 340–72.
Froud J, Haslam C, Johal S, Williams K (2000) Shareholder value and financialisation: consul-tancy promises, management moves. Economy and Society29, 80–110.
Froud J, Johal S, Leaver A, Williams K (2002, in press) The resources and choices of the motor-ing poor. Competition and Change.
Gregg P, Wadsworth J (1996) More work in fewer households. In: Hills J, ed., Income and Wealth: New Inequalities. Cambridge: Cambridge University Press.
Harris J (1972) Unemployment Politics: A Study in English Social Policy 1886–1914.Oxford: Clarendon Press.
House of Commons (1999) Welfare Reform. The Pensions Act 1999.London: The Stationery Office. Jenkins SP (2000) Dynamics of household incomes. In: Berthoud R, Gershuny J, eds, Seven Years in the Lives of British Families. Evidence on the Dynamics of Social Change from the British Household Panel Survey.Bristol: Policy Press.
Jones GS (1971) Outcast London. A Study in the Relationship Between Classes in Victorian Britain.Oxford: Clarendon Press.
Keynes JM (1925) The Economic Consequences of Mr Churchill.London: Hogarth Press. Keynes JM (1936) The General Theory of Employment, Interest and Money.London: Macmillan. Keynes JM (1937) The General Theory.London: Macmillan.
Keynes JM (1940) How to Pay for the War.London: Macmillan.
Lazonick W, O’Sullivan M (2000) Maximising shareholder value: a new ideology for corporate governance. Economy and Society29, 13–35.
O’Donnell A, Hancock L (2000) Introduction: the challenge of reshaping the social settlement.
Growth48, 7–18. Melbourne: Committee for Economic Development of Australia. OECD (2000) Institutional Investors Yearbook 2000.Paris: OECD.
ONS (Office for National Statistics) (1996) Living in Britain. London: HMSO. ONS (Office for National Statistics) (2000) Living in Britain. London: HMSO.
OPCS (Office for Population, Censuses and Surveys) (1985) General Household Survey.London: HMSO.
Piore MJ, Sabel C (1984) The Second Industrial Divide: Possibilities for Prosperity. New York: Basic Books.
Ringen S (1997) Citizens, Families and Reform.Oxford: Clarendon Press. Rowntree BS (1901) Poverty. A Study of Town Life.London: Macmillan. Shiller R (2000) Irrational Exuberance. Princeton NJ: Princeton University Press.
Taylor M (2000) Work, non-work and job mobility. In: Berthoud R, Gershuny J, eds, Seven Years in the Lives of British Families. Evidence on the Dynamics of Social Change from the British Household Panel Survey. Bristol: Policy Press.