CHAPTER IV
RESULT OF THE STUDY AND DISCUSSION
This chapter described the obtained data of the students’ vocabulary and
writing score. The presented data consisted of description the score, testing normality, linearity, homogenity and analysis of hypothesis.
A. Presentation Data
The vocabulary test conducted on August, 24th - 25th 2016 eighth grade students’ at SMP Muhammadiyah Palangka Raya. Then, for vocabulary class was
chosen VIII- 3 and VIII-4 consisted of 44 students. The test was student’s vocabulary score in multiple choice test vocus on verb used in simple past tense and there were 45 items with 80 minutes for to do the test.
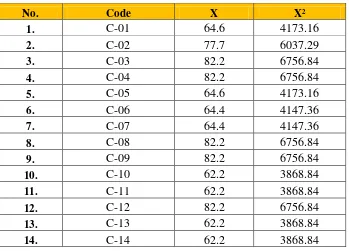
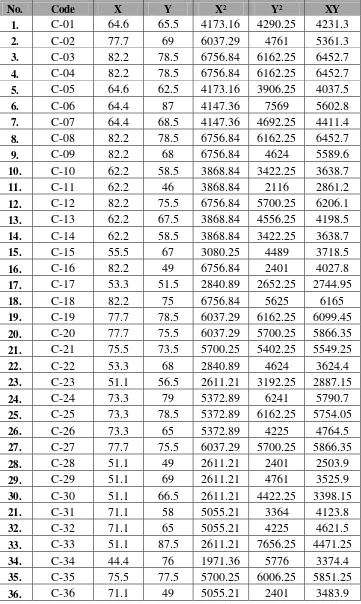
1. The Students’ Score of Vocabulary Test
The students’ score was described in the table 4.1
Table 4.1 The Description Data of the Students’ Vocabulary Score
15. C-15 55.5 3080.25
65.93, maximum of the score was 82.2 and minimum of the score was 40. To know the classificaton of the students’ score can be seen on the table below:
Table 4.2 Distribution of Students’ Achievement Criteria of Vocabulary Mastery of SMP Muhammadiyah Palangka Raya
No. Category Score Frequency
1. 80-100 7
2. 70-80 13
3. 60-70 12
4. 50-60 8
5. 0-50 4
Total 44
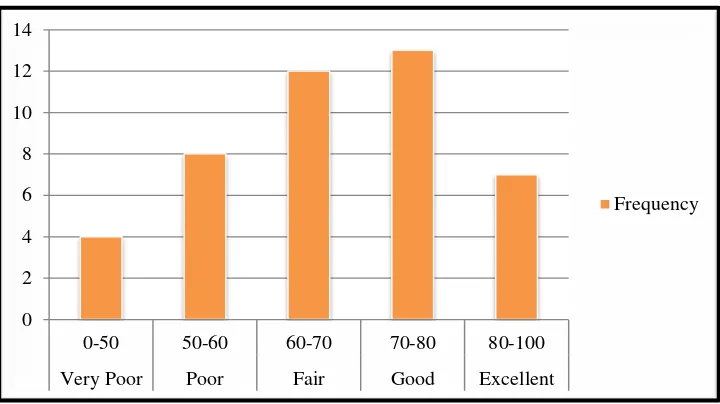
Based on the data above, there were seven students who got score 80-100. There were thirteen students who got score 70-80. There were twelve students who got score 60-70. There were eight students who got score 50-60, and there were four students who got score 0-50. Next, to know the classificaton of the students’ achievement criteria of heavy value and predicate can be seen on the table below:
Table 4.3 Distribution of Students’ Achievement Criteria of the
Vocabulary Score
Mark Value Letter Value Heavy Value Predicate
80-100 A 7 Excellent
70-80 B 13 Good
60-70 C 12 Fair
50-60 D 8 Poor
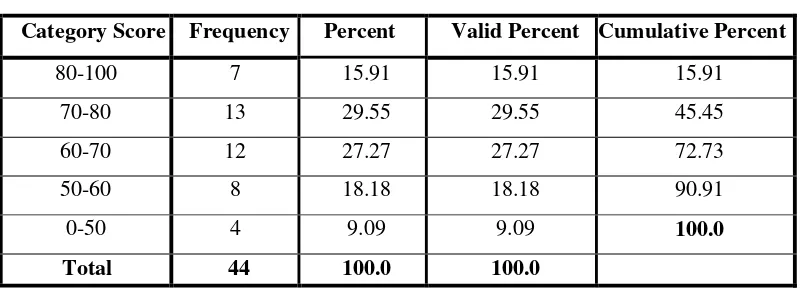
To determine the frequency of score, percent of score, and cumulative percent calculated using manual calculation as follows:
Table 4.4 the Frequency of Score, Percent of Score,
Valid Percent and Cumulative Percent calculated using Manual Calculation
Category Score Frequency Percent Valid Percent Cumulative Percent
80-100 7 15.91 15.91 15.91
70-80 13 29.55 29.55 45.45
60-70 12 27.27 27.27 72.73
50-60 8 18.18 18.18 90.91
0-50 4 9.09 9.09 100.0
Total 44 100.0 100.0
Based on the data of percent of score, it can be concluded that there was 15.91% students who got score 90-100. There were 29.55% students who got score 70-80. There were 27.27% students who got score 60-70. There were 18.18% students who got score 50-60. And there were 9.09% students who got score 0-50.
The next step, the result calculated the scores of mean using manual calculation as follows:
Mx = =
= 65.93
Figure 4.1 Histogram of Students’ Vocabulary Mastery Score were seven students who got 80-100 with predicate excellent.
The next step, the result calculated the score of mean using SPSS 18 program as follows:
Based on the table above, the result calculated using SPSS 18, it was found that the mean of score were 65.93, the standard deviation was 12.713 and the standard error of mean was 1.917. Then, based on valuation scale used in SMP Muhammadiyah Palangka Raya, the average of the students’ vocabulary mastery was in fair criteria.
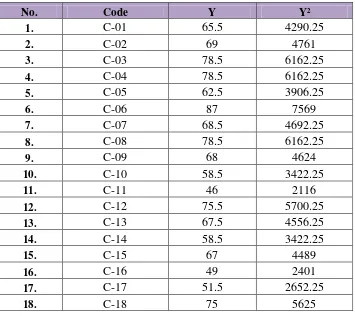
2. The Students’ Score of Writing Test
The writing test conducted on August, 31st and 01st 2016 eighth grade student’s at SMP Muhammadiyah Palangka Raya. Then, for writing class was
chosen VIII- 3 and VIII-4 consisted of 44 students. The writer used recount text and the students write down short paragraph about recount text with 80 minutes to do the test.
Table 4.6 The Description Data of the Students’ Writing Score
19. C-19 78.5 6162.25
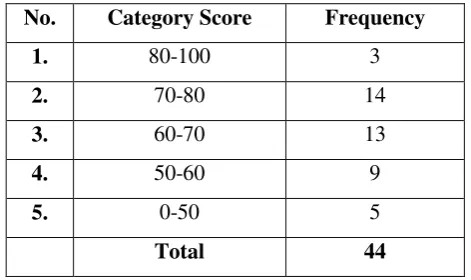
Table 4.7 Distribution of Students’ Achievement Criteria of Writing Ability of SMP Muhammadiyah Palangka Raya
No. Category Score Frequency
1. 80-100 3
2. 70-80 14
3. 60-70 13
4. 50-60 9
5. 0-50 5
Total 44
Based on the data above, there were ten students who got score 80-100. There were fourteen students who got score 70-80. There were thirteen students who got score 60-70. There were nine students who got score 50-60. And there were five students who got score 0-50.
The next, to know the classificaton of the students’ achievement criteria of heavy value and predicate can be seen on the table below:
Table 4.8 Distribution of Students’ Achievement Criteria of the Writing Score
Mark Value Letter Value Heavy Value Predicate
80-100 A 3 Excellent
70-80 B 14 Good
60-70 C 13 Fair
50-60 D 9 Poor
0-50 E 5 Very Poor
Table 4.9 the Frequency of Score, Percent of Score,
Valid Percent and Cumulative Percent calculated using Manual Calculation
Category Score Frequency Percent Valid Percent Cumulative Percent
80-100 3 6.82 6.82 6.82
70-80 14 31.82 31.82 38.64
60-70 13 29.55 29.55 68.18
50-60 9 20.45 20.45 88.64
0-50 5 11.36 11.36 100.0
Total 44 100.0 100.0
Based on the data of percent of score, it can be concluded that there was 6.82% students who got score 80-100. There were 31.82% students who got score 70-80. There were 29.55% students who got score 60-70. There were 20.45% students who got score 50-60. There were 11.36% students who got score 0-50.
The next step, the result calculated the scores of mean using manual calculation as follows:
Mx = =
= 67.19
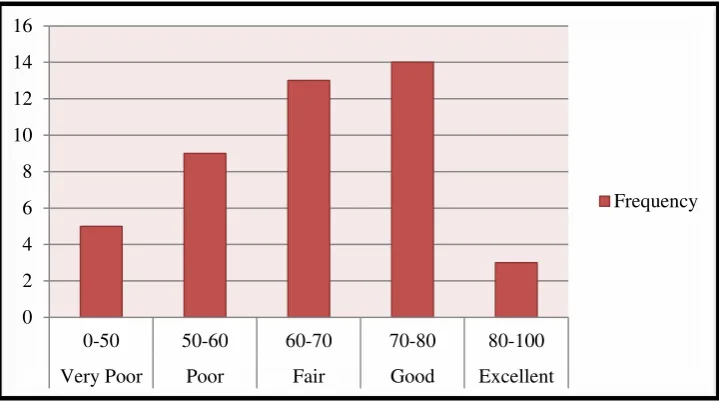
Figure 4.1 Histogram of Students’ Writing Score
It can be seen from the figure above the students’ writing score.
There were five students who got score 0-50 with predicate very poor. There were nine students who got score 50-60 with predicate poor. There were thirteen students who got score 60-70 with predicate fair. There were fourteen students who got score 70-80 with predicate good. And there were three students who got score 80-100 with predicate excellent.
The next step, the result calculated the score of mean using SPSS 18 program as follows:
Table 4.10 the Calculation of Statistics using SPSS 18
Based on the table above, the result calculated using SPSS 18, it was found that the mean of score were 67.19, the standard deviation was 11.443 and the standard error of mean was 1.725. Then, based on valuation scale used in SMP Muhammadiyah Palangka Raya, the average of the students’
writing score was in fair criteria.
B. Testing of Normality, Homogeneity and Linearity 1. Testing of the Normality
It used to know the normality of the data that was going to be analyzed whether both groups have normal distribution or not. Because of that, the normality test used SPSS 18 to measure the normality of the data.
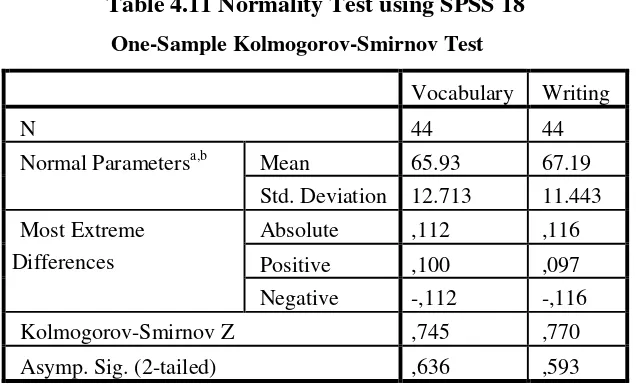
Table 4.11 Normality Test using SPSS 18
One-Sample Kolmogorov-Smirnov Test
Vocabulary Writing
N 44 44
Normal Parametersa,b Mean 65.93 67.19 Std. Deviation 12.713 11.443 Most Extreme
Differences
Absolute ,112 ,116
Positive ,100 ,097
Negative -,112 -,116
Kolmogorov-Smirnov Z ,745 ,770
Asymp. Sig. (2-tailed) ,636 ,593
value) from vocabulary and writing score in Kolmogorov-Smirnov Z table was higher than level of significance alpha used or r = 0.745 > 0.05 for vocabulary score and r = 0.770 > 0.05 for writing score. So, the distribution was normal. It meant the students’ score of vocabulary and writing had normal distribution.
2. Testing of the Homogeneity
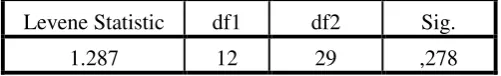
Table 4.12 Homogeneity Test using SPSS 18
Levene Statistic df1 df2 Sig.
1.287 12 29 ,278
The criteria of the homogeneity test was if the value of (probability value/critical value) was higher than or equal to the level significance alpha defined (r > a), it meant the distribution was homogeneity. Based on the calculation using SPSS 18 program above, the value of (probably value/critical value) from vocabulary and writing score of variance in sig column was known that p-value was 0.278. The data in this study fulfilled homogeneity since the p-value was 0.278 > 0.05.
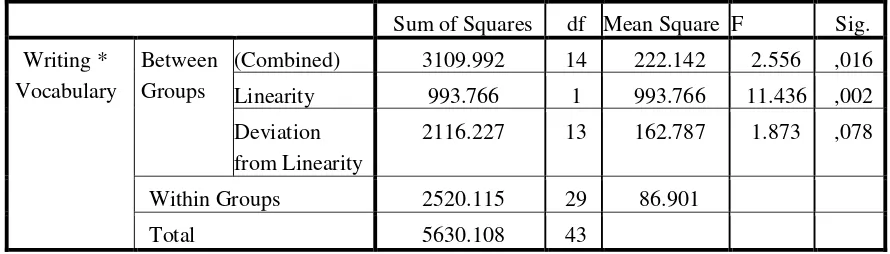
3. Testing of the Linearity
Table 4.13 Linearity Test using SPSS 18
The criteria of the linearity test was if the value of F and Sig. in the line Deviation from Linearity was higher than or equal to the level of significance or F (Sig.) > 0.05, it meant that the distribution was linear. Based on the calculation using SPSS 18 above, the value of F from vocabulary mastery and writing ability was 1.873 and value of Sig. was 0.078, and analysis above showed that value F was 1.873 with Sig. 0.078 higher than level of significance alpha or 0.078 > 0.05 for vocabulary mastery and writing ability. So, it concluded that correlation between students’ vocabulary mastery and writing ability was linearity.
C. Data Analysis
1. Testing Hypothesis using Manual Calculation
37. C-37 71.1 68 5055.21 4624 4834.8
Total 2901.1 2956.5 198230.9 204286.8 197562.1
To find out the correlation between vocabulary mastery and writing ability at SMP Muhammadiyah Palangka Raya, this study used Product Moment Formula by Pearson, as follow:
rxy =
( )( )
√* ( ) +* ( )+
=
√
=
√
=
= 0.420
The calculation above had shown index correlation of variable X and Y was 0.420. Based on the interpretation orientation score of “r” product, the value of rxy is on 0.400-0.700. So, the result correlation between variable X and variable
Y there is moderately positive correlation. It meant vocabulary mastery had association with writing ability.
The result of the calculation that was counted by product moment above showed that the index of correlation was 0.420. Then, the degree of calculation degree of freedom with formula,as follow:
df = N – nr It was known: N = 44, nr =2 Df = 44 – 2 = 42
Table 4.15
Critical Value of the Product Moment Correlation Coefficient Df The number of correlation variable
2 vocabulary mastery and writing ability at significant level 5%.
The correlation between variable X (vocabulary mastery) and variable Y (writing ability) can be illustrated by following scatter plot as follow:
Figure 4.3 the Linear of Variable X and Variable Y
The scatter plot above illustrated the direction of the correlation between the variables. The dots going from lower left to upper right indicate positive correlation. A scatter plot with dots going from lower left to upper right indicated
a positive correlation as variable X goes up, variable Y also goes up. Scatter plot of also reveals the moderate correlation between variables. The scatter plot above has shown the dots from a narrow band, made a straight line and spread closely. Its mean there is moderate correlation between two variables, vocabulary mastery and writing ability.
The reject or accepted hypothesis, this study calculated tvalue as follow:
The criteria of the test was if tobserved > t table, Ha was accepeted. It meant
there was significant correlation. If tobserved < t table, H0 was rejected.It meant there
was no significant correlation between variables. Based on the calculation above tobserved was 2.99. Next, to know df or degree of freedom used the formula nr – 2,
N = 44. So, df = n – 2 = 44 – 2 = 42 and ttable, = 2.02 at significance level 5% and
2.71 at significance level 1%. The following table was the result of tobserved and
ttable from df at 5% level, as follow:
Table 4.16 Result of the Manual Calculation Tobserved
Variable Tobserved Ttable Df/db
5% 1%
X-Y 2.99 2.02 2.71 42
The result of the ttest used manual calculation, it was found the tobserved
was greater than the ttable at 5% significance level or 2.99 > 2.02. It means Ha
(there is significant correlation between vocabulary mastery and writing ability at SMP Muhammadiyah Palangka Raya) is accepted and H0 (there is no significant
correlation between vocabulary mastery and writing ability at SMP Muhammadiyah Palangka raya) is rejected.
2. Testing Hypothesis using SPSS Calculation
Table 4.17 Correlation Index used SPSS 18 Program Correlations
X Y
Vocabulary (X) Pearson Correlation 1 ,420**
Sig. (2-tailed) ,005
Sum of Squares and Cross-products 6949.499 2627.960
Covariance 161.616 61.115
N 44 44
Writing(Y) Pearson Correlation ,420** 1
Sig. (2-tailed) ,005
Sum of Squares and Cross-products 2627.960 5630.108
Covariance 61.115 130.933
N 44 44
The table showed the result of “r” product moment calculation using SPSS 18 program. Since the result of Pearson Correlation was 0.420. So, both of group there was correlation.
3. Interpretation
To examine the truth of the false of null hypothesis, the result of Pearson Correlation was 0.420. Correlation , so Ha was accepted and H0 was rejected. The
result of Pearson Correlation was interpreted on the result of degree freedom to get the ttable. The result of the degree of freedom (df) was 42, it found from total
number of the students in both group minus 2. The following table was the result of Pearson Correlation and “r” table from df at 5% level.
Table 4.18 the Result “r” Product Moment using SPSS 18
Variable Pearson Correltion rtable Df/db
5% 1%
The result of the ttest used SPSS 18 program. It was found the Pearson
correlation was greater than the r table at 5% significance level or 0.420 > 0.304. It means that Ha is accepted and H0 is rejected. Based on the table above there was
moderate correlation between correlation variable vocabulary and writing.
It could be interpreted based on the result of calculation that Ha there is
correlation between students’ vocabulary mastery and writing students’ ability at SMP Muhammadiyah Palangka Raya and H0 stating that there is no correlation
between students’ vocabulary mastery and writing students’ ability at SMP Muhammadiyah Palangka Raya is rejected.
D. Discussions
Based on the result of linear, the dots going from lower left to upper right indicate positive correlation. A scatter plot with dots going from lower left to upper right indicated a positive correlation as variable X goes up, variable Y also goes up. Scatter plot of also reveals the moderate of the correlation between variables. It means the data of vocabulary mastery and writing ability in the present study have good linear association. As the result, the data in the present study can be analyzed by using parametric statistic especially product moment correlation.
Based on data analysis, vocabulary mastery gives contribution 17.64% to writing ability. The result of product moment correlation has shown that the value of rxy was greater than the value of ttable at 5% and 1%
Next, the dots in scatter plot of variable X and variable Y going from lower left to upper right. It means there was positive correlation between vocabulary mastery and writing ability. The dots in the scatter plot also formed a narrow band. When a straight line was drawn through the band the dots would be near the line. It illustrated that there was moderate correlation between the variables. So this way, alternative hypothesis is accepted and null hypothesis is rejected.
The result of calculation shows that average score of students’
vocabulary mastery is 65. And the average score of students’ writing ability was 67. In the present study, the result finding have proved that there is positive correlation between vocabulary mastery and writing ability with the correlation coefficient between two variables was 0.420. It means that the result of the present study there is moderate correlation between vocabulary mastery and writing ability. Thus, it can be considered that between students’ vocabulary mastery and writing students ability at SMP Muhammadiyah Palangka Raya has a positive correlation.
In line with writing, the result also shows the students’ vocabulary