http://dx.doi.org/10.17503/Agrivita-2014-36-1-p065-071
BIOCHAR EFFECT ON POTASSIUM FERTILIZER AND
LEACHING POTASSIUM DOSAGE FOR TWO CORN PLANTING SEASONS
Widowati*) and Asnah
TribhuwanaTunggadewiUniversity, Malang, Indonesia Jl. TelagaWarna Blok C Tlogomas Malang *)
Corresponding author Phone: +62-341-565500 E-mail: [email protected]
Received: February 12, 2014 /Accepted:May 30, 2014
ABSTRACT
An experiment in greenhouse was conducted to study the effect of biochar and fertilizer potassium against leaching and uptake of potassium on the growth of maize during the two cropping seasons. In the experiment, a randomized block design with seven treatments and three-time replication was applied, namely control (without biochar and KCl), biochar (30 t ha-1) with various doses of potassium fertilizer (0, 50, 100, 150 and 200 kg KCl ha-1) and potassium fertilizer treatment of 200 kg KCl ha-1 without biochar. The first planting used 90 kg N ha-1 basic fertilizer and 100 kg P2O5 ha-1, while the second planting fertilizer was added with 90 kg N ha-1. The results showed that biochar containing potassium was soluble and leached. The amount of potassium leached from the soil given the biochar 30 t ha-1 did not differ from that given 200 kg KCl ha-1. The amount of potassium leached was not different, ranging from 439-449 mg l-1in the first growing season (MT I) and 16-23 mg l-1in the second growing season (MT II) at various doses of KCl with biochar.
Keywords: biochar, leaching, potassium, uptake INTRODUCTION
Climate change has been the cause of irregularity in seasonal change. The amount of rainfall intensity causes problems in agriculture. Loss of nutrients through leaching is inevitable, especially in tropical areas with high rainfall. In this case, the application of mineral fertilizers should be reduced due to mineral fertilizers as a source of pollution. However, farmers often use more doses of mineral fertilizers so that crop production can be increased. It gives bad impact to soil, plants, and the environment. In fact, the use of mineral fertilizers can be reduced for environmental reason including carbon emission
from the production and transport of fertilizers. It is identified that crop productivity can still be increased through increasing nutrient uptake. Therefore, it is necessary that the fertilizer added to the soil can be absorbed by plant roots as much as possible. Absorption of nutrients in the soil is associated with the availability of nutrients in the soil, the roots’ ability to absorb nutrients, as well as the type of fertilizer used. Nutrient leaching is often an obstacle for the availability of nutrients in the soil.
Leaching is one of the impotant aspects for the nutrients that are mobile (Brady and Weil, 2008). This is because the nutrients in the soil solution were transferred by the percolation of water beyond the root zone so that the plants cannot utilize the nutrients. Factors that affect nutrient leaching are vegetation management and fertilization, soil structure and texture, rainfall patterns, soil chemistry, soil biology and nutrient cycle (Mayor et al., 2010). Nutrient leaching will result in reduced efficiency and reduced use of nutrient fertilizer in the soil.
Biochar is the most effective substance in reducing potassium loss in areas with high rainfall. Lehmann et al. (2003b) demonstrated the ability of biochar to retain the fertilizer from leaching by increasing fertilizer use efficiency results.This ability is related to the surface area of biochar. Widowati et al. (2011) argues that potassium leached from the application of biochar (61.19 mg l-1) is lower than using compost (81.98 mg l-1).The results of the study Widowati et al. (2012) in maize growing season's first 30 days shows that potassium is leached from biochar application of 30 t ha-1 at 39 ppm which is not different from the 200 kg KCl ha-1, which is 33 ppm. However, leaching of potassium increased (275-340 ppm) when biochar combined with K fertilizer at various doses. Potassium leaching did not increase with increasing doses of K fertilizer at the age of 30-60 days.
Biochar has been tested to be effective in reducing nutrient leaching at least in the short term. Some studies indicated that potassium, ammonium and nitrate leaching, which mostly inhibit plant growth, decreased by more than 50 % after 250 mm of water were added to the surface. Ca and Mg were also detained after the addition of biochar without fertilization, 20 % and 40 % of the leaching reduction, respectively after 250 mm of water were added. In addition, biochar with NPK fertilizer significantly reduced the leaching of Ca and Mg during the first week alone (Lehmann et al., 2003). Dünischet al. (2007) reported that potassium retention was also high with biochar. However, Lehmann et al. (2003) found that K in the leachate increased after the addition of biochar to soil, and attributed this to the high K content of biochar itself. The application of biochar to the soil caused a decrease in N leaching by 60 %, and increased crop productivity by 38-45 % (Lehmann et al., 2003). Lehmann (2007) stated that in addition to a significant response in crop productivity, it also improved soil quality and provided environmental benefits (e.g. reducing pollution due to reduced the loss of fertilizer through leaching).
Biochar produced from different feedstocks and under different conditions will show a variety of physical and chemical properties of the soil (Mermoudet al., 2006). Shinogi (2004) measures the rate of nutrient leaching in some biochar (K, Ca, P, S and Cl). Over time, this biochar may not be effective in supplying nutrients such as when it was first applied in the soil. Thus, it would seem that not only the quantity of ash is important but also the resistance to leaching. Long-term benefits of adding biochar to soil and water quality can be seen from the increase in nutrient retention and nutrient availability, reduction of nutrient leaching and other contaminants, the potential increase in the availability of water for crops, and increased mycorrhizal activity, which may be useful for other groups of microorganisms and their function in land (Warnock et al., 2007). Therefore it is necessary to study the effect of biochar application and potassium fertilizer to leaching potassium on the growth of corn plants in the first and second growing season.
MATERIALS AND METHODS
Land and Biochar from Organic Waste
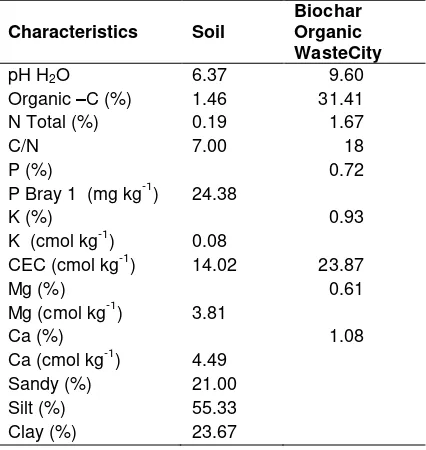
Silty clay soil was used in the study with Inceptisol depth of 0-20 cm. Biochar feedstock
used in the study was the city organic waste (consisting of leaves and stems of the rest of the vegetables and fruits, corn, grass, foliage of trees, and ornamental plants) taken from the Solid Waste Management Unit, Department of Health Malang. Biochar is produced from raw materials that have moisture content of 17-19% at a temperature of 5000C in 2 hours 5 minutes (Widowati et al., 2011). According to Ding et al. (2010), many pores are formed during the pyrolysis of bamboo at a temperature of 600 ° C with a high adsorption capacity and specific surface area of 330 m2 g-1. Biochar was used after passing through a 10-20 mesh sieve. Biochar characteristics were analyzed by the method as described by Widowatiet al., (2011). The results of the research and analysis of the basic characteristics of biochar soil are
of the soil sample in a cylinder was 40 cm). Three-millimeter pores were made at the bottom of the cylinder (4 pores cm- 2). For water filtration, 24 marbles were placed at the bottom of the pipe, and then the cylinder was closed with glasswoll. PVC was placed in the tub to hold water. Planting corn in the first growing season (MT I) was in April 2012 and the second growing season (MT II) was in April 2013. In this case, every single bisi corn variety is put in one PVC. Fertilization in MT I consisted of SP36 with a dose of 100 kg ha
- 1 and 200 kg ha-1 urea (90 kg N ha-1). Potassium Fertilization was given at 1 and 4 in accordance with the treatment in MST control (without biochar and KCl), B0K200 (without biochar +200 kg KCl fertilizer with the dose and time of administration as in MT I. Fertilizer P and K were not added in this administration.
Treatment was arranged in a randomized block design and repeated three times. Plant maintenance was given at the age of 60 days to achieve maximum vegetative growth. Maximum vegetative phase was marked just before panicles emerged. Before the potassium leached, 1,000 ml of distilled water was added in 1 day so that the moisture was evenly maintained at field capacity (Ding et al., 2010 and Widowati et al., 2011). During the period of leaching, the amount of water was added on top of the soil surface in plastic gutter pipe with the wash water volume comprising 1,000 ml at 30 days after planting, 2,000 ml at 30-40 days after planting, 3,000 ml at 30-40-50 days after planting, and 4,000 ml when the plants were 50-60 days old. Water was added once in every 5 days from the top of the PVC to reflect local precipitation. The leaching water sample (lechate) was taken every time during the period of laundering, which was 1 day after the addition of leaching water. Water sample collected was washed from early growth period to 60 days after planting.
At the end of the vegetative growth of the plants, the destructive leaf area (leaf area meter), the dry weight of the plants (leaves and stems), and potassium levels in leaf samples were observed. Drying process was done in an oven at a temperature of 70 0C for 2 x 24 hours until dry weight of plants was obtained. K nutrient uptake of
corn was determined by the dry weight of biomass and nutrient content of the crop in the corn crop K (current maximum vegetative at 8 weeks after planting). Analysis was done by using Flame Photometer potassium content models 2655-10. Data were analyzed using SPSS version 13.0 software program.
RESULTS AND DISCUSSION
Corn Plant Growth
Plant growth after leaching conditions in the first growing season (MT I) was better than MT II (Table 2). In general, application of biochar without potassium fertilizers produces similar growth when biochar is combined with potassium fertilizer. Although the plants were given biochar alone (B30K0), the process of assimilation to the formation of carbohydrates was still running. This was more evident when the treatment was compared with biochar treatment with various doses of KCl. The use of biochar dose of 30 t ha-1 can act as fertilizer that meets nutrient needs for crops that produce plant height, leaf area, plant dry weight in the first and second season (Table 2). Leaching during the two seasons and without the input of mineral fertilizers on the second season decreased plant growth. In the first growing season, plant height increased with the application of biochar and fertilizer potassium doses up to 100 kg ha-1KCl but potassium fertilizer residues did not affect plant height. The use of potassium fertilizer with a higher dose (150 – 200 kg KCl ha-1) did not increase the plant height.
Table 2. Plant height, leaf area, and total plant dry weight at 60 days after planting in Corn
Treatment Plant height (cm) Leaf area (cm
2
) Plant dry weight (t ha-1)
MT I MT II MT I MT II MT I MT II
Control 84.00 a 72.00 a 2483.37 a 1502.97 a 1.97 a 0.76 a B0K200 88.00 a 76.33 a 5301.66 c 2158.96 b 3.02 c 1.85 b B30K0 99.33 b 79.33 a 5792.14 d 2484.51 de 3.18 cd 1.99 bc B30K50 99.00 b 88.33 a 5952.86 d 2525.96 e 3.26 d 2.19 c B30K100 96.67 b 89.67 a 5149.67 c 2364.52 cde 3.12 cd 2.17 c B30K150 87.67 a 86.00 a 5075.17 c 2302.81 bcd 2.98 c 2.17 c B30K200 85.67 a 86.33 a 4614.40 b 2259.27 bc 2.63 b 2.19 c LSD 0.05 6.64 Ns 637.69 197.87 0.33 0.25
Potassium Uptake
Potassium in biochar in soil solution can be so easily absorbed by plants (Table 3) and are also sensitive to leaching (Table 4). In the first growing season, application of biochar with the highest dose of potassium (200 kg KCl ha-1) would result in the lowest potassium levels and uptake after control. Potassium uptake in the first season crops is greater than the second. Leached condition has reduced potassium uptake in plants especially the second season without addition of fertilizer potassium. Biochar application without fertilizer with potassium and potassium fertilizer low dose (50 kg KCl ha-1) resulted in high potassium uptake, but increasing doses of potassium decreased potassium uptake (Table 3). The application of biochar and potassium of various doses leached residue, which would give the same effect to the uptake of potassium in the next planting season.
Table 3. Potassium Uptake at 60 Days after planting
Treatment Potassium uptake (kg ha -1)
MT I MT II
Control 8.83 a 6.07 a B0K200 28.39 d 17.84 b B30K0 33.11 e 19.74 b B30K50 35.09 e 23.36 b B30K100 26.53 d 22.37 b B30K150 23.06 c 22.68 b B30K200 13.66 b 23.67 b LSD 0.05 4.52 7.55
Widowati and Asnah (2014) confirmed that the sole application of biochar increased maize production (6.24 Mg ha
-1
) by 14% compared to sole application of KCl fertilizer (5.45 Mg ha
-1
). In contrast, dual application of
biochar and 75% lower dosage of KCl fertilizer application increased maize production by 29%.
Leached Potassium
Biochar organic waste produced by pyrolysis (Widowatiet al., 2011) contains potassium (Table 1). It is recorded that potassium in biochar can be dissolved and leached. Lehmann et al (2003) found that K in the leachate increased after the addition of biochar to soil, giving high K content of biochar itself.
Table 4. Pottasium levels leached at 60 days after planting
Treatment Potassium leached (mg l -1)
MT I MT II
Control 10.62 a 5.63 a B0K200 33.59 a 6.66 a B30K0 46.19 a 7.78 a B30K50 336.60 b 15.84 b B30K100 439.29 c 19.65 b B30K150 442.65 c 21.87 b B30K200 448.57 c 23.02 b LSD 0.05 41.24 6.30
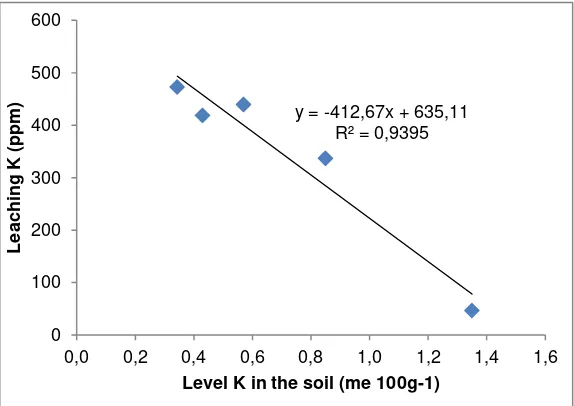
Figure 1. The relationship between Leaching and K Uptake on Growth of Maize MT I
Figure 2. The relationship between levels of K in the soil and leaching K on MT I Furthermore, 50-200 kg ha-1 KCl potassium
with potassium leaching produced biochar with no difference, ranging from 16 to 23 mg l-1 in MT II. Meanwhile, 100-200 kg potassium ha-1 KCl resulted in the leaching of potassium ranging from 439 to 449 mg l-1 in MT I. This proves that biochar can reduce nutrient loss of potassium. Widowati et al. (2010) said that biochar increased the amount of N, P, and K higher than organic fertilizers. Similarly, at the age of 30-60 days, increasing doses of potassium fertilizer with biochar do not increase the leaching of potassium in MT I (Widowatiet al., 2012). Biochar has higher stability
against decomposition, and it is capable of absorbing ions compared with other organic materials, due to the larger surface area, negative surface, and density (Liang et al., 2006; Lehmann, 2007). In the first growing season, there was a close relationship between leaching and K availability in the soil R2 = 0.94. The higher the leaching, the lower the K availability in the soil would be (Figure 2), so that the lower the potassium was absorbed by plants (Figure 1). The more potassium leached decreases the total K content in the soil (R2 = 0.49).
y = -0,0286x + 36,093 R² = 0,3337
0 5 10 15 20 25 30 35 40
0 100 200 300 400 500
K
Upt
ake
(
K
g
H
a
-1)
Leaching K (me 100g-1)
y = -412,67x + 635,11 R² = 0,9395
0 100 200 300 400 500 600
0,0 0,2 0,4 0,6 0,8 1,0 1,2 1,4 1,6
Le
a
c
hi
ng
K (pp
m
)
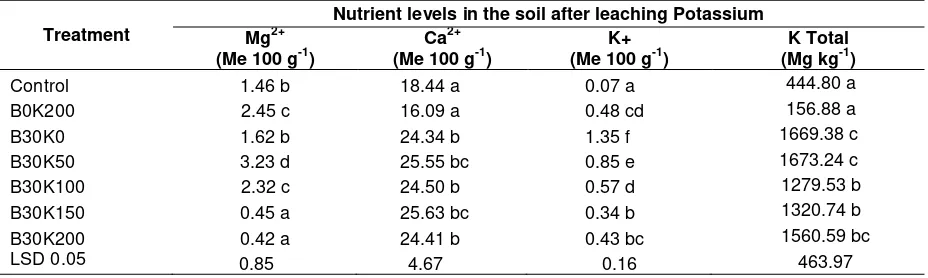
Table 5. Nutrient levels in the soil after leaching MT I
Treatment
Nutrient levels in the soil after leaching Potassium Mg2+
(Me 100 g-1)
Ca2+ (Me 100 g-1)
K+ (Me 100 g-1)
K Total (Mg kg-1)
Control 1.46 b 18.44 a 0.07 a 444.80 a B0K200 2.45 c 16.09 a 0.48 cd 156.88 a B30K0 1.62 b 24.34 b 1.35 f 1669.38 c B30K50 3.23 d 25.55 bc 0.85 e 1673.24 c B30K100 2.32 c 24.50 b 0.57 d 1279.53 b B30K150 0.45 a 25.63 bc 0.34 b 1320.74 b B30K200 0.42 a 24.41 b 0.43 bc 1560.59 bc LSD 0.05 0.85 4.67 0.16 463.97
Levels of Nutrients in The Soil after Leaching
After the leaching process, the total K content obtained was lower in the treated soil without biochar. The use of biochar without KCl and KCl fertilizer 50 kg ha-1 resulted in high total soil K levels. Further increase in the dose of KCl did not increase the levels of K and Ca in the soil (Table 5). KCl biochar treatment without leaving the highest levels of K+ leached after condition. After a period of leaching of K, higher level of Ca was obtained compared with Mg and K in the soil. The application of biochar caused the levels of Ca in the soil to increase rather than without biochar. High divalent ions could easily replace ions of lower valency. So Ca2+ could easily replace K+, but not vice versa. Cation exchange process was influenced by the valence of the cation, cation size, the nature of the mineral cations and cation concentration in solution.
When Ca2+ was replaced with K+ other necessary requirements, namely the concentration of K+ in the solution must be higher than the concentration of Ca2+. If both cations, accounting for the process of cation exchange, have the same valence, cations having a larger size have a greater ability to exchange cations (Tan, 2001). Similarly, the higher levels of Mg in the soil absorbed the higher potassium (R2 = 0.41). Total K content decreased with KCl fertilization compared to control. However, application of biochar caused total K content to increase (Table 5). Biochar application with increasing KCl would reduce the level of available K in the soil with R2 = 0.83. The availability of K content uptake increased K (R2 = 0.54) and total K content in the soil (R2 =
0.48). Tan (2001) states that the amount of potassium that can be adsorbed by the soil depends on the level of saturation. Potassium adsorbed mostly found in equilibrium with the potassium in the soil solution is the main source for the plant. Therefore, the K fertilization level in the soil increased. In the leaching conditions, fertilization KCl with and without biochar could increase the level of K in the soil. Application of KCl of biochar could increase the total K content in the soil (Table 5). This could saturate the complex adsorption in order to reach equilibrium with K in the soil solution.
CONCLUSIONS
Biochar containing potassium was soluble and can be leached. The amount of potassium leached from the soil given the biochar 30 t ha-1 did not differ by 200 kg KCl ha-1. The amount of potassium leached, ranging from 439 to 449 mg l -1
(MT I) and 16-23 mg l-1 (MT II) at various doses of KCl with biochar had no difference. . Biochar application without fertilizer with potassium and potassium fertilizer (50 kg KCl ha-1) resulted high potassium uptake while increasing doses of potassium would decrease the level of absorption.
ACKNOWLEDGEMENTS
Thanks are addressed to the Directorate General of Higher Education, Ministry of Education and Culture for providing research funding competitive grants in 2012 and 2013.
REFERENCES
the Interior,Geological Survey. Leachington, DC.
Ding, Y., L. Yu-Xue, W. Wei-Xiang, S. De-Zhi, Y. Min, and Zhe-Ke, Z. 2010. Evaluation of biochar effects on Nitrogen retention and leaching in multi-layered soil columns. Water Air Soil Pollut. http://dx.doi: 10. 1007/s11270-010-0366-4.
Dünisch, O., V.C Lima, G. Seehann, G, Donath, J.,Montoia, V. R. and Schwarz, T. .2007. Retention properties of wood residues and their potential for soil amelioration. Wood Science and Technology. 41: 69–189. Lehmann, J., J.P. Oda Silva Jr., C. Steiner, T.
Nehls, W. Zech, and Glaser, B. 2003. Nutrient availability and leaching in an archaeological Anthrosol and a Ferralsol of the Central Amazon basin: Fertilizer, manure and charcoal amendments. Plant and Soil. 249: 343–357.
Liang, B., J. Lehmann, D. Kinyangi, J. Grossman, B.O’Neill, J.O. Skjemstad, J. Thies, F.J. Luizao, J. Peterson, and E.G. Neves, 2006. Black carbon increases cation exchange capacity in soils. Soil Science Society of America. 70: 1719–1730. http://dx.doi.org/ 10.2136/sssaj2005.0383.
Lehmann, J. 2007. Bioenergy in the black Frontiers in Ecology and the Environment.. 5:381–387.
Mayor, J., M. Rondon, D. Molina, Susan, J. R. and J. Lehmann. 2010. Maize yield and nutrition during 4 years after biochar application to a Colombian savanna oxisol. Plant Soil. 333: 117–128. http://dx.doi 10.1007/s11104-010-0327-0.
Mermoud, F., S. Salvador, L.V. de Steene and F. Golfier. 2006. Influence of the pyrolysis heating rate on the steam gasification rate of large wood char particles. Fuel. 85: 1473–1482.
Shinogi,Y. 2004. Nutrient leaching from carbon products of sludge. ASAE/CSAE Annual International Meeting, Paper number 044063. Ottawa. Ontario. Canada