Richard Blum
Network Performance
Open Source Toolkit
Using Netperf, tcptrace,
Assistant Developmental Editor: Adaobi Obi Tulton Editorial Manager: Kathryn Malm
Managing Editor: Pamela M. Hanley
Text Design & Composition:Wiley Composition Services This book is printed on acid-free paper. ∞
Copyright © 2003 by Richard Blum. All rights reserved.
Published by Wiley Publishing, Inc., Indianapolis, Indiana Published simultaneously in Canada
No part of this publication may be reproduced, stored in a retrieval system, or transmitted in any form or by any means, electronic, mechanical, photocopying, recording, scanning, or otherwise, except as permitted under Section 107 or 108 of the 1976 United States Copyright Act, without either the prior written permission of the Publisher, or authorization through payment of the appropriate per-copy fee to the Copyright Clearance Center, Inc., 222 Rose-wood Drive, Danvers, MA 01923, (978) 750-8400, fax (978) 646-8700. Requests to the Pub-lisher for permission should be addressed to the Legal Department, Wiley Publishing, Inc., 10475 Crosspoint Blvd., Indianapolis, IN 46256, (317) 572-3447, fax (317) 572-4447, E-mail: [email protected].
Limit of Liability/Disclaimer of Warranty: While the publisher and author have used their best efforts in preparing this book, they make no representations or warranties with respect to the accuracy or completeness of the contents of this book and specifically disclaim any implied warranties of merchantability or fitness for a particular purpose. No warranty may be created or extended by sales representatives or written sales materials. The advice and strategies contained herein may not be suitable for your situation. You should consult with a professional where appropriate. Neither the publisher nor author shall be liable for any loss of profit or any other commercial damages, including but not limited to special, inci-dental, consequential, or other damages.
For general information on our other products and services please contact our Customer Care Department within the United States at (800) 762-2974, outside the United States at (317) 572-3993 or fax (317) 572-4002.
Trademarks:Wiley, the Wiley Publishing logo, and related trade dress are trademarks or registered trademarks of Wiley Publishing, Inc., in the United States and other countries, and may not be used without written permission. All other trademarks are the property of their respective owners. Wiley Publishing, Inc., is not associated with any product or ven-dor mentioned in this book.
Wiley also publishes its books in a variety of electronic formats. Some content that appears in print may not be available in electronic books.
Library of Congress Cataloging-in-Publication Data:
ISBN: 0-471-43301-2
Printed in the United States of America
Sorry, grandma, it’s not a mystery novel—but then again, in a way, maybe it is.
“Trust in the Lord with all your heart and lean not on your own understanding; in all your ways acknowledge him,
and he will make your paths straight.”
Acknowledgments xvii
Introduction xix
Part One Network Performance Primer 1
Chapter 1 Defining Network Performance 3
The Elements of Network Performance 4
Availability 4
Using Availability Statistics 5
Using Large Ping Packets 7
Response Time 8
Response-Time Factors 9
Determining Response Time from Ping Packets 9
Using traceroute for Redundant Paths 10
Network Utilization 11
Network Throughput 12
Bandwidth Capacity 14
Methods of Collecting Performance Data 15
Querying Network Devices 16
How Tools Query Devices 16
Values to Query 17
Watching Existing Traffic 18
Generating Test Traffic 19
Summary 20
Chapter 2 Watching Network Traffic 21
Catching All the Traffic 21
The libpcap Library 22
Downloading and Installing libpcap 22
Using libpcap 23
Contents
The winpcap Library 24
Downloading and Installing winpcap 24
Developing Applications with winpcap 25
Using winpcap 25
The tcpdump Program 25
Installing tcpdump 26
Linux RPM Installation 26
Downloading the Source Code 27
Using tcpdump 27
The WinDump Program 31
Downloading and Installing WinDump 31
Using WinDump 31
Filtering Packets with tcpdump and WinDump 33
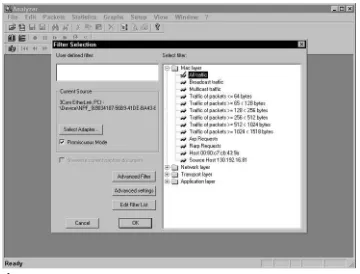
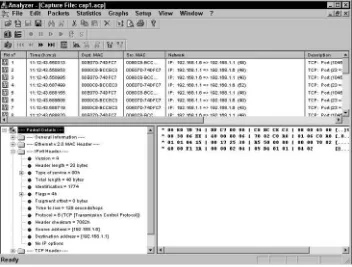
The Analyzer Program 35
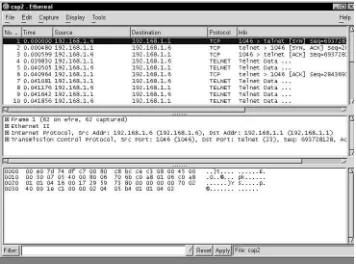
The Ethereal Program 37
Downloading and Installing Ethereal 38
Using Ethereal 38
Summary 40
Chapter 3 Network Device Utilization 41
The net-snmp Package 41
Downloading and Installing net-snmp 42
Using net-snmp Utilities 44
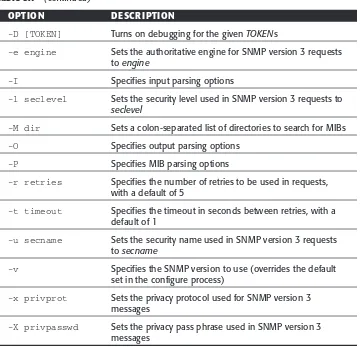
snmpget 45 snmpgetnext 46 snmpwalk 47 snmpdelta 48
Standard Network Performance MIBs 49
Data Rates 49
Error Rates 51
Using Vendor MIBs 52
The CISCO CPU MIB 53
Using the Cisco CPU MIB 55
Summary 57
Part Two Network Performance Tools 59
Chapter 4 netperf 61
What Is netperf? 61
TCP Network Performance 62
UDP Network Performance 62
Downloading and Installing netperf 63
Downloading netperf 63
Installing the netperf Package 63
Running netserver 65
Using netserver in Standalone Mode 66
Autostarting netserver 67
Measuring Bulk Network Traffic 70 TCP_STREAM 70 UDP_STREAM 71
Measuring Request/Response Times 72
TCP_RR 73 TCP_CRR 75 UDP_RR 75
Using netperf Scripts 76
Summary 77
Chapter 5 dbs 79
dbs Features 79
The Components of dbs 80
The dbs Output 80
Before Installing dbs 81
The ntp Program 81
The gnuplot Program 82
Downloading and Installing dbs 82
Running the dbsd Program 84
Configuring Command Files 86
Sender and Receiver Commands 87
The Pattern Command 88
Sample Sender and Receiver Sections 89
Test Commands 90
Performing Tests 90
Define the Test Environment 91
Create the Command File 91
Run the Test 93
Analyze the Data 94
Summary 97
Chapter 6 Iperf 99
Iperf Features 99
The Components of Iperf 100
The Iperf Program 100
The jperf Front End 100
The Iperf library 101
Iperf Tests 101
Iperf Output 102
Downloading and Installing Iperf 103
Downloading the Source Code 104
Compiling the Source Code 104
Installing iperf 104
Using Iperf 105
Starting the Iperf Server 105
Standalone Mode 105
Performing Simple Tests 106
Testing TOS Traffic 108
Testing UDP Traffic 109
Testing Multicast Traffic 111
Testing a File Transfer 112
Testing TCP Window Sizes 113
Using jperf 114
Summary 115
Chapter 7 Pathrate 117
Using Statistics to Measure Bandwidth 118
How Pathrate Works 118
Initial Phase 118
Phase I 118
Phase II 119
How Pathload Works 119
Using Pathrate 120
The Pathrate Programs 120
Downloading Pathrate 121
Compiling Pathrate 121
Starting the Pathrate Server 122
Starting the Pathrate Client 122
Pathrate Test Output 123
Quick Termination Mode 123
Full Testing Mode 124
Initial Phase Results 125
Phase I Results 125
Phase II Results 126
Using Pathload 127
Pathload 127
Downloading and Configuring Pathload 127
Starting the Pathload Server 128
Starting the Pathload Client 128
Pathload Output 129
Requested Fleet Parameters 129
Loss Rate per Stream 130
Server Fleet Parameters 130
Context Switches 131
Packet Discards 131
Relative One-Way Packet Delay Trend 131
Fleet Aggregate Trend 132
State Variable Updated 133
Final Test Results 133
Chapter 8 Nettest 137
What Is Nettest? 137
The lblnettest Application 138
Certificates and Keys 139
The ACLFile File 139
Test Applications 139
The OpenSSL Package 140
Downloading and Installing Nettest 142
Downloading Nettest 142
Before Compiling 143
Define All Test Hosts 143
Modify the Source Code 144
Compiling and Installing Nettest 145
Creating Certificates and Keys 146
Creating a Certificate Authority 147
Creating the Client Certificate and Key 148 Creating the Server Certificate and Key 149
Creating the ACLFile File 149
Using Nettest 150
Starting a Nettest Session 151
Performing Tests 152
Summary 154
Chapter 9 NetLogger 155
What Is NetLogger? 156
NetLogger APIs 156
NetLogger Host and Network Monitoring Tools 156
NetLogger Log File 157
NetLogger Graphical Tool 158
Downloading and Installing NetLogger 158
Source Code Distribution File 158
Binary Distribution File 160
Using the APIs 160
Functions 160
Types of nlv graphs 165
Configuring nlv 167
The bltGraph.pro File 167
The nlv-main.cfg File 167
The nlv-keys.cfg File 169
Chapter 10 tcptrace 175
What Is tcptrace? 175
Console Mode 176
Graphical Mode 177
Downloading and Installing tcptrace 178
Using tcptrace in Console Mode 179
Using Basic Command-Line Options 179
Standard Session Output 179
tcptrace Filters 183
Using Module Options 185
Graphical Programs 187
xplot 187 jPlot 188
Using tcptrace in Graphical Mode 189
Standard Graphs 189
Throughput Graph 189
Time Sequence Graph 191
Traffic Module Graphs 193
Summary 194
Chapter 11 ntop 197
What Is ntop? 198
Before Installing ntop 202
Creating the ntop User ID 203
Loading Support Software 203
Downloading and Installing ntop 204
Compiling and Installing gdchart 205
Compiling ntop 206
Running ntop 206
Starting ntop for the First Time 207
ntop Command-Line Parameters 208
Using ntop Command-Line Parameters 209
Monitoring Network Traffic 209
Analyzing a tcpdump Dump File 210
ntop Access Log File 211
Viewing ntop Data 211
Connecting to ntop 211
Watching Hosts 212
Watching Network Traffic 214
Chapter 12 Comparing Network Performance Tools 217
Tools for Testing the Network 218
Bulk Data Transfers 218
Using Pathrate to Find the Network Bottleneck 219 Using netperf to See Actual Network Bandwidth 221 Using ntop to Analyze Network Traffic 223 Using NetLogger to Analyze Host Functions 225
Request/Response Traffic 225
Using netperf to Simulate HTTP Traffic 227 Using tcptrace to Watch HTTP Sessions 228
Analyzing Production Traffic 229
Analyzing an FTP Session 230
Using tcptrace 230
Using ntop 233
Analyzing a Telnet Session 234
Using tcptrace 235
Using ntop 237
Summary 237
Part Three Application Performance Tools 239
Chapter 13 Measuring Application Performance 241
Methods of Testing Network Applications 242
The Test Network 242
Production Network 243
Network Emulation 243
Network Traffic Generator 244
Network Emulation Device 244
Network Simulation 245
Discrete Event 246
Analytical 246
Modeling Network Problems 246
Bandwidth Constraints 247
Packet Errors 248
Lost Packets 248
Out-of-Order Packets 249
Delayed Packets 250
Modeling Network Devices 251
Hubs 251 Switches 252 Routers 253
Quality of Service 254
Weighted Fair Queuing 254
Stochastic Fair Queuing 254
Random Early Detection 255
Wide Area Networks 256
Modeling Point-to-Point Networks 256
Modeling Packet-Switching Networks 257
Wireless Networks 257
Summary 258
Chapter 14 dummynet 259
What Is dummynet? 260
Dummynet Features 260
Using the dummynet Host 261
The ipfw Application 263
Creating New Rules 264
Rule Number 264
Random Packet Loss 270
Queue Size 270
Configuring WFQ 271
Configuring Multipath Links 271
Installing dummynet 271
Kernel Options 272
Building a New Kernel 273
Installing PicoBSD 273
Controlling dummynet 274
Testing dummynet 275
Setting Network Delays 275
Setting Network Bandwidths 277
Summary 277
Chapter 15 NIST Net 279
What Is NIST Net? 279
NIST Net Emulations 280
Bandwidth Limitation 280
The NIST Net Configuration Tools 285
The NIST Net Optional Tools 286
mungebox 287 nistspy 287
Downloading and Installing NIST Net 288
Downloading NIST Net 288
Compiling NIST Net 288
Getting the Required Files 289
Compiling the Source Code 290
Loading NIST Net 291
Using NIST Net 292
Using cnistnet 292
Using xnistnet 295
Creating Rules 296
Modifying Rules 297
Summary 298
Chapter 16 Network Traffic Generator 301
What Is Network Traffic Generator? 301
How Network Traffic Generator Works 302
The Core Modules 302
The Protocol Modules 303
The Payload Modules 303
The Response Modules 304
The Network Traffic Generator Programs 304
Command-Line Interface 304
X Windows Interface 305
Generating Network Traffic 306
Bulk Data Transfers 306
Client/Server Transactions 307
Connectionless Communication 308
Downloading and Installing the Package 308
Downloading 308
Before Compiling 309
fastdep 309
Kylix Libraries 310
Compiling and Installing 311
Using Network Traffic Generator 312
Command-Line Options 312
Server 312 Client 313
Setting Up a Test 315
Test Host Placement 316
Test Host Configuration 316
Watching the Test Traffic 317
Chapter 17 ns 321
What Is ns? 321
Network Simulator Programs 322
ns 322 nam 323 xgraph 324
Network Model Elements 324
Network Nodes 324
Network Links 325
Network Agents 326
Network Applications 327
ns Modeling Language 329
Downloading and Installing ns 330
Downloading 331
Compiling and Installing 332
Validating the Installation 332
Performing a Network Simulation 332
Creating the Simulation Model 333
Running the Simulation 336
Using nam 338
Using xgraph 339
Summary 340
Chapter 18 SSFNet 343
What Is SSF? 344
What Is SSFNet? 345
Libraries 345
Domain Modeling Language (DML) 346
Networks 347 Hosts 349 Links 350 Routers 351 Protocols 352
Downloading and Installing SSFNet 353
Downloading 354 Installing 354
Creating a Development Environment 355
Using SSFNet 356
Creating a Model 356
Running the Simulation 360
Interpreting the Results 362
Chapter 19 Comparing Application Performance Tools 365
Modeling the Production Environment 365
The Production Network 366
Modeling the Network 367
Using ns 368
Building the Model 368
Running the Model 371
Interpreting the Results 372
Using SSFNet 374
Building the Model 374
Running the Model 377
Interpreting the Results 379
Using dummynet 379
Building the Emulation Environment 379
Running the Emulation 380
Using NIST Net 381
Building the Emulation Environment 381
Running the Emulation 383
Final Results 383
Summary 384
Appendix Resources 387
First, all glory, honor, and praise go to God, who through His Son makes all things possible, and who gives us the gift of eternal life.
I would like to thank all the great people at Wiley Publishing, Inc. for their help, guidance, and professionalism. Thanks to Carol Long, the Acquisitions Editor, for offering me the opportunity to write this book, and to Adaobi Obi Tulton, the Assistant Developmental Editor, for both helping guide this book along, and working to help make the paragraphs make sense. Also many thanks to Carole McClendon at Waterside Productions for her help in arrang-ing this opportunity for me.
Finally, I would like to thank my parents, Mike and Joyce Blum, for their dedication and support, and my wife Barbara and daughters Katie Jane and Jessica for their faith, love, and understanding, especially while I was writing this book.
Acknowledgments
The job of the network administrator is complicated. If you are a network administrator, not only are you responsible for installing and maintaining the wires, hubs, switches, and possibly routers and firewalls, but you must also ensure that they all work efficiently together. Of course, this all must be done within the constraints of a budget, which these days is often smaller than what you really need to accomplish the job. The goal of this book is to show you some freely available tools that can be used to help monitor and troubleshoot a network, providing you with a toolkit of programs to use when problems arise.
The network administrator is often the first line of defense whenever any-thing behaves oddly on the network. Even when there is no clear-cut culprit, the network administrator has to prove that the network is not at fault. Net-work performance is often a difficult thing to measure. What is fast perfor-mance for one application can often be slow for another. It is your job to ensure that the network and the network applications are performing properly for your environment. This book is intended to help you with this task.
Overview
Network performance has been studied for many years, which has produced lots of theoretical work on how network traffic is affected by network load. Unfortunately, for the average network administrator in charge of the com-pany network, equations and theories do not help solve real-world problems, such as slow network application performance. Instead, what is required is
Introduction
real-world tools that can monitor and analyze network behavior, to identify the cause of network performance problems and determine how to quickly (and usually, cheaply) fix them.
With the explosion of Open Source software in recent years, many free applications are becoming available that can help the average network admin-istrator. Usually these applications can be easily downloaded, configured, and used to help determine both network performance and network application performance. Money that companies used to have to spend on network per-formance tools can now be used to purchase equipment to actually solve net-work problems.
Most Open Source applications are written for the Unix platform. In the past, this was a huge restriction, especially for network administrators who didn’t happen to have a big Unix box lying around. However, with the popu-larity of free Unix distributions such as Linux and FreeBSD, anyone can have a Unix platform for Open Source applications. Now, for little or no money, network administrators can have a fully functional network monitoring and analysis toolkit at their fingertips. This provides opportunities for network troubleshooting that previously were only available with expensive high-end systems.
How This Book Is Organized
This book is divided into three sections. The first section presents a network performance primer, showing some of the basic elements that affect network performance, and explaining how to use some simple Open Source tools to monitor them.
Chapter 1, “Defining Network Performance,” describes the techniques used by the Open Source tools to monitor network performance. Understanding how the tools work makes it easier to understand the output, and to determine what solutions can be used to solve any problems detected.
Chapter 2, “Watching Network Traffic,” presents some Open Source tools used for monitoring network traffic, in both the Unix and Windows environ-ments. Monitoring network traffic is often an excellent troubleshooting tool when looking for network performance problems.
Chapter 4, “netperf,” describes the netperf network performance tool, developed by Hewlett-Packard. The netperf application can be used to send different types of data streams across a network, and monitor the performance of each type of data stream.
Chapter 5, “dbs,” discusses the dbs performance tool, developed at the Nara Institute of Science and Technology, in Japan. The dbs application can be used to perform network tests between two remote hosts on the network, without being connected to either one.
Chapter 6, “Iperf,” presents the Iperf application, which was developed at the National Laboratory for Applied Network Research (NLANR), and is cur-rently maintained at the University of Illinois. The Iperf application focuses on how TCP parameters can affect network application performance, and how fine-tuning TCP host parameters can increase the performance of many net-work applications.
Chapter 7, “Pathrate,” discusses both the Pathrate and Pathload applica-tions, developed and maintained by Constantinos Dovrolis, who is currently working at Georgia Tech. Both applications rely on advanced network statisti-cal statisti-calculations, involving the delays present in transferring packets across network devices along the path between the two endpoints.
Chapter 8, “Nettest,” describes the Nettest application, developed at the Lawrence Berkeley Labs as a secure shell for performing network tests between hosts. The Nettest application uses the OpenSSL security application to encrypt network performance sessions, and to control who is allowed to run network tests.
Chapter 9, “NetLogger,” presents a slightly different technique used for monitoring network application performance. The NetLogger application pro-vides a set of APIs that is used within network applications for logging net-work events, such as writing data to the netnet-work and reading data from the network. Once the network log is created, a graphical interface allows you to monitor each of the network events and determine which events have poor performance.
Chapter 10, “tcptrace,” discusses the tcptrace application, developed at Ohio University. The tcptrace application analyzes data captured by the tcp-dump application, quickly displaying information about each TCP session in the trace.
Chapter 11, “ntop,” introduces you to the ntop application, developed at the University of Pisa, in Italy, to produce graphical Web pages showing network utilization by each device on the network. This helps you determine which devices are consuming the most resources on the network.
The third section of the book describes how to use network application per-formance tools to analyze how network applications behave in different net-work environments. By analyzing the applications in a test netnet-work, you can often see potential problems before the application is released in the produc-tion network.
Chapter 13, “Measuring Application Performance,” discusses how network application performance testing tools—both network emulators and network simulators—can help you determine how applications will perform in the pro-duction network.
Chapter 14, “dummynet,” describes the dummynet application, which is available on FreeBSD systems to emulate network behavior using a FreeBSD host. This enables a single FreeBSD host to be used within a test network to emulate the network delay, bandwidth limitations, and packet loss of a full production network.
Chapter 15, “NIST Net,” discusses the NIST Net application, developed at the U.S. National Institute of Standards and Technology to simulate network behavior using a Linux system. This application provides the network emula-tion funcemula-tions to use a Linux system to model the producemula-tion network.
Chapter 16, “Network Traffic Generator,” presents the traffic application, which is used to generate specific data traffic patterns on the network. This can be used to artificially emulate production network traffic on a test network using a single host.
Chapter 17, “ns,” describes the Network Simulator application, developed at the University of California Berkeley as a method to simulate network behavior without having to actually have a test network available.
Chapter 18, “SSFNet,” discusses the Scaleable Simulation Framework (SSF), and how it is used to model network behavior, using either C++ or Java.
Chapter 19, “Comparing Application Performance Tools,” wraps up the final section by showing how to model production networks, and how to use the emulation and simulation tools presented to predict network application performance.
Who Should Read This Book
Because network applications go hand in hand with networks, the sec-ondary focus of the book is to help in the analysis of network application per-formance. Both network application developers and network administrators must test network applications within a test network before deploying them to the production network. For this to be done properly, the production network environment must be accurately duplicated within the test network. Open Source network emulators and simulators make this possible. The book pre-sents each emulator and simulator tool, showing how it can be used to dupli-cate the production network environment.
Tools That Are Needed
This book uses mainly Open Source tools intended for the Unix platforms. Some type of Unix platform is required to install, compile, and operate each of the tools. The use of Open Source Unix distributions, such as FreeBSD or Linux, is highly encouraged. All of the tools presented were installed, com-piled, and tested on a Mandrake Linux 8.0 system (with the exception of dummynet, which requires a FreeBSD system).
All of the tools are available for download from their respective Internet Web sites. Some type of Internet access is required to access the tools’ distribu-tion packages. Of course, the faster the Internet connecdistribu-tion, the quicker the downloads will proceed. Some of the distribution packages are fairly large, so using a slow-speed modem connection may take a while.
Summary
Trying to troubleshoot network performance issues while customers are com-plaining is not a fun job. Hopefully this book will present some ideas and options to help you identify and fix network problems before your customers notice them. Nothing takes the place of experience. Monitoring and analyzing network performance when there are no problems often helps in times when there are problems. Knowing what a healthy network looks like helps in iden-tifying problems in a sick network.
One
3 Before you dive into detailed discussions of network performance tools, it is a good idea to first understand what network performance is, and how it can be measured. This chapter defines network performance, describes the elements involved in measuring it, and shows techniques many network performance tools use to measure it
The words that network administrators hate to hear are “The network seems slow today.” What exactly is a slow network, and how can you tell? Who deter-mines when the network is slow, and how do they do it? There are usually more questions than answers when you’re dealing with network performance in a production network environment.
It would be great if there were standard answers to these questions, along with a standard way to solve slow network performance. The open source net-work performance tools presented in this book can help the netnet-work adminis-trator determine the status of the network, and identify the areas of the network that could be improved to increase performance. Often, network bottle-necks can be found, and simply reallocating the resources on a network can greatly improve performance, without the addition of expensive new network equipment.
Knowing the elements of network performance will help you better under-stand how the network performance tools work, and how to interpret the vast amount of information the tools provide. The first section of this chapter describes the elements involved in determining network performance.
The Elements of Network Performance
Much work has been devoted to the attempt to define network performance exactly. It is not the intention of this book to bore you with numerous equa-tions that describe theoretical network philosophy about how packets traverse networks. Network performance is a complex issue, with lots of independent variables that affect how clients access servers across a network. However, most of the elements involved in the performance of networks can be boiled down to a few simple network principles that can be measured, monitored, and con-trolled by the network administrator with simple—often free—software.
Most network performance tools use a combination of five separate elements to measure network performance:
■■ Availability ■■ Response time ■■ Network utilization ■■ Network throughput
■■ Network bandwidth capacity
This section describes each of these elements, and explains how network performance tools use each element to measure network performance.
Availability
The first step in measuring network performance is to determine if the net-work is even net-working. If traffic cannot traverse the netnet-work, you have bigger problems than just network performance issues. The simplest test for network availability is the ping program. By attempting to ping remote servers from a client device on the network, you can easily determine the state of your network.
Just about all Unix implementations include the ping program to query remote hosts for availability. The ping program sends an Internet Control Mes-sage Protocol (ICMP) echo request packet to the destination host. When the echo request packet is received, the remote host immediately returns an echo reply packet to the sending device.
While most network administrators know what the ping program is, few know that there are lots of fancy options that can be used to perform advanced testing using the ping program. The format of the ping command is:
You can use different combinations of options and parameters to create the ping test that best suits your network environment. Often, just using the default options and parameters provides enough information about a network link to satisfy availability questions.
Receiving an echo reply packet from the remote host means that there is an available network path between the client and server devices. If no echo reply packet is received, there is a problem with either a network device or a link along the path (assuming the remote server is available and answering pings). By selecting different remote hosts on the network, you can determine if all of the segments on your network are available for traffic. If multiple hosts do not respond to a ping request, a common network device is most likely down. Determining the faulty network device takes some detective work on your part.
While sending a single ping packet to a remote host can determine the avail-ability of a network path, performing a single ping by itself is not a good indi-cator of network performance. You often need to gather more information to determine the performance of any connections between the client and the server. A better way to determine basic network performance is to send a string of multiple ping request packets.
Using Availability Statistics
When multiple ping packets are sent to a remote host, the ping program tracks how many responses are received. The result is displayed as the percentage of the packets that were not received. A network performance tool can use the ping statistics to obtain basic information regarding the status of the network between the two endpoints.
By default the Unix ping program continually sends ping requests to the designated remote host until the operator stops the operation by pressing a Ctrl-C key combination. Alternately, you can use the -c option in the ping com-mand to specify a specific number of ping requests to send. Each ping request is tracked separately using the ICMP sequence field.
A sample ping session that uses multiple ping packets looks like this:
$ ping 192.168.1.100
PING 192.168.1.100 (192.168.1.100): 56 data bytes
64 bytes from 192.168.1.100: icmp_seq=0 ttl=255 time=0.712 ms 64 bytes from 192.168.1.100: icmp_seq=1 ttl=255 time=0.620 ms 64 bytes from 192.168.1.100: icmp_seq=2 ttl=255 time=0.698 ms 64 bytes from 192.168.1.100: icmp_seq=3 ttl=255 time=0.662 ms 64 bytes from 192.168.1.100: icmp_seq=4 ttl=255 time=0.649 ms ^C
192.168.1.100 ping statistics
In this example, a response was received for all of the packets that were sent, indicating no problems on the network. If any of the ping packets do not solicit a response, it can be assumed that either the echo request packet did not make it to the remote server, or the remote server’s echo response packet did not make it back to the pinging client. In either case, something on the network caused a packet to be lost.
Once you establish that there are lost packets in the ping sequence, you must determine what caused the packet losses. The two biggest causes of lost pack-ets are:
■■ Collisions on a network segment ■■ Packets dropped by a network device
Within an Ethernet segment, only one station is allowed to transmit at a time. When more than one station attempts to transmit at the same time, a col-lision occurs. Having colcol-lisions is normal for an Ethernet network, and not something that should cause panic for the network administrator.
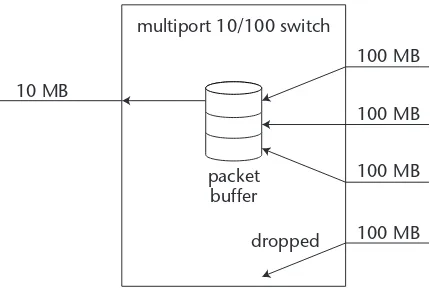
However, as an Ethernet segment gets overloaded, excessive collisions will begin to take over the network. As more traffic is generated on the network, more collisions occur. For each collision, the affected senders must retransmit the packets that caused the collision. As more packets are retransmitted, more network traffic is generated, and more collisions can occur. This event is called a collision storm, and can severely affect the performance of a network segment. Dropped packets can also result in packet losses. All network devices con-tain packet buffers. As packets are received from the network, they are placed in a packet buffer, waiting for their turn to be transmitted. This is demon-strated in Figure 1.1.
Figure 1.1 Dropping packets in a network device.
packet buffer
multiport 10/100 switch
100 MB
100 MB
100 MB
100 MB dropped
Each port on a router or switch device contains an individual buffer area that accepts packets destined to go out the interface. If excessive network traf-fic occurs, preventing the timely emptying of the buffer, or if more packets arrive than the port can transmit, the buffer will fill up.
If a network device’s packet buffer gets filled up, it has no choice but to drop incoming packets. This scenario happens frequently on network devices that connect to networks running at different speeds, such as a 10/100 switch or router. If lots of traffic arrives on a high-speed 100-MB connection destined for a lower-speed 10-MB connection, packets will be backed up in the buffers, and often overflow, causing dropped packets and retransmissions from the send-ing devices.
To minimize this effect, most network devices are configured to allocate ample memory space for handling packet buffers. However, it is impossible to predict all network conditions, and dropped packets still may occur.
Using Large Ping Packets
Another problem with measuring availability is the size of the packets used in the ping request. Many network devices handle packets with multiple packet buffers, based on average packet sizes. Different buffer pools handle different-sized packets. Too many of one particular size of packet can cause dropped packets for that size category, while packets of other sizes are passed without a problem.
For example, switches often have three classes of packet buffers—one for small packets, one for medium-sized packets, and one for large packets. To accurately test these network devices, you must be able to send different-sized packets to test the different packet buffers.
To accommodate this, most network performance tools allow you to alter the size of the packets used in the testing. When testing networks that utilize routers or switches, you must ensure that a wide variety of packet sizes are used to traverse the network.
T I P There have been many instances of security problems with large ping packets. As a result, most Unix systems only allow the root account to send large ping packets. You should be careful when sending larger packets to remote servers, so as to not adversely affect the remote server.
After altering the packet size of the ping packets, you can see how this affects the ping statistics by observing the output from the ping command:
# ping -s 1000 192.168.1.100
PING 192.168.1.100 (192.168.1.100):1000 data bytes
1008 bytes from 192.168.1.100: icmp_seq=0 ttl=127 time=2.994 ms 1008 bytes from 192.168.1.100: icmp_seq=1 ttl=127 time=2.952 ms 1008 bytes from 192.168.1.100: icmp_seq=2 ttl=127 time=2.975 ms 1008 bytes from 192.168.1.100: icmp_seq=3 ttl=127 time=2.940 ms 1008 bytes from 192.168.1.100: icmp_seq=4 ttl=127 time=3.133 ms 1008 bytes from 192.168.1.100: icmp_seq=5 ttl=127 time=2.960 ms 1008 bytes from 192.168.1.100: icmp_seq=6 ttl=127 time=2.988 ms ^C
192.168.1.100 ping statistics
---7 packets transmitted, ---7 packets received, 0% packet loss round-trip min/avg/max/stddev = 2.940/2.992/3.133/0.060 ms #
In this example, all of the large ping packets were still successful, indicating that all of the segments between the host and the client were processing the larger packets without any problems. If you experience packet loss with larger packets, but not with smaller packets, this often indicates a problem with a router or switch buffer somewhere in the network. Most router and switch devices allow the administrator to change the packet buffer allocations to allot more buffers for a particular packet-size range.
Response Time
As seen in the ping example, while network availability is one element of net-work performance, it cannot accurately reflect the overall performance of the network. The network customers’ perception of the network is not limited to whether or not they can get to an individual server. It also includes how long it takes to process data with the server.
To obtain a more accurate picture of the network performance, you must observe how long it takes packets to traverse the network. The time that it takes a packet to travel between two points on the network is called the
response time.
While network response time is often obvious to customers, trying to mea-sure the response time between two separate hosts can be a difficult thing to do. Determining the time it takes for a packet to leave one network device and arrive at a remote network device is not easy. There must be some mechanism to time the leaving and arriving events, independent of the two systems on the network.
When using network performance tools that utilize round-trip response times, it is always wise to incorporate the remote system’s CPU utilization in the data taken, to ensure that you are comparing response times run at similar system loads, eliminating the system-loading factor.
Response-Time Factors
In large networks, there are many factors that can affect response times between a client and a server. As the network administrator, you can control some of these factors, but others are completely out of your control. These fac-tors can include:
■■ Overloaded network segments ■■ Network errors
■■ Faulty network wiring ■■ Broadcast storms ■■ Faulty network devices ■■ Overloaded network hosts
Any one or combination of these factors can contribute to slow network response time. Measuring the individual factors can be difficult, but the net-work performance tools presented in this book can measure the overall effect each factor has on network response times by sending known network traffic samples and determining how the data traverses the network
Determining Response Time from Ping Packets
As seen in the sample outputs for the ping program, the round-trip response time values for each ping packet sent are shown in the ping packet statistics:
64 bytes from 192.168.1.100: icmp_seq=0 ttl=255 time=0.712 ms
WA R N I N G Remember that the ping response time values are round-trip response times. The current load on the remote system affects these values.
When multiple ping packets are sent, an average of their response times is calculated and displayed:
round-trip min/avg/max/stddev = 2.940/2.992/3.133/0.060 ms
The response time for a connection can depend on many different factors within the network connection. As the packets traverse the network, each net-work device can play a role in the total response time. The netnet-work perfor-mance tool must be able to take into account the response-time factors for each network connection.
The best use for ping response times is to establish a baseline value, or the values seen when the network is performing at normal speeds. When cus-tomers complain about slow network performance, the ping response time values taken can then be compared against response times taken during nor-mal network performance. Any drastic deviations in these times can represent a problem with a network device.
Using traceroute for Redundant Paths
In a network that has redundant paths, it is often desirable to determine which path packets are taking at any given time. If you determine that packets are not being routed in the most efficient manner, you can often make simple configu-ration changes to routers to increase response times.
The Unix traceroute program allows the network administrator to deter-mine exactly which route packets are taking to get between two points on the network. The traceroute utility uses the IP Time to Live (TTL) value to pur-posely force a packet to expire along the path to the destination.
The TTL value specifies how many hops an individual packet can make before expiring. When a router sees a packet with an expired TTL value, it should report the problem back to the sending network device. By starting the TTL value at 1 and incrementing it at each ping attempt, the traceroute utility forces remote routers along the network path to expire the ping packet and return an ICMP destination unreachable packet to the client. Since the router itself must return the packet, each router traversed along the network path is identified.
The format for the traceroute command is:
traceroute [-dFInrvx] [-f firstttl] [-g gateway] [-i iface] [-m maxttl] [-p port] [q nqueries] [-s srcaddr] [-t tos] [-w waittime] host [packetlength]
The default values for all of the options can be used to send a simple traceroute probe to a remote host. The output from a sample traceroute across the Inter-net to the www.cisco.com host looks like this:
$ traceroute www.cisco.com
traceroute to www.cisco.com (198.133.219.25), 30 hops max, 40 byte packets
1 209.244.188.162 (209.244.188.162) 175 ms 170 ms 171 ms
2 gige7-0-2.hsipacces1.Cincinnati1.Level3.net (63.212.221.2) 154 ms 150 ms 150 ms
3 ge-6-0-0.mp1.Cincinnati1.Level3.net (64.159.0.173) 152 ms 150 ms 149 ms
4 so-3-0-0.mp2.Chicago1.Level3.net (64.159.1.34) 150 ms 149 ms 150 ms
5 pos9-0.core1.Chicago1.level3.net (209.247.10.170) 150 ms 150 ms 151 ms
6 144.232.26.185 (144.232.8.185) 151 ms 152 ms 151 ms
7 sl-bb20-chi-13-0.sprintlink.net (144.242.26.50) 151 ms 150 ms 150 ms
8 sl-bb20-sj-6-0.sprintlink.net (144.232.8.117) 200 ms 201 ms 203 ms 9 sl-gw11-sj-9-0.sprintlink.net (133.232.3.138) 210 ms 211 ms 210 ms 10 sl-ciscopsn2-11-0-0.sprintlink.net (144.228.44.14) 211 ms 210 ms 210 ms
11 sjce-dirty-gw1.cisco.com (128.107.239.89) 210 ms 210 ms 210 ms 12 sjck-sdf-ciod-gw2.cisco.com (128.107.239.12) 209 ms 209 ms 210 ms 13 www.cisco.com (198.133.219.25) 211 ms 210 ms 211 ms
$
The output from the traceroute program shows every router that responds to the expired test packet along the path to the destination host. Along with that information, the round-trip times that it took for the packet to reach each router are displayed (three separate test packets are sent with the same TTL value for each test). Remember that these values are round-trip response times, and can change with different loading on the individual routers.
Networks that use load balancing will show inconsistent route paths between two points on the network, depending on the network load at the time of the test. As with other response-time techniques, the best thing to do in these scenarios is to take baseline tests under various network loads to see how and when each network path is utilized.
Network Utilization
given moment, the Ethernet segment is either at 100-percent utilization (carry-ing a packet), or at 0-percent utilization (idle). The network utilization per-centage shows the perper-centage of time the network is in use over a set period.
Calculating the network utilization requires you to find out how many bytes of network traffic are being handled by the network over a set period. This value depends on the type of network interface that is being monitored.
Half-duplex devices can only carry data in one direction at a time, and therefore calculating their network utilization involves totaling the input and output byte counts for a set period, and dividing by the total capacity of the device interface for that period. To determine the total number of bits received on the interfaces, each of the packet byte rates is multiplied by 8. This value is divided by the total interface capacity multiplied by the time interval of the sample (in seconds):
%utilization = ((datasent + datarecv) * 8) / (intspeed * sampletime) * 100
For example, a 10-MB half-duplex network interface that over a 5-second period sends 700,000 bytes of data and receives 175,000 bytes would have a network utilization of:
%utilization = (((700,000 + 175,000) * 8) / (10,000,000 * 5) * 100 = 14%
The 14-percent utilization represents the network utilization only for that 5-second period. It is not uncommon to see high network utilization for a short period of time, given that Ethernet traffic is often bursty in nature. You have a problem when you take the same calculation for a longer period of time, such as a 5- or 30-minute interval, and still get high network utilization.
Although calculating network utilization on an individual network seg-ment can be easy, determining the network utilization between two separate endpoints on the network can be complex. You must calculate the network uti-lization for each segment traversed along the network path, and determine how each segment’s utilization affects the overall response time of the packet. Due to the complexity of this, most network performance tools utilize differ-ent elemdiffer-ents—the network throughput and the network bandwidth capacity— to determine network performance between two remote network endpoints.
Network Throughput
Determining network throughput allows the network administrator to find network bottlenecks that slow down performance over a given network link between clients and servers. Often a novice network administrator places a group of clients on a high-speed network device, and the application server on another high-speed network device, to increase application performance. How-ever, what the administrator forgets is that the two high-speed devices may be connected via a slow-speed link. Figure 1.2 demonstrates an example of this.
While the networks that contain the client and server devices are high-speed and have good network performance, it is the interconnecting network device that is causing performance problems. First off, the intermediate network link is limiting the overall speed of the end-to-end link to only 10 MB, no matter how fast the clients and server are connected to the network. Second, since the intermediate network device is a shared hub, it may contain other clients and application servers, which puts additional traffic load on the slow-speed link. Usually, finding the network bottleneck is not this simple. On complex net-works, there can be several network devices within the path of clients and servers. The hardest part of determining the network throughput is calculat-ing the effect that each intermediate link has on the overall end-to-end net-work connection.
Calculating network throughput is a mathematical process that is best left to the mathematical geniuses. It involves sending periodic streams of packets, and determining the rate at which the server receives the streams. Each stream sample produces data elements used to determine the amount of bandwidth remaining on the network link. The streams are increased until the maximum bandwidth is observed, then quickly backed off so as not to affect the network performance.
Figure 1.2 Finding the throughput bottleneck.
server
10/100-MB switch
10-MB hub
10/100-MB switch
client
100 MB
100 MB 10 MB
Of course, this calculation is extremely dependent on exiting network appli-cations, and how they load the network at any given time. It is best to calculate network throughput at different times of the day, and on different days of the week. This enables you to gather all of the information on different applica-tions as they are run on the network.
Many new network applications fail due to lack of available network throughput. If an application is tested in a development environment that does not include the other applications that will be running on the network, it is easy to forget about existing network throughput on the production network.
Bandwidth Capacity
Bandwidth capacity is another factor in the determination of network throughput. The total amount of bandwidth available between two network endpoints can greatly affect the performance of a network. Devices directly connected on a 100-MB network switch should have significantly better per-formance than devices that are remotely connected via a slower T1 circuit.
The ability to quantify this performance difference requires complex net-work theory to be built into the netnet-work performance tool. The netnet-work per-formance tool must be able to determine the possible end-to-end network bandwidth available on networks with varying link speeds. Each link that a packet must traverse must be included in the overall network performance of an application.
In an ideal network scenario, a constant data rate should be maintained between a client and a server as packets are sent back and forth. The constant data rate represents the network speed at which the two endpoints are linked together. By observing the time it takes for a packet to traverse the network, you can determine the maximum speed of the network link.
As we all know, there is no such thing as an ideal network scenario. In pro-duction networks, traffic is constantly traveling between network devices, affecting the perceived speed of a network link. In order to determine the max-imum bandwidth capacity of a network link, the network performance tool must do some math tricks.
Figure 1.3 Packet separation in different speed segments.
The packets are sent from a device connected to a 100-MB network device. Along the path to the destination device, the network uses a 10-MB network link. The packets received by the switch device on the 100-MB network must be queued and wait their turn before being sent out on the 10-MB link. This affects the separation between the two packets. Again, on the other end of the network, the 10-MB link is connected to another switch, which in turn queues the packets for transmission on the 100-MB network.
When the packets arrive at the destination, the interval separating them is determined. The difference between the original interval and the calculated interval represents the loading on the network. Once the load value is calcu-lated, a large burst of packets can be sent from the client to the server. The rate at which the packets arrive from the client represents the rate, or speed, at which the network was able to transport the data. Given the load factor and the data rate, the network performance tool can calculate the theoretical maxi-mum speed at which the network link should be able to process data.
Methods of Collecting Performance Data
After determining which network performance elements to monitor, the net-work performance tool must be able to access data for the elements. Three dif-ferent methods are used to obtain data from the network:
■■ Querying network devices for stored information
■■ Watching existing traffic on the network for signs of network performance issues
■■ Generating test traffic to send on the network to test network performance
Part of your job when evaluating a network performance tool is to deter-mine how the tool extracts data about the network’s performance, and if that method is appropriate for your particular network environment. This section describes the three different data-collecting methods, and shows how they can differ when collecting data on the network.
client 100-MB server
Querying Network Devices
One of the simplest methods used to collect network data is to go to the source of the network, the network devices. When purchasing network devices such as hubs and switches, you will find that two types of each network device are available:
■■ Managed network devices ■■ Unmanaged network devices
Managed network devices include management software that collects sta-tistics about the network traffic traversing the device, whether it is a simple network hub or a complex network router. Unmanaged network devices do not collect any statistical information about the network traffic, and cannot be queried for information.
While managed network devices are usually more expensive than unman-aged devices, they are well worth the extra price in large networks. Many net-work management software packages, as well as many freely available open source network performance tools, use the network device management inter-face to extract network information from the managed network devices. This information is invaluable for troubleshooting network problems.
How Tools Query Devices
All managed network devices implement the Simple Network Management Protocol (SNMP). SNMP provides both a mechanism for storing network data in a hierarchical database on the network device, and a protocol for querying the database from a remote device.
All SNMP devices include a common Management Information Base (MIB) that stores basic network information about the traffic on the device. This information includes the bytes transmitted and received per interface, the number and types of errors on the interfaces, and the network utilization on each interface. This information is invaluable for determining network perfor-mance on different segments of the network.
Values to Query
When using SNMP to query network devices, you must know which values are pertinent for network performance information. There are plenty of data objects that can be found in the SNMP MIB tables on network devices, and dumping all of the tables would take an extremely large amount of time and network bandwidth.
The common MIB database provides much of the basic network perfor-mance data used to track perforperfor-mance of a network device. The second ver-sion of the common MIB database (called MIB-2) has been updated to include many error statistics for network devices.
The MIB-2 database objects provide many useful fields that can be used to determine the amount of network traffic and errors on a network device. Querying these values can give you lots of information regarding network traffic on the device. Table 1.1 shows some of the more useful MIB-2 objects that should be considered.
Table 1.1 SNMP MIB Network Performance Objects
OBJECT DESCRIPTION
IfType The physical type of interface
IfSpeed The data rate capacity of the interface
IfMTU The size of the largest data packet the interface can handle
IfAdminStatus The status of the interface (active/inactive)
IfInOctets The total number of octets received by the interface
IfOutOctets The total number of octets sent by the interface
IfInUcasePkts The total number of unicast packets received by the interface
IfOutUcastPkts The total number of unicast packets sent by the interface
IfInNUcastPkts The total number of non-unicast packets (broadcast/multicast) received by the interface
IfOutNUcastPkts The total number of non-unicast packets (broadcast/multicast) sent by the interface
IfInErrors The total number of packets received that contained errors
IfOutErrors The total number of packets that could not be sent because they contained errors
Most of the MIB-2 values are continuous counters. For example, the ifInOctets object counts the number of bytes (octets) received on the interface since it was first powered on (or the MIB-2 database was reset). This value can reach a maximum value, and then roll over to zero and start over. To determine a data rate, most network performance tools query these values over a set period of time, and subtract the difference. Care must be taken when doing this, to ensure that the value has not rolled over to zero between the measur-ing times, affectmeasur-ing the data results.
Network devices that contain multiple ports (such as switches and hubs) maintain a separate MIB-2 table for each interface on the device, as well as a system-wide MIB-2 table. The separate port tables are accessed using special indexing within the MIB value. Chapter 3, “Network Device Utilization,” describes how to access this information using SNMP network tools.
Watching Existing Traffic
Another common technique used for collecting network performance data is to watch existing traffic on the network. A lot of information can be gathered from the network just by watching the packets that are traveling between net-work devices.
In order to capture all of the traffic traveling on the network, a device’s net-work interface must be placed in promiscuous mode. By default, a network inter-face only accepts packets that are destined for the device, or that are sent out on a multicast or broadcast address. Promiscuous mode allows the network interface to read all packets on the network, regardless of their destination. This feature allows the network device to inspect each packet on the network, no matter where it came from, and where it is sent.
T I P When attempting to capture traffic on a network, you must be careful of devices such as switches, bridges, and routers, which segment traffic. If your network device is on one of these types of devices, it will not see all of the traffic on the network.
After the network packets have been captured, they must be decoded and analyzed to see what trends and/or problems exist on the network. A few items that can be seen by analyzing network traffic are:
■■ Packet retransmissions ■■ Frozen TCP window sizes ■■ Broadcast storms
■■ Network advertisements ■■ Chatty applications
Each of these items can be a potential network performance problem, and should be watched in the network monitor.
Generating Test Traffic
Many network performance tools generate their own network traffic to deter-mine the current performance of the network. This technique requires math skills, as well as a knowledge of network theory.
All network performance tools that analyze network performance by gener-ating test traffic require two devices on the network. The network performance along the path between the two devices is determined by using the packet pair and packet train methods, described previously in the Bandwidth Capacity sec-tion. This is demonstrated in Figure 1.4.
In Figure 1.4, the network performance tool determines the performance only between devices A and B. No other paths in the network are tested. In order to test other paths on the network, the testing devices must be relocated to other points in the network. Of course the alternative is to have multiple test device pairs and locate them at different points in the network. The trick is to place the smallest number of testing points that can cover the largest area on the network.
As mentioned, calculating network performance requires you to send pairs and trains of packets across the network. The packet pairs do not take up much network bandwidth, but the packet trains can place a fair amount of data on the network. Care should be taken when using network performance tools that use packet trains, so as not to adversely affect production traffic on the network.
Figure 1.4 Generating test traffic on a network path.
switch network path switch
switch A
B
hub
hub
hub
Summary
This chapter describes what network performance is, and how a network per-formance tool can measure it. Network perper-formance incorporates five separate elements: availability, response time, network utilization, network throughput, and bandwidth capacity.
The availability of the network is crucial for network applications. Testing the availability of the network is often done by using a simple ping test to determine which hosts on the network are reachable. After determining avail-ability, you can measure the response time for various hosts on the network. Different response times can be found based on different network link types and different paths in the network.
Network utilization is measured to determine how much of the network is being used for applications, and the percentage of error transmissions. A work with high utilization will have an increased amount of errors in the net-work traffic. Similar to the netnet-work utilization are the netnet-work throughput and capacity. The capacity is the total amount of data that can theoretically pass between two points on the network. This can be affected by different link speeds across the network, and different types of cables used to connect the network devices. The network throughput represents the amount of network bandwidth currently available for applications.
The are three different methods of collecting network performance data from the network. The Simple Network Management Protocol (SNMP) is used to query managed network devices for network information. SNMP devices store network information in the Management Information Base (MIB) data-base. Information such as bytes received and sent, as well as errors received, is contained in the MIB database. A remote network management workstation can query the MIB database using SNMP to retrieve network information about the device.
Watching network traffic can also determine network performance. Telltale signs such as broadcast storms and packet retransmissions can be seen by cap-turing data as it flows through the network. The last method of collecting net-work performance data is to generate test traffic on the netnet-work. Some network performance tools generate test packets and send them across the net-work to determine the netnet-work capacity and performance. By using packet pairs and packet trains, network performance tools can calculate the network information based on packet separation (the spacing between packets) and throughput rates.
21 As mentioned in Chapter 1, “Defining Network Performance,” watching net-work traffic is one way to determine how well the netnet-work performs. This chapter shows you how to install several network-monitoring software pack-ages for both the Unix and Windows worlds, and how to use them to watch for network traffic problems.
Watching the traffic that traverses a network can often tell you a lot about the health of your network. There are many expensive commercial monitoring tools available to help network administrators capture and decode packets on the network. These products are often standalone devices whose only function is to capture packets and monitor network activity.
However, there are also several good Open Source network monitoring tools that can perform the same functions as the expensive network monitors. Each of these tools can be loaded on an existing Unix or Windows host to mon-itor the network and display and decode the packets that it sees. This enables you to watch the network traffic on a specific server without having to deal with connecting any extra devices.
Catching All the Traffic
By default, network devices only capture packets that are destined for either their specific Media Access Control (MAC) address, or a broadcast or multicast address. To enable a network device to watch other traffic on the network, you
Watching Network Traffic
must place the network card in promiscuous mode. Promiscuous mode enables the network card to forward all packets that it sees to higher-layer programs on the device.
Unfortunately, different network cards require different software hooks to enable promiscuous mode and pass captured packets to the higher-layer pro-grams. To simplify things for programmers, packet-capturing libraries have been created in both the Unix and Windows worlds to provide a common application programming interface (API) for packet capturing. The two most popular packet-capturing libraries are:
■■ The libpcap library for Unix ■■ The winpcap library for Windows
Both of these libraries provide APIs for programs to easily capture packets as they travel past the network card of the host device.
The libpcap Library
The libpcap library was developed at the Lawrence Berkeley National Labora-tory, and is now maintained by an organization called the Tcpdump Group. The libpcap library has been ported to every Unix distribution (including Linux and FreeBSD) to be used as a common method of capturing packets from network interface cards. Most Unix distributions include the libpcap library, and many distributions install it by default.
Downloading and Installing libpcap
If you are interested in using the latest version of libpcap, you can download the source code from the Tcpdump Group Web site and compile it yourself. At the time of this writing, the latest version of libpcap is version 0.7.1, which can be downloaded from www.tcpdump.org/release/libpcap-0.7.1.tar.gz.
After downloading the libpcap distribution file, you must unpack and com-pile it. The distribution file is a compressed tar file, which means that you must uncompress it using the gunzip utility, and extract the distribution files using the tar command. Many implementations of the tar command allow both steps to be performed at once using the –z option:
tar -zxvf libpcap-0.7.1.tar.gz
bison text parsers. For Open Source Unix distributions such as Linux and FreeBSD, the gcc, flex, and bison programs provide these functions.
WA R N I N G The current libpcap distribution requires the 2.5.4 version (or later) of flex to compile.
When you run the configure command, you must reference the local copy of it:
./configure
You should see several lines of output as the configure script checks for sys-tem and compiler features necessary to build the libpcap library. After running the configure script, you can use the make command to compile the library. The output file is called libpcap.a. To install this file on your system, you must change to the root user, and run the make program again, using the install option:
make install
This places the libpcap.a library file in the proper location on the Unix sys-tem, and registers it with the system libraries database. It is now ready to be used by any program that needs to capture network packets from the system network card.
Using libpcap
After the libpcap library is created and installed, you can use it to compile programs that require promiscuous mode access to the network. If you write programs using the libpcap library, you must include the library file in your compiles:
gcc program.c -lpcap
T I P Note that, when using the library, you do not specify the full filename on the compiler command line, just the pcap library name.
The libpcap library contains all of the API function calls that are used by applications to access packets from the network. If you are compiling the source code for the tcpdump program (described later in The tcpdump Program
The winpcap Library
The winpcap library was developed by the NetGroup at the Politecnico di Torino. It was developed as a libpcap-compatible interface for Windows plat-forms. As libpcap does for Unix, winpcap allows Windows programs to inter-face the network card with a common API to read all packets received from the network.
Downloading and Installing winpcap
The main Web site for winpcap can be found at http://winpcap.polito.it. This page contains links to several other pages, including full instructions on how to compile Windows programs with winpcap, as well as the complete winpcap downloads.
The winpcap download page (http://winpcap.polito.it/install/default.htm) provides links for several downloads:
■■ The latest winpcap binary package
■■ A developer’s pack that includes library and header files for compiling applications with winpcap
■■ A source code pack that includes the full source code for the winpcap library
T I P Besides the most current production version of winpcap, there is often a development version of winpcap available for testing. As with all development software, you should be careful not to use this version in a production
environment on a system you would not want to crash.
At the time of this writing, the most current production version of winpcap is version 2.3. If you are running Windows XP Home Edition or Professional, you must use at least the 2.3 version. Older versions of the library do not work on that platform. The binary installation file is downloaded as http:// winpcap.polito.it/install.bin/WinPcap_2_3.exe.
Since the installation file is a binary executable file, after downloading the installation file, you can run it without modification. The winpcap installation program contains two separate files. The wpcap.dll file is the direct replace-ment for the libpcap.a library file for the Windows environreplace-ment. It provides the APIs that read packets from the network interface. The packet.dll library file provides additional functionality by allowing programs to send raw pack-ets out to the network interface as well.